Hmong vs Malaysian Wage/Income Gap
COMPARE
Hmong
Malaysian
Wage/Income Gap
Wage/Income Gap Comparison
Hmong
Malaysians
27.7%
WAGE/INCOME GAP
1.0/ 100
METRIC RATING
266th/ 347
METRIC RANK
25.0%
WAGE/INCOME GAP
84.9/ 100
METRIC RATING
147th/ 347
METRIC RANK
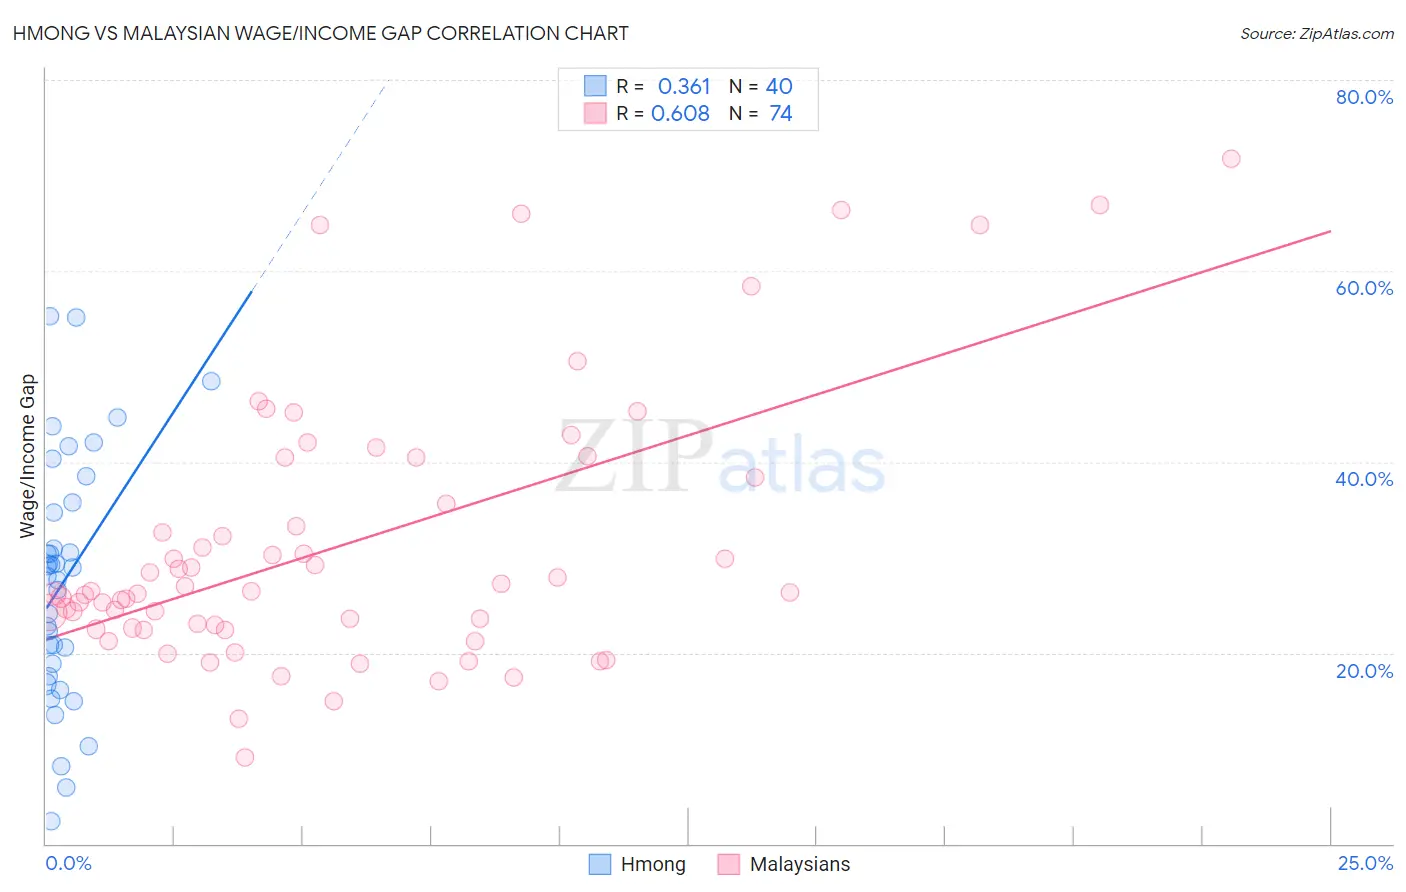
Hmong vs Malaysian Wage/Income Gap Correlation Chart
The statistical analysis conducted on geographies consisting of 24,681,537 people shows a mild positive correlation between the proportion of Hmong and wage/income gap percentage in the United States with a correlation coefficient (R) of 0.361 and weighted average of 27.7%. Similarly, the statistical analysis conducted on geographies consisting of 226,066,613 people shows a significant positive correlation between the proportion of Malaysians and wage/income gap percentage in the United States with a correlation coefficient (R) of 0.608 and weighted average of 25.0%, a difference of 10.6%.
Wage/Income Gap Correlation Summary
| Measurement | Hmong | Malaysian |
| Minimum | 2.4% | 9.0% |
| Maximum | 55.2% | 71.7% |
| Range | 52.9% | 62.7% |
| Mean | 27.5% | 31.3% |
| Median | 28.4% | 26.4% |
| Interquartile 25% (IQ1) | 18.2% | 22.6% |
| Interquartile 75% (IQ3) | 35.2% | 38.4% |
| Interquartile Range (IQR) | 17.0% | 15.8% |
| Standard Deviation (Sample) | 12.7% | 14.0% |
| Standard Deviation (Population) | 12.6% | 13.9% |
Similar Demographics by Wage/Income Gap
Demographics Similar to Hmong by Wage/Income Gap
In terms of wage/income gap, the demographic groups most similar to Hmong are Serbian (27.7%, a difference of 0.0%), Immigrants from Switzerland (27.7%, a difference of 0.010%), Turkish (27.7%, a difference of 0.020%), New Zealander (27.7%, a difference of 0.10%), and Potawatomi (27.7%, a difference of 0.11%).
| Demographics | Rating | Rank | Wage/Income Gap |
| Icelanders | 1.8 /100 | #259 | Tragic 27.5% |
| Tongans | 1.7 /100 | #260 | Tragic 27.5% |
| Immigrants | Germany | 1.5 /100 | #261 | Tragic 27.5% |
| Immigrants | Lebanon | 1.5 /100 | #262 | Tragic 27.5% |
| Syrians | 1.4 /100 | #263 | Tragic 27.6% |
| Immigrants | Switzerland | 1.0 /100 | #264 | Tragic 27.7% |
| Serbians | 1.0 /100 | #265 | Tragic 27.7% |
| Hmong | 1.0 /100 | #266 | Tragic 27.7% |
| Turks | 1.0 /100 | #267 | Tragic 27.7% |
| New Zealanders | 1.0 /100 | #268 | Tragic 27.7% |
| Potawatomi | 0.9 /100 | #269 | Tragic 27.7% |
| Immigrants | Western Europe | 0.9 /100 | #270 | Tragic 27.8% |
| Ute | 0.8 /100 | #271 | Tragic 27.8% |
| Immigrants | Korea | 0.8 /100 | #272 | Tragic 27.8% |
| Bulgarians | 0.7 /100 | #273 | Tragic 27.8% |
Demographics Similar to Malaysians by Wage/Income Gap
In terms of wage/income gap, the demographic groups most similar to Malaysians are Comanche (25.0%, a difference of 0.030%), South American (25.0%, a difference of 0.030%), Iroquois (25.1%, a difference of 0.14%), Chippewa (25.0%, a difference of 0.27%), and Immigrants from Peru (25.1%, a difference of 0.28%).
| Demographics | Rating | Rank | Wage/Income Gap |
| Immigrants | Nepal | 89.3 /100 | #140 | Excellent 24.9% |
| Hawaiians | 89.3 /100 | #141 | Excellent 24.9% |
| Afghans | 88.1 /100 | #142 | Excellent 24.9% |
| Immigrants | Uganda | 88.0 /100 | #143 | Excellent 24.9% |
| Chippewa | 86.9 /100 | #144 | Excellent 25.0% |
| Comanche | 85.2 /100 | #145 | Excellent 25.0% |
| South Americans | 85.2 /100 | #146 | Excellent 25.0% |
| Malaysians | 84.9 /100 | #147 | Excellent 25.0% |
| Iroquois | 83.9 /100 | #148 | Excellent 25.1% |
| Immigrants | Peru | 82.6 /100 | #149 | Excellent 25.1% |
| Immigrants | Immigrants | 82.3 /100 | #150 | Excellent 25.1% |
| Taiwanese | 81.6 /100 | #151 | Excellent 25.1% |
| Uruguayans | 81.3 /100 | #152 | Excellent 25.2% |
| Blackfeet | 78.1 /100 | #153 | Good 25.2% |
| Immigrants | Northern Africa | 78.1 /100 | #154 | Good 25.2% |