Delaware vs Scotch-Irish Wage/Income Gap
COMPARE
Delaware
Scotch-Irish
Wage/Income Gap
Wage/Income Gap Comparison
Delaware
Scotch-Irish
26.3%
WAGE/INCOME GAP
20.9/ 100
METRIC RATING
200th/ 347
METRIC RANK
28.5%
WAGE/INCOME GAP
0.2/ 100
METRIC RATING
302nd/ 347
METRIC RANK
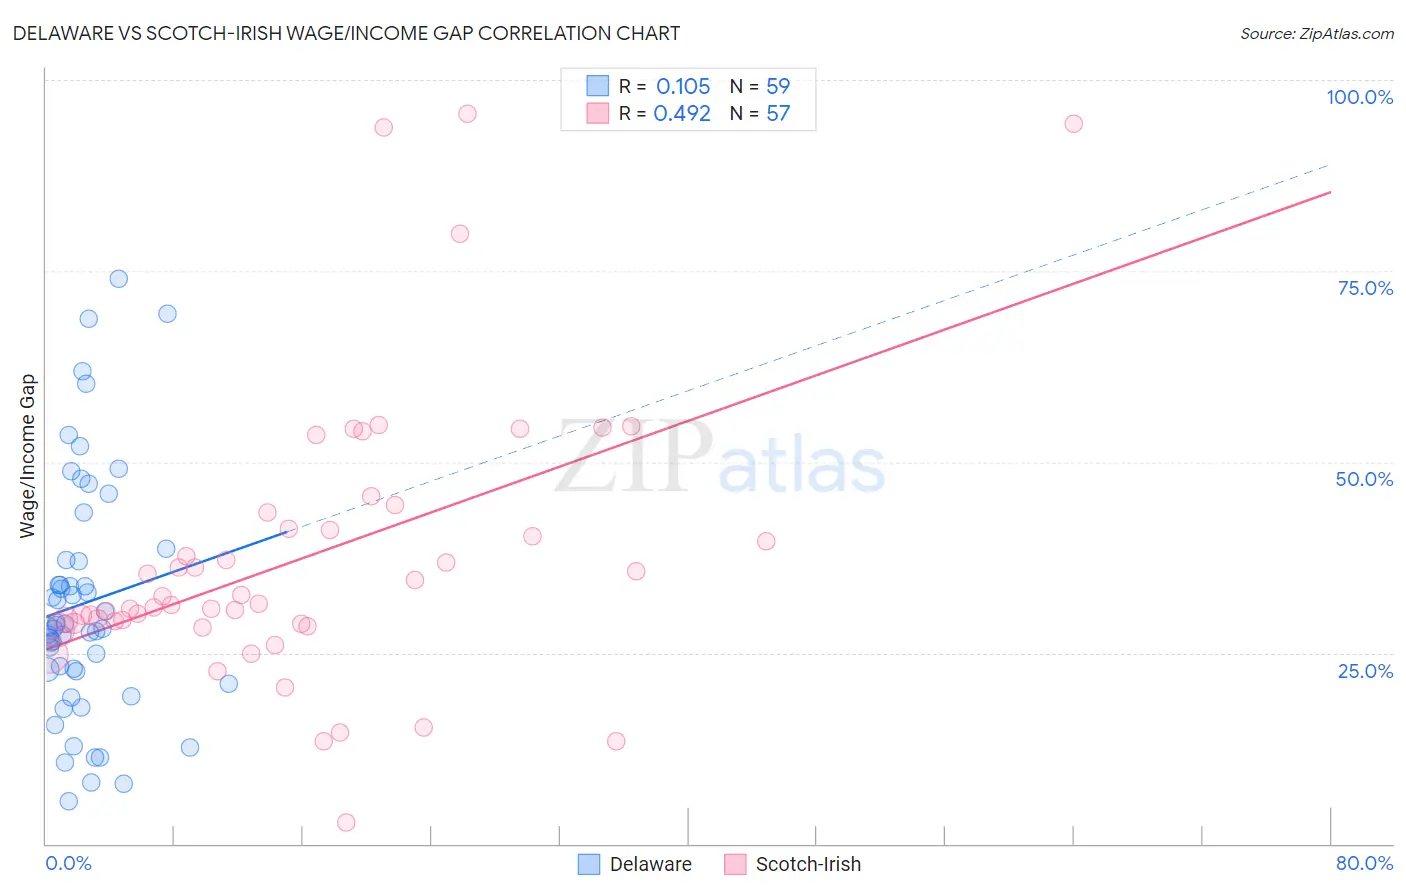
Delaware vs Scotch-Irish Wage/Income Gap Correlation Chart
The statistical analysis conducted on geographies consisting of 96,192,604 people shows a poor positive correlation between the proportion of Delaware and wage/income gap percentage in the United States with a correlation coefficient (R) of 0.105 and weighted average of 26.3%. Similarly, the statistical analysis conducted on geographies consisting of 546,535,842 people shows a moderate positive correlation between the proportion of Scotch-Irish and wage/income gap percentage in the United States with a correlation coefficient (R) of 0.492 and weighted average of 28.5%, a difference of 8.2%.
Wage/Income Gap Correlation Summary
| Measurement | Delaware | Scotch-Irish |
| Minimum | 5.5% | 2.8% |
| Maximum | 73.9% | 95.6% |
| Range | 68.4% | 92.8% |
| Mean | 31.5% | 37.5% |
| Median | 28.4% | 31.4% |
| Interquartile 25% (IQ1) | 22.7% | 28.8% |
| Interquartile 75% (IQ3) | 37.2% | 42.3% |
| Interquartile Range (IQR) | 14.5% | 13.5% |
| Standard Deviation (Sample) | 15.7% | 18.6% |
| Standard Deviation (Population) | 15.5% | 18.4% |
Similar Demographics by Wage/Income Gap
Demographics Similar to Delaware by Wage/Income Gap
In terms of wage/income gap, the demographic groups most similar to Delaware are Dutch West Indian (26.3%, a difference of 0.010%), Venezuelan (26.3%, a difference of 0.050%), Zimbabwean (26.3%, a difference of 0.070%), Immigrants from Western Asia (26.3%, a difference of 0.080%), and Immigrants from Malaysia (26.3%, a difference of 0.12%).
| Demographics | Rating | Rank | Wage/Income Gap |
| Immigrants | Jordan | 22.4 /100 | #193 | Fair 26.3% |
| Chileans | 22.3 /100 | #194 | Fair 26.3% |
| Immigrants | Malaysia | 22.2 /100 | #195 | Fair 26.3% |
| Immigrants | Western Asia | 21.7 /100 | #196 | Fair 26.3% |
| Zimbabweans | 21.6 /100 | #197 | Fair 26.3% |
| Venezuelans | 21.5 /100 | #198 | Fair 26.3% |
| Dutch West Indians | 21.0 /100 | #199 | Fair 26.3% |
| Delaware | 20.9 /100 | #200 | Fair 26.3% |
| Immigrants | Syria | 19.3 /100 | #201 | Poor 26.4% |
| Laotians | 19.2 /100 | #202 | Poor 26.4% |
| Immigrants | Eastern Europe | 19.2 /100 | #203 | Poor 26.4% |
| Immigrants | Russia | 19.0 /100 | #204 | Poor 26.4% |
| Immigrants | Southern Europe | 17.3 /100 | #205 | Poor 26.4% |
| Indians (Asian) | 16.5 /100 | #206 | Poor 26.4% |
| Immigrants | Italy | 15.8 /100 | #207 | Poor 26.5% |
Demographics Similar to Scotch-Irish by Wage/Income Gap
In terms of wage/income gap, the demographic groups most similar to Scotch-Irish are Irish (28.5%, a difference of 0.0%), Immigrants from Canada (28.5%, a difference of 0.030%), Immigrants from Northern Europe (28.5%, a difference of 0.070%), Immigrants from Netherlands (28.5%, a difference of 0.080%), and Immigrants from South Africa (28.5%, a difference of 0.10%).
| Demographics | Rating | Rank | Wage/Income Gap |
| Slovenes | 0.3 /100 | #295 | Tragic 28.3% |
| Northern Europeans | 0.3 /100 | #296 | Tragic 28.3% |
| Immigrants | North America | 0.2 /100 | #297 | Tragic 28.4% |
| Austrians | 0.2 /100 | #298 | Tragic 28.4% |
| Immigrants | North Macedonia | 0.2 /100 | #299 | Tragic 28.4% |
| Immigrants | Northern Europe | 0.2 /100 | #300 | Tragic 28.5% |
| Immigrants | Canada | 0.2 /100 | #301 | Tragic 28.5% |
| Scotch-Irish | 0.2 /100 | #302 | Tragic 28.5% |
| Irish | 0.2 /100 | #303 | Tragic 28.5% |
| Immigrants | Netherlands | 0.2 /100 | #304 | Tragic 28.5% |
| Immigrants | South Africa | 0.1 /100 | #305 | Tragic 28.5% |
| Whites/Caucasians | 0.1 /100 | #306 | Tragic 28.5% |
| Immigrants | Denmark | 0.1 /100 | #307 | Tragic 28.5% |
| Poles | 0.1 /100 | #308 | Tragic 28.5% |
| Macedonians | 0.1 /100 | #309 | Tragic 28.6% |