Cuban vs Subsaharan African Wage/Income Gap
COMPARE
Cuban
Subsaharan African
Wage/Income Gap
Wage/Income Gap Comparison
Cubans
Sub-Saharan Africans
23.3%
WAGE/INCOME GAP
99.7/ 100
METRIC RATING
84th/ 347
METRIC RANK
22.8%
WAGE/INCOME GAP
99.9/ 100
METRIC RATING
72nd/ 347
METRIC RANK
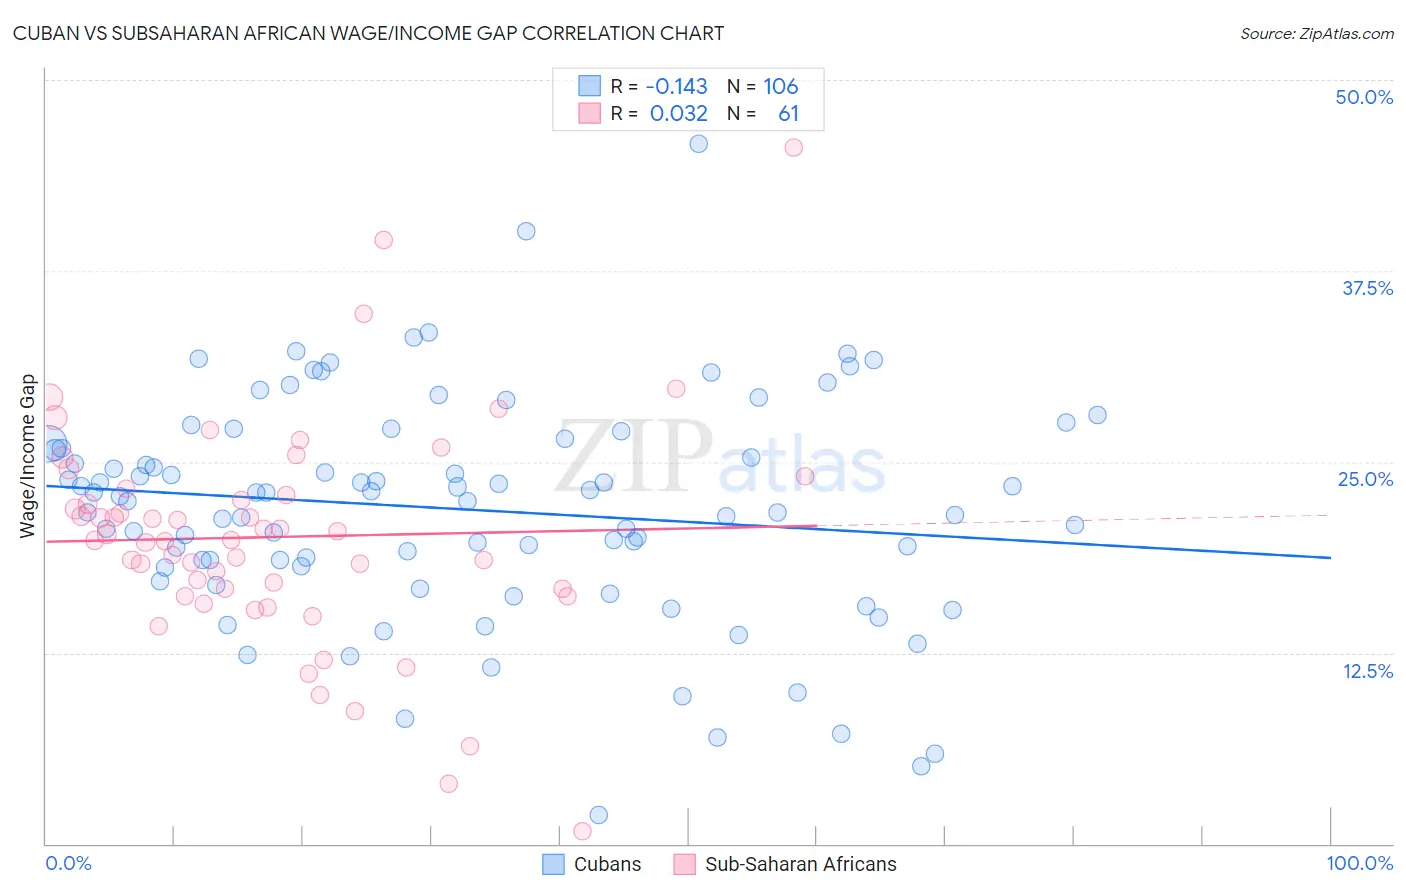
Cuban vs Subsaharan African Wage/Income Gap Correlation Chart
The statistical analysis conducted on geographies consisting of 448,898,454 people shows a poor negative correlation between the proportion of Cubans and wage/income gap percentage in the United States with a correlation coefficient (R) of -0.143 and weighted average of 23.3%. Similarly, the statistical analysis conducted on geographies consisting of 507,315,173 people shows no correlation between the proportion of Sub-Saharan Africans and wage/income gap percentage in the United States with a correlation coefficient (R) of 0.032 and weighted average of 22.8%, a difference of 1.9%.
Wage/Income Gap Correlation Summary
| Measurement | Cuban | Subsaharan African |
| Minimum | 1.9% | 0.79% |
| Maximum | 45.8% | 45.6% |
| Range | 43.9% | 44.8% |
| Mean | 21.9% | 20.1% |
| Median | 22.6% | 19.9% |
| Interquartile 25% (IQ1) | 18.2% | 16.4% |
| Interquartile 75% (IQ3) | 26.2% | 23.0% |
| Interquartile Range (IQR) | 8.0% | 6.6% |
| Standard Deviation (Sample) | 7.3% | 7.4% |
| Standard Deviation (Population) | 7.3% | 7.4% |
Demographics Similar to Cubans and Sub-Saharan Africans by Wage/Income Gap
In terms of wage/income gap, the demographic groups most similar to Cubans are Immigrants from Cambodia (23.3%, a difference of 0.050%), Cheyenne (23.3%, a difference of 0.26%), Yuman (23.3%, a difference of 0.31%), Immigrants from Africa (23.2%, a difference of 0.37%), and Immigrants from Panama (23.4%, a difference of 0.63%). Similarly, the demographic groups most similar to Sub-Saharan Africans are Immigrants from Eastern Africa (22.8%, a difference of 0.030%), Immigrants from Burma/Myanmar (22.8%, a difference of 0.11%), Immigrants from El Salvador (22.8%, a difference of 0.15%), Immigrants from Uzbekistan (22.7%, a difference of 0.31%), and Fijian (22.9%, a difference of 0.39%).
| Demographics | Rating | Rank | Wage/Income Gap |
| Immigrants | Nigeria | 99.9 /100 | #68 | Exceptional 22.7% |
| Indonesians | 99.9 /100 | #69 | Exceptional 22.7% |
| Immigrants | Uzbekistan | 99.9 /100 | #70 | Exceptional 22.7% |
| Immigrants | El Salvador | 99.9 /100 | #71 | Exceptional 22.8% |
| Sub-Saharan Africans | 99.9 /100 | #72 | Exceptional 22.8% |
| Immigrants | Eastern Africa | 99.9 /100 | #73 | Exceptional 22.8% |
| Immigrants | Burma/Myanmar | 99.9 /100 | #74 | Exceptional 22.8% |
| Fijians | 99.9 /100 | #75 | Exceptional 22.9% |
| Ecuadorians | 99.9 /100 | #76 | Exceptional 22.9% |
| Africans | 99.9 /100 | #77 | Exceptional 22.9% |
| Nigerians | 99.9 /100 | #78 | Exceptional 23.0% |
| Immigrants | Nicaragua | 99.9 /100 | #79 | Exceptional 23.0% |
| Salvadorans | 99.9 /100 | #80 | Exceptional 23.0% |
| Bermudans | 99.8 /100 | #81 | Exceptional 23.1% |
| Central Americans | 99.8 /100 | #82 | Exceptional 23.1% |
| Immigrants | Africa | 99.8 /100 | #83 | Exceptional 23.2% |
| Cubans | 99.7 /100 | #84 | Exceptional 23.3% |
| Immigrants | Cambodia | 99.7 /100 | #85 | Exceptional 23.3% |
| Cheyenne | 99.7 /100 | #86 | Exceptional 23.3% |
| Yuman | 99.7 /100 | #87 | Exceptional 23.3% |
| Immigrants | Panama | 99.6 /100 | #88 | Exceptional 23.4% |