Cuban vs Immigrants from Belgium Wage/Income Gap
COMPARE
Cuban
Immigrants from Belgium
Wage/Income Gap
Wage/Income Gap Comparison
Cubans
Immigrants from Belgium
23.3%
WAGE/INCOME GAP
99.7/ 100
METRIC RATING
84th/ 347
METRIC RANK
29.0%
WAGE/INCOME GAP
0.0/ 100
METRIC RATING
326th/ 347
METRIC RANK
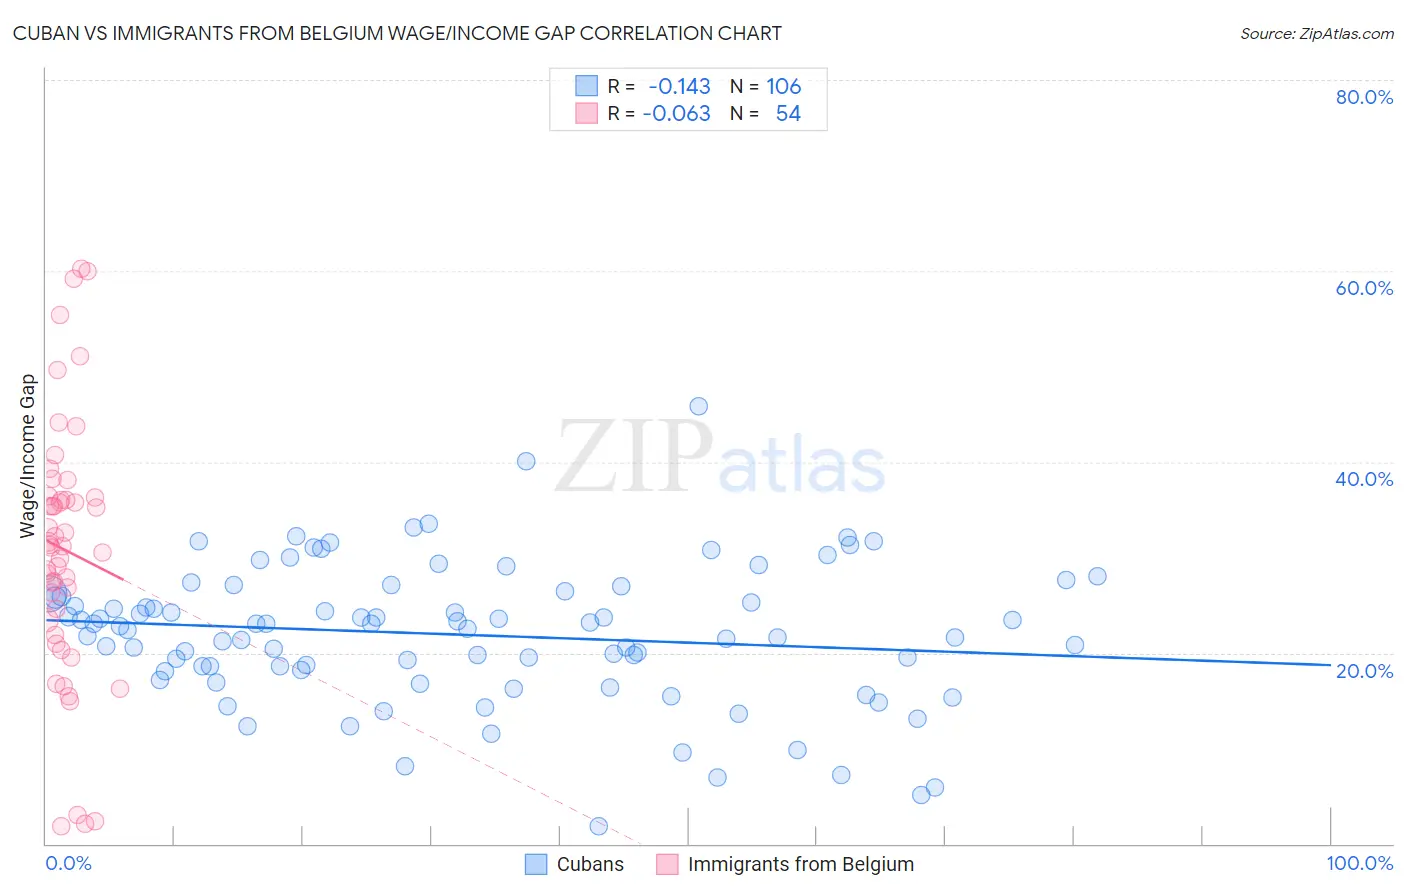
Cuban vs Immigrants from Belgium Wage/Income Gap Correlation Chart
The statistical analysis conducted on geographies consisting of 448,898,454 people shows a poor negative correlation between the proportion of Cubans and wage/income gap percentage in the United States with a correlation coefficient (R) of -0.143 and weighted average of 23.3%. Similarly, the statistical analysis conducted on geographies consisting of 146,675,881 people shows a slight negative correlation between the proportion of Immigrants from Belgium and wage/income gap percentage in the United States with a correlation coefficient (R) of -0.063 and weighted average of 29.0%, a difference of 24.8%.
Wage/Income Gap Correlation Summary
| Measurement | Cuban | Immigrants from Belgium |
| Minimum | 1.9% | 1.8% |
| Maximum | 45.8% | 60.2% |
| Range | 43.9% | 58.4% |
| Mean | 21.9% | 30.8% |
| Median | 22.6% | 31.2% |
| Interquartile 25% (IQ1) | 18.2% | 23.4% |
| Interquartile 75% (IQ3) | 26.2% | 36.3% |
| Interquartile Range (IQR) | 8.0% | 12.9% |
| Standard Deviation (Sample) | 7.3% | 13.5% |
| Standard Deviation (Population) | 7.3% | 13.4% |
Similar Demographics by Wage/Income Gap
Demographics Similar to Cubans by Wage/Income Gap
In terms of wage/income gap, the demographic groups most similar to Cubans are Immigrants from Cambodia (23.3%, a difference of 0.050%), Cheyenne (23.3%, a difference of 0.26%), Yuman (23.3%, a difference of 0.31%), Immigrants from Africa (23.2%, a difference of 0.37%), and Immigrants from Panama (23.4%, a difference of 0.63%).
| Demographics | Rating | Rank | Wage/Income Gap |
| Africans | 99.9 /100 | #77 | Exceptional 22.9% |
| Nigerians | 99.9 /100 | #78 | Exceptional 23.0% |
| Immigrants | Nicaragua | 99.9 /100 | #79 | Exceptional 23.0% |
| Salvadorans | 99.9 /100 | #80 | Exceptional 23.0% |
| Bermudans | 99.8 /100 | #81 | Exceptional 23.1% |
| Central Americans | 99.8 /100 | #82 | Exceptional 23.1% |
| Immigrants | Africa | 99.8 /100 | #83 | Exceptional 23.2% |
| Cubans | 99.7 /100 | #84 | Exceptional 23.3% |
| Immigrants | Cambodia | 99.7 /100 | #85 | Exceptional 23.3% |
| Cheyenne | 99.7 /100 | #86 | Exceptional 23.3% |
| Yuman | 99.7 /100 | #87 | Exceptional 23.3% |
| Immigrants | Panama | 99.6 /100 | #88 | Exceptional 23.4% |
| Marshallese | 99.6 /100 | #89 | Exceptional 23.4% |
| Nicaraguans | 99.6 /100 | #90 | Exceptional 23.4% |
| Arapaho | 99.6 /100 | #91 | Exceptional 23.5% |
Demographics Similar to Immigrants from Belgium by Wage/Income Gap
In terms of wage/income gap, the demographic groups most similar to Immigrants from Belgium are Hungarian (29.0%, a difference of 0.070%), Immigrants from Iran (29.1%, a difference of 0.11%), Scandinavian (29.1%, a difference of 0.17%), Croatian (29.0%, a difference of 0.20%), and Scottish (29.1%, a difference of 0.31%).
| Demographics | Rating | Rank | Wage/Income Gap |
| Slovaks | 0.1 /100 | #319 | Tragic 28.9% |
| British | 0.1 /100 | #320 | Tragic 28.9% |
| Welsh | 0.1 /100 | #321 | Tragic 28.9% |
| Immigrants | Singapore | 0.1 /100 | #322 | Tragic 28.9% |
| Norwegians | 0.1 /100 | #323 | Tragic 29.0% |
| Croatians | 0.0 /100 | #324 | Tragic 29.0% |
| Hungarians | 0.0 /100 | #325 | Tragic 29.0% |
| Immigrants | Belgium | 0.0 /100 | #326 | Tragic 29.0% |
| Immigrants | Iran | 0.0 /100 | #327 | Tragic 29.1% |
| Scandinavians | 0.0 /100 | #328 | Tragic 29.1% |
| Scottish | 0.0 /100 | #329 | Tragic 29.1% |
| Germans | 0.0 /100 | #330 | Tragic 29.2% |
| Czechs | 0.0 /100 | #331 | Tragic 29.2% |
| Immigrants | South Central Asia | 0.0 /100 | #332 | Tragic 29.3% |
| Europeans | 0.0 /100 | #333 | Tragic 29.4% |