Cuban vs Immigrants from Belarus Wage/Income Gap
COMPARE
Cuban
Immigrants from Belarus
Wage/Income Gap
Wage/Income Gap Comparison
Cubans
Immigrants from Belarus
23.3%
WAGE/INCOME GAP
99.7/ 100
METRIC RATING
84th/ 347
METRIC RANK
25.7%
WAGE/INCOME GAP
52.9/ 100
METRIC RATING
173rd/ 347
METRIC RANK
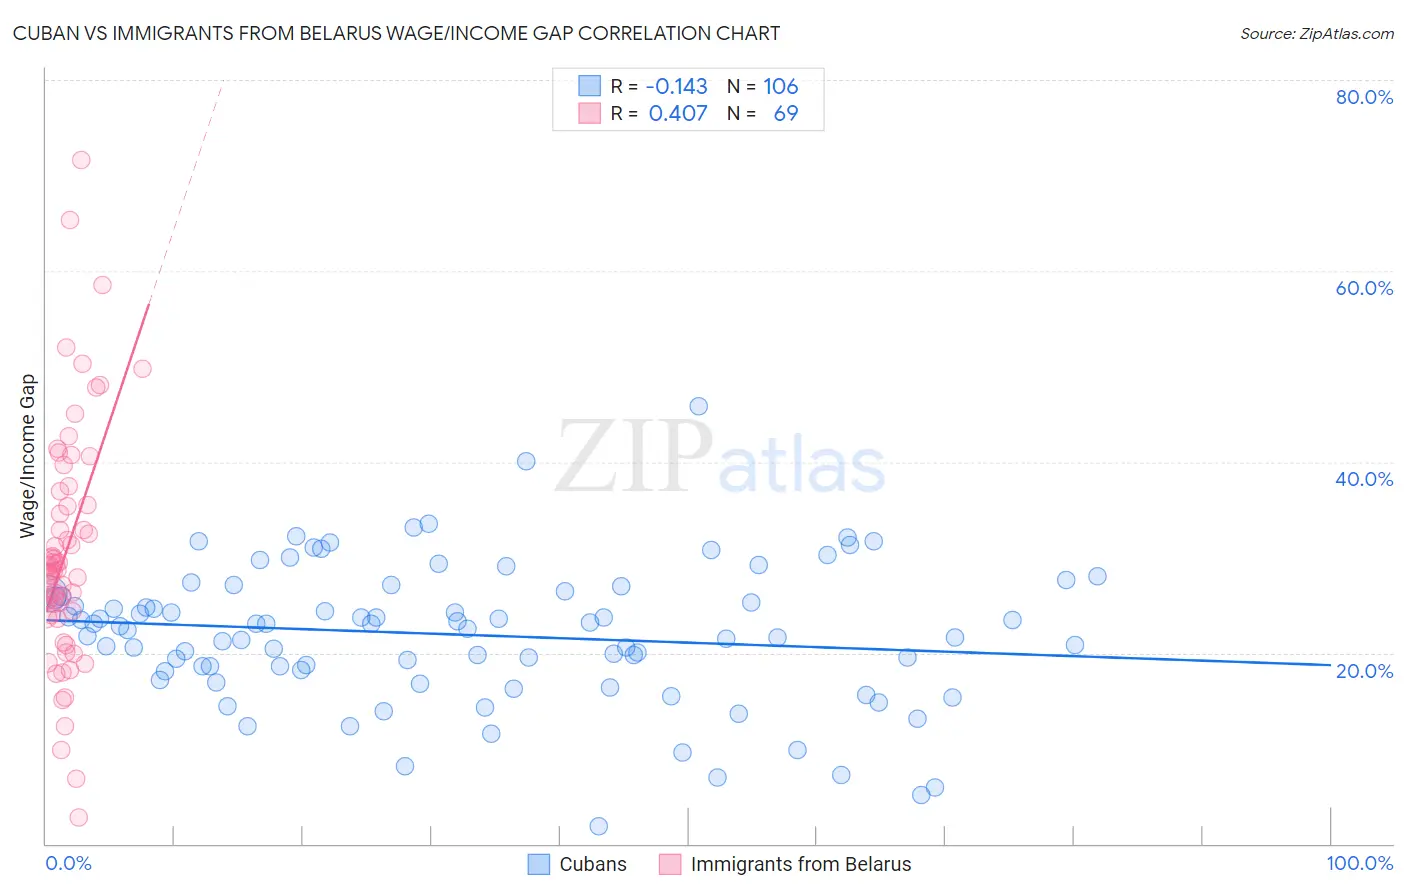
Cuban vs Immigrants from Belarus Wage/Income Gap Correlation Chart
The statistical analysis conducted on geographies consisting of 448,898,454 people shows a poor negative correlation between the proportion of Cubans and wage/income gap percentage in the United States with a correlation coefficient (R) of -0.143 and weighted average of 23.3%. Similarly, the statistical analysis conducted on geographies consisting of 150,180,319 people shows a moderate positive correlation between the proportion of Immigrants from Belarus and wage/income gap percentage in the United States with a correlation coefficient (R) of 0.407 and weighted average of 25.7%, a difference of 10.6%.
Wage/Income Gap Correlation Summary
| Measurement | Cuban | Immigrants from Belarus |
| Minimum | 1.9% | 2.8% |
| Maximum | 45.8% | 71.7% |
| Range | 43.9% | 68.9% |
| Mean | 21.9% | 30.5% |
| Median | 22.6% | 28.7% |
| Interquartile 25% (IQ1) | 18.2% | 23.9% |
| Interquartile 75% (IQ3) | 26.2% | 36.2% |
| Interquartile Range (IQR) | 8.0% | 12.3% |
| Standard Deviation (Sample) | 7.3% | 12.5% |
| Standard Deviation (Population) | 7.3% | 12.4% |
Similar Demographics by Wage/Income Gap
Demographics Similar to Cubans by Wage/Income Gap
In terms of wage/income gap, the demographic groups most similar to Cubans are Immigrants from Cambodia (23.3%, a difference of 0.050%), Cheyenne (23.3%, a difference of 0.26%), Yuman (23.3%, a difference of 0.31%), Immigrants from Africa (23.2%, a difference of 0.37%), and Immigrants from Panama (23.4%, a difference of 0.63%).
| Demographics | Rating | Rank | Wage/Income Gap |
| Africans | 99.9 /100 | #77 | Exceptional 22.9% |
| Nigerians | 99.9 /100 | #78 | Exceptional 23.0% |
| Immigrants | Nicaragua | 99.9 /100 | #79 | Exceptional 23.0% |
| Salvadorans | 99.9 /100 | #80 | Exceptional 23.0% |
| Bermudans | 99.8 /100 | #81 | Exceptional 23.1% |
| Central Americans | 99.8 /100 | #82 | Exceptional 23.1% |
| Immigrants | Africa | 99.8 /100 | #83 | Exceptional 23.2% |
| Cubans | 99.7 /100 | #84 | Exceptional 23.3% |
| Immigrants | Cambodia | 99.7 /100 | #85 | Exceptional 23.3% |
| Cheyenne | 99.7 /100 | #86 | Exceptional 23.3% |
| Yuman | 99.7 /100 | #87 | Exceptional 23.3% |
| Immigrants | Panama | 99.6 /100 | #88 | Exceptional 23.4% |
| Marshallese | 99.6 /100 | #89 | Exceptional 23.4% |
| Nicaraguans | 99.6 /100 | #90 | Exceptional 23.4% |
| Arapaho | 99.6 /100 | #91 | Exceptional 23.5% |
Demographics Similar to Immigrants from Belarus by Wage/Income Gap
In terms of wage/income gap, the demographic groups most similar to Immigrants from Belarus are Immigrants from Chile (25.7%, a difference of 0.020%), Alaskan Athabascan (25.8%, a difference of 0.19%), Immigrants from Greece (25.7%, a difference of 0.24%), Immigrants from Oceania (25.6%, a difference of 0.31%), and Sri Lankan (25.8%, a difference of 0.39%).
| Demographics | Rating | Rank | Wage/Income Gap |
| Immigrants | Ukraine | 63.8 /100 | #166 | Good 25.5% |
| Paiute | 62.9 /100 | #167 | Good 25.5% |
| Seminole | 62.6 /100 | #168 | Good 25.6% |
| Peruvians | 60.1 /100 | #169 | Good 25.6% |
| Immigrants | Oceania | 57.5 /100 | #170 | Average 25.6% |
| Immigrants | Greece | 56.6 /100 | #171 | Average 25.7% |
| Immigrants | Chile | 53.2 /100 | #172 | Average 25.7% |
| Immigrants | Belarus | 52.9 /100 | #173 | Average 25.7% |
| Alaskan Athabascans | 50.0 /100 | #174 | Average 25.8% |
| Sri Lankans | 47.0 /100 | #175 | Average 25.8% |
| Paraguayans | 46.7 /100 | #176 | Average 25.8% |
| Cambodians | 45.1 /100 | #177 | Average 25.8% |
| Chinese | 42.0 /100 | #178 | Average 25.9% |
| Samoans | 38.6 /100 | #179 | Fair 26.0% |
| Guamanians/Chamorros | 38.0 /100 | #180 | Fair 26.0% |