Alaskan Athabascan 4 or more Vehicles in Household

COMPARE

Alaskan Athabascan
Race
Ancestry
AfghanAfricanAlaska NativeAlaskan AthabascanAlbanianAleutAlsatianAmericanApacheArabArapahoArgentineanArmenianAssyrian/Chaldean/SyriacAustralianAustrianBahamianBangladeshiBarbadianBasqueBelgianBelizeanBermudanBhutaneseBlackfeetBolivianBrazilianBritishBritish West IndianBulgarianBurmeseCajunCambodianCanadianCape VerdeanCarpatho RusynCelticCentral AmericanCentral American IndianCherokeeCheyenneChickasawChileanChineseChippewaChoctawColombianColvilleComancheCosta RicanCreeCreekCroatianCrowCubanCypriotCzechCzechoslovakianDanishDelawareDominicanDutchDutch West IndianEastern EuropeanEcuadorianEgyptianEnglishEstonianEthiopianEuropeanFijianFilipinoFinnishFrenchFrench American IndianFrench CanadianGermanGerman RussianGhanaianGreekGuamanian/ChamorroGuatemalanGuyaneseHaitianHmongHonduranHopiHoumaHungarianIcelanderIndian (Asian)IndonesianInupiatIranianIraqiIrishIroquoisIsraeliItalianJamaicanJapaneseJordanianKenyanKiowaKoreanLaotianLatvianLebaneseLiberianLithuanianLumbeeLuxembourgerMacedonianMalaysianMalteseMarshalleseMenomineeMexicanMexican American IndianMongolianMoroccanNative HawaiianNavajoNepaleseNew ZealanderNicaraguanNigerianNorthern EuropeanNorwegianOkinawanOsageOttawaPaiutePakistaniPalestinianPanamanianParaguayanPennsylvania GermanPeruvianPimaPolishPortuguesePotawatomiPuebloPuerto RicanPuget Sound SalishRomanianRussianSalvadoranSamoanScandinavianScotch-IrishScottishSeminoleSenegaleseSerbianShoshoneSierra LeoneanSiouxSlavicSlovakSloveneSomaliSouth AfricanSouth AmericanSouth American IndianSoviet UnionSpaniardSpanishSpanish AmericanSpanish American IndianSri LankanSubsaharan AfricanSudaneseSwedishSwissSyrianTaiwaneseThaiTlingit-HaidaTohono O'OdhamTonganTrinidadian and TobagonianTsimshianTurkishU.S. Virgin IslanderUgandanUkrainianUruguayanUteVenezuelanVietnameseWelshWest IndianYakamaYaquiYugoslavianYumanYup'ikZimbabwean
Immigration
NonimmigrantsImmigrantsAfghanistanAfricaAlbaniaArgentinaArmeniaAsiaAustraliaAustriaBahamasBangladeshBarbadosBelarusBelgiumBelizeBoliviaBosnia and HerzegovinaBrazilBulgariaBurma/MyanmarCabo VerdeCambodiaCameroonCanadaCaribbeanCentral AmericaChileChinaColombiaCongoCosta RicaCroatiaCubaCzechoslovakiaDenmarkDominicaDominican RepublicEastern AfricaEastern AsiaEastern EuropeEcuadorEgyptEl SalvadorEnglandEritreaEthiopiaEuropeFijiFranceGermanyGhanaGreeceGrenadaGuatemalaGuyanaHaitiHondurasHong KongHungaryIndiaIndonesiaIranIraqIrelandIsraelItalyJamaicaJapanJordanKazakhstanKenyaKoreaKuwaitLaosLatin AmericaLatviaLebanonLiberiaLithuaniaMalaysiaMexicoMicronesiaMiddle AfricaMoldovaMoroccoNepalNetherlandsNicaraguaNigeriaNorth AmericaNorth MacedoniaNorthern AfricaNorthern EuropeNorwayOceaniaPakistanPanamaPeruPhilippinesPolandPortugalRomaniaRussiaSaudi ArabiaScotlandSenegalSerbiaSierra LeoneSingaporeSomaliaSouth AfricaSouth AmericaSouth Central AsiaSouth Eastern AsiaSouthern EuropeSpainSri LankaSt. Vincent and the GrenadinesSudanSwedenSwitzerlandSyriaTaiwanThailandTrinidad and TobagoTurkeyUgandaUkraineUruguayUzbekistanVenezuelaVietnamWest IndiesWestern AfricaWestern AsiaWestern EuropeYemenZaireZimbabweAzores
Select to Compare
Race
Ancestry
AfghanAfricanAlaska NativeAlbanianAleutAlsatianAmericanApacheArabArapahoArgentineanArmenianAssyrian/Chaldean/SyriacAustralianAustrianBahamianBangladeshiBarbadianBasqueBelgianBelizeanBermudanBhutaneseBlackfeetBolivianBrazilianBritishBritish West IndianBulgarianBurmeseCajunCambodianCanadianCape VerdeanCarpatho RusynCelticCentral AmericanCentral American IndianCherokeeCheyenneChickasawChileanChineseChippewaChoctawColombianColvilleComancheCosta RicanCreeCreekCroatianCrowCubanCypriotCzechCzechoslovakianDanishDelawareDominicanDutchDutch West IndianEastern EuropeanEcuadorianEgyptianEnglishEstonianEthiopianEuropeanFijianFilipinoFinnishFrenchFrench American IndianFrench CanadianGermanGerman RussianGhanaianGreekGuamanian/ChamorroGuatemalanGuyaneseHaitianHmongHonduranHopiHoumaHungarianIcelanderIndian (Asian)IndonesianInupiatIranianIraqiIrishIroquoisIsraeliItalianJamaicanJapaneseJordanianKenyanKiowaKoreanLaotianLatvianLebaneseLiberianLithuanianLumbeeLuxembourgerMacedonianMalaysianMalteseMarshalleseMenomineeMexicanMexican American IndianMongolianMoroccanNative HawaiianNavajoNepaleseNew ZealanderNicaraguanNigerianNorthern EuropeanNorwegianOkinawanOsageOttawaPaiutePakistaniPalestinianPanamanianParaguayanPennsylvania GermanPeruvianPimaPolishPortuguesePotawatomiPuebloPuerto RicanPuget Sound SalishRomanianRussianSalvadoranSamoanScandinavianScotch-IrishScottishSeminoleSenegaleseSerbianShoshoneSierra LeoneanSiouxSlavicSlovakSloveneSomaliSouth AfricanSouth AmericanSouth American IndianSoviet UnionSpaniardSpanishSpanish AmericanSpanish American IndianSri LankanSubsaharan AfricanSudaneseSwedishSwissSyrianTaiwaneseThaiTlingit-HaidaTohono O'OdhamTonganTrinidadian and TobagonianTsimshianTurkishU.S. Virgin IslanderUgandanUkrainianUruguayanUteVenezuelanVietnameseWelshWest IndianYakamaYaquiYugoslavianYumanYup'ikZimbabwean
Immigration
NonimmigrantsImmigrantsAfghanistanAfricaAlbaniaArgentinaArmeniaAsiaAustraliaAustriaBahamasBangladeshBarbadosBelarusBelgiumBelizeBoliviaBosnia and HerzegovinaBrazilBulgariaBurma/MyanmarCabo VerdeCambodiaCameroonCanadaCaribbeanCentral AmericaChileChinaColombiaCongoCosta RicaCroatiaCubaCzechoslovakiaDenmarkDominicaDominican RepublicEastern AfricaEastern AsiaEastern EuropeEcuadorEgyptEl SalvadorEnglandEritreaEthiopiaEuropeFijiFranceGermanyGhanaGreeceGrenadaGuatemalaGuyanaHaitiHondurasHong KongHungaryIndiaIndonesiaIranIraqIrelandIsraelItalyJamaicaJapanJordanKazakhstanKenyaKoreaKuwaitLaosLatin AmericaLatviaLebanonLiberiaLithuaniaMalaysiaMexicoMicronesiaMiddle AfricaMoldovaMoroccoNepalNetherlandsNicaraguaNigeriaNorth AmericaNorth MacedoniaNorthern AfricaNorthern EuropeNorwayOceaniaPakistanPanamaPeruPhilippinesPolandPortugalRomaniaRussiaSaudi ArabiaScotlandSenegalSerbiaSierra LeoneSingaporeSomaliaSouth AfricaSouth AmericaSouth Central AsiaSouth Eastern AsiaSouthern EuropeSpainSri LankaSt. Vincent and the GrenadinesSudanSwedenSwitzerlandSyriaTaiwanThailandTrinidad and TobagoTurkeyUgandaUkraineUruguayUzbekistanVenezuelaVietnamWest IndiesWestern AfricaWestern AsiaWestern EuropeYemenZaireZimbabweAzores
4 or more Vehicles in Household
Income
Poverty
Unemployment
Labor Participation
Family Structure
Vehicle Availability
Education Level
Disability

Alaskan Athabascan 4 or more Vehicles in Household
Exceptional

8.1%
4+ VEHICLES AVAILABLE
100.0/ 100
METRIC RATING
34th/ 347
METRIC RANK

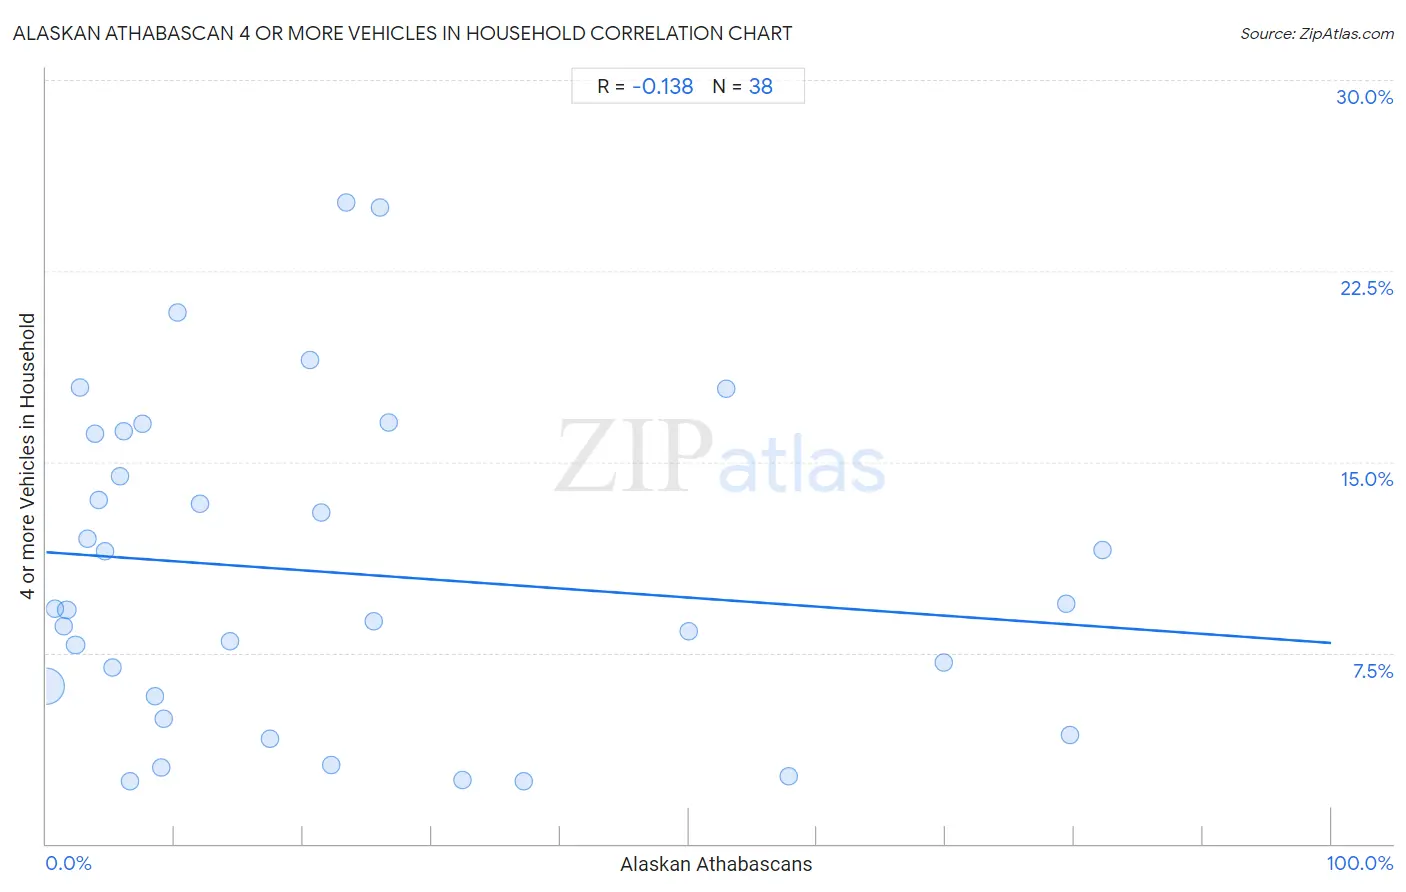
Alaskan Athabascan 4 or more Vehicles in Household Correlation Chart

The statistical analysis conducted on geographies consisting of 45,776,205 people shows a poor negative correlation between the proportion of Alaskan Athabascans and percentage of households with 4 or more vehicles available in the United States with a correlation coefficient (R) of -0.138 and weighted average of 8.1%. On average, for every 1% (one percent) increase in Alaskan Athabascans within a typical geography, there is a decrease of 0.036% in percentage of households with 4 or more vehicles available.
Alaskan Athabascan 4 or more Vehicles in Household
It is essential to understand that the correlation between the percentage of Alaskan Athabascans and percentage of households with 4 or more vehicles available does not imply a direct cause-and-effect relationship. It remains uncertain whether the presence of Alaskan Athabascans influences an upward or downward trend in the level of percentage of households with 4 or more vehicles available within an area, or if Alaskan Athabascans simply ended up residing in those areas with higher or lower levels of percentage of households with 4 or more vehicles available due to other factors.

Demographics Similar to Alaskan Athabascans by 4 or more Vehicles in Household

In terms of 4 or more vehicles in household, the demographic groups most similar to Alaskan Athabascans are Guamanian/Chamorro (8.1%, a difference of 0.20%), Yaqui (8.1%, a difference of 0.60%), Marshallese (8.1%, a difference of 0.89%), Norwegian (8.0%, a difference of 0.99%), and Scandinavian (8.0%, a difference of 1.2%).
DemographicsRating | Rank4 or more Vehicles in Household
Sri Lankans
100.0
/100
|
#27
Exceptional
8.4%
Cheyenne
100.0
/100
|
#28
Exceptional
8.3%
Immigrants from South Eastern Asia
100.0
/100
|
#29
Exceptional
8.2%
Navajo
100.0
/100
|
#30
Exceptional
8.2%
Natives/Alaskans
100.0
/100
|
#31
Exceptional
8.2%
Marshallese
100.0
/100
|
#32
Exceptional
8.1%
Yaqui
100.0
/100
|
#33
Exceptional
8.1%
Alaskan Athabascans
100.0
/100
|
#34
Exceptional
8.1%
Guamanians/Chamorros
100.0
/100
|
#35
Exceptional
8.1%
Norwegians
100.0
/100
|
#36
Exceptional
8.0%
Scandinavians
100.0
/100
|
#37
Exceptional
8.0%
Sioux
100.0
/100
|
#38
Exceptional
8.0%
Spanish Americans
100.0
/100
|
#39
Exceptional
8.0%
Spanish
100.0
/100
|
#40
Exceptional
7.9%
Pima
100.0
/100
|
#41
Exceptional
7.9%

Alaskan Athabascan 4 or more Vehicles in Household Correlation Summary

MeasurementAlaskan Athabascan Data4 or more Vehicles in Household Data
Minimum0.025%2.4%
Maximum82.2%25.2%
Range82.2%22.8%
Mean22.2%10.7%
Median11.1%9.2%
Interquartile 25% (IQ1)4.6%5.8%
Interquartile 75% (IQ3)26.7%16.1%
Interquartile Range (IQR)22.0%10.3%
Standard Deviation (Sample)24.3%6.3%
Standard Deviation (Population)24.0%6.2%

Correlation Details

Alaskan Athabascan PercentileSample Size4 or more Vehicles in Household
[
0.0%
-
0.5%
]
0.025%
44,534,7656.2%
[
0.5%
-
1.0%
]
0.67%
224,4559.2%
[
1.0%
-
1.5%
]
1.34%
110,1688.5%
[
1.5%
-
2.0%
]
1.59%
510,1199.2%
[
2.0%
-
2.5%
]
2.29%
150,8147.8%
[
2.5%
-
3.0%
]
2.62%
12,15417.9%
[
3.0%
-
3.5%
]
3.19%
79,97812.0%
[
3.5%
-
4.0%
]
3.81%
6,56816.1%
[
4.0%
-
4.5%
]
4.08%
17,85213.5%
[
4.5%
-
5.0%
]
4.61%
2,06111.5%
[
5.0%
-
5.5%
]
5.20%
28,3436.9%
[
5.5%
-
6.0%
]
5.75%
20,16014.4%
[
6.0%
-
6.5%
]
6.07%
1,17016.2%
[
6.5%
-
7.0%
]
6.56%
33,2112.4%
[
7.5%
-
8.0%
]
7.53%
27916.5%
[
8.0%
-
8.5%
]
8.49%
5,3215.8%
[
8.5%
-
9.0%
]
8.96%
19,5293.0%
[
9.0%
-
9.5%
]
9.13%
9644.9%
[
10.0%
-
10.5%
]
10.26%
6,54220.9%
[
11.5%
-
12.0%
]
11.97%
23413.3%
[
14.0%
-
14.5%
]
14.29%
1828.0%
[
17.0%
-
17.5%
]
17.38%
1,9274.1%
[
20.5%
-
21.0%
]
20.57%
1,16719.0%
[
21.0%
-
21.5%
]
21.39%
1,05213.0%
[
22.0%
-
22.5%
]
22.16%
3793.1%
[
23.0%
-
23.5%
]
23.37%
52225.2%
[
25.0%
-
25.5%
]
25.49%
7618.7%
[
25.5%
-
26.0%
]
25.93%
5425.0%
[
26.5%
-
27.0%
]
26.65%
43916.6%
[
32.0%
-
32.5%
]
32.34%
1,7192.5%
[
37.0%
-
37.5%
]
37.20%
5082.5%
[
50.0%
-
50.5%
]
50.00%
4308.3%
[
52.5%
-
53.0%
]
52.89%
32917.9%
[
57.5%
-
58.0%
]
57.74%
1,2542.6%
[
69.5%
-
70.0%
]
69.85%
2727.1%
[
79.0%
-
79.5%
]
79.37%
2529.4%
[
79.5%
-
80.0%
]
79.65%
2264.3%
[
82.0%
-
82.5%
]
82.22%
4511.5%