Alaskan Athabascan vs Lebanese Wage/Income Gap
COMPARE
Alaskan Athabascan
Lebanese
Wage/Income Gap
Wage/Income Gap Comparison
Alaskan Athabascans
Lebanese
25.8%
WAGE/INCOME GAP
50.0/ 100
METRIC RATING
174th/ 347
METRIC RANK
27.9%
WAGE/INCOME GAP
0.7/ 100
METRIC RATING
276th/ 347
METRIC RANK
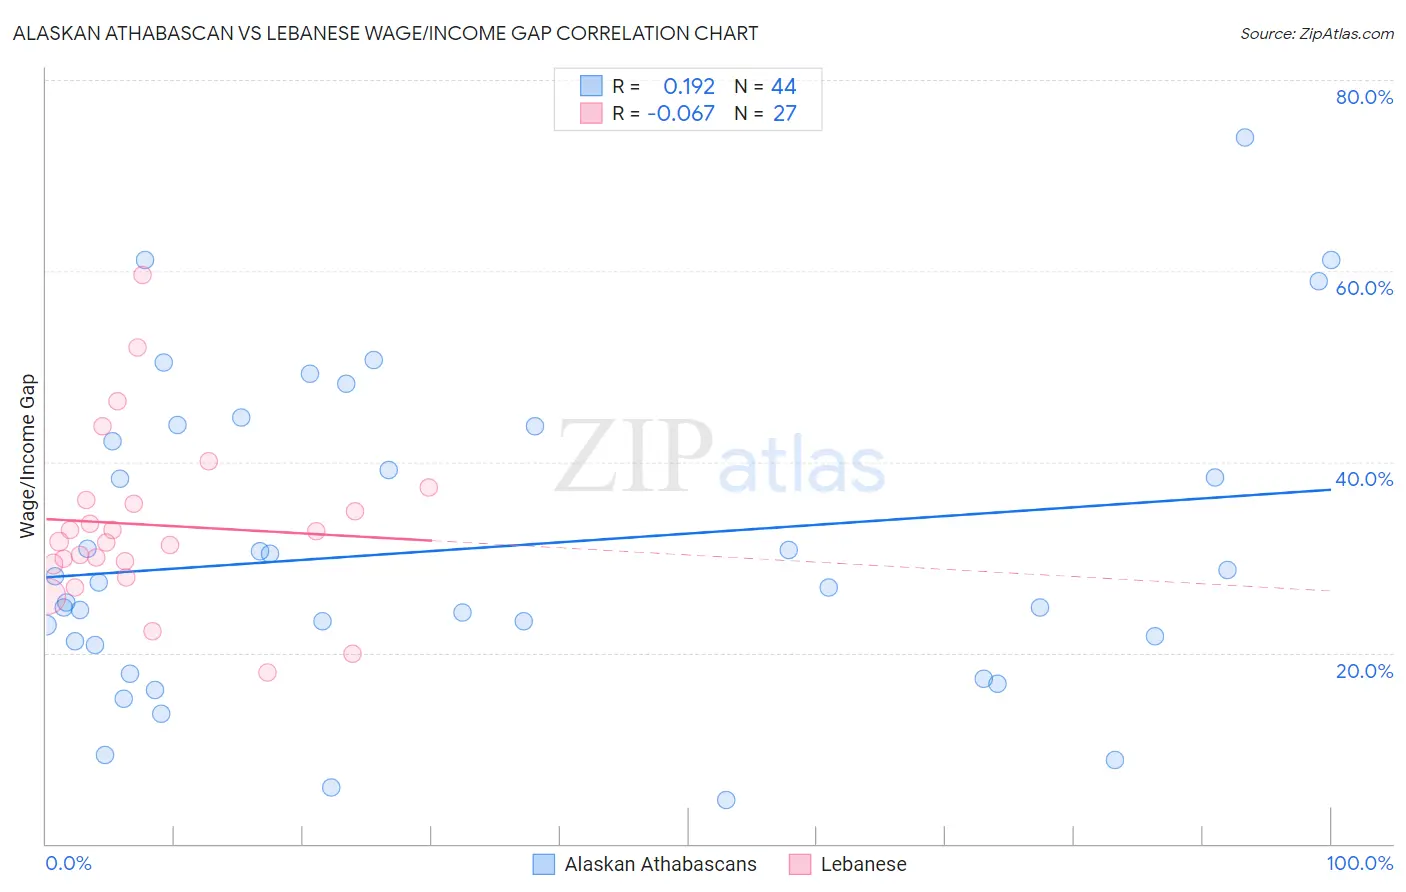
Alaskan Athabascan vs Lebanese Wage/Income Gap Correlation Chart
The statistical analysis conducted on geographies consisting of 45,785,109 people shows a poor positive correlation between the proportion of Alaskan Athabascans and wage/income gap percentage in the United States with a correlation coefficient (R) of 0.192 and weighted average of 25.8%. Similarly, the statistical analysis conducted on geographies consisting of 401,331,203 people shows a slight negative correlation between the proportion of Lebanese and wage/income gap percentage in the United States with a correlation coefficient (R) of -0.067 and weighted average of 27.9%, a difference of 8.2%.
Wage/Income Gap Correlation Summary
| Measurement | Alaskan Athabascan | Lebanese |
| Minimum | 4.5% | 18.0% |
| Maximum | 74.0% | 59.6% |
| Range | 69.5% | 41.7% |
| Mean | 30.9% | 33.4% |
| Median | 27.1% | 31.7% |
| Interquartile 25% (IQ1) | 21.0% | 29.3% |
| Interquartile 75% (IQ3) | 42.9% | 36.0% |
| Interquartile Range (IQR) | 21.9% | 6.7% |
| Standard Deviation (Sample) | 16.0% | 9.1% |
| Standard Deviation (Population) | 15.8% | 8.9% |
Similar Demographics by Wage/Income Gap
Demographics Similar to Alaskan Athabascans by Wage/Income Gap
In terms of wage/income gap, the demographic groups most similar to Alaskan Athabascans are Immigrants from Belarus (25.7%, a difference of 0.19%), Sri Lankan (25.8%, a difference of 0.20%), Immigrants from Chile (25.7%, a difference of 0.21%), Paraguayan (25.8%, a difference of 0.21%), and Cambodian (25.8%, a difference of 0.32%).
| Demographics | Rating | Rank | Wage/Income Gap |
| Paiute | 62.9 /100 | #167 | Good 25.5% |
| Seminole | 62.6 /100 | #168 | Good 25.6% |
| Peruvians | 60.1 /100 | #169 | Good 25.6% |
| Immigrants | Oceania | 57.5 /100 | #170 | Average 25.6% |
| Immigrants | Greece | 56.6 /100 | #171 | Average 25.7% |
| Immigrants | Chile | 53.2 /100 | #172 | Average 25.7% |
| Immigrants | Belarus | 52.9 /100 | #173 | Average 25.7% |
| Alaskan Athabascans | 50.0 /100 | #174 | Average 25.8% |
| Sri Lankans | 47.0 /100 | #175 | Average 25.8% |
| Paraguayans | 46.7 /100 | #176 | Average 25.8% |
| Cambodians | 45.1 /100 | #177 | Average 25.8% |
| Chinese | 42.0 /100 | #178 | Average 25.9% |
| Samoans | 38.6 /100 | #179 | Fair 26.0% |
| Guamanians/Chamorros | 38.0 /100 | #180 | Fair 26.0% |
| Immigrants | Bolivia | 36.4 /100 | #181 | Fair 26.0% |
Demographics Similar to Lebanese by Wage/Income Gap
In terms of wage/income gap, the demographic groups most similar to Lebanese are Latvian (27.9%, a difference of 0.0%), Immigrants from Japan (27.9%, a difference of 0.030%), Immigrants from England (27.9%, a difference of 0.080%), American (27.8%, a difference of 0.11%), and Bulgarian (27.8%, a difference of 0.15%).
| Demographics | Rating | Rank | Wage/Income Gap |
| Potawatomi | 0.9 /100 | #269 | Tragic 27.7% |
| Immigrants | Western Europe | 0.9 /100 | #270 | Tragic 27.8% |
| Ute | 0.8 /100 | #271 | Tragic 27.8% |
| Immigrants | Korea | 0.8 /100 | #272 | Tragic 27.8% |
| Bulgarians | 0.7 /100 | #273 | Tragic 27.8% |
| Americans | 0.7 /100 | #274 | Tragic 27.8% |
| Immigrants | Japan | 0.7 /100 | #275 | Tragic 27.9% |
| Lebanese | 0.7 /100 | #276 | Tragic 27.9% |
| Latvians | 0.7 /100 | #277 | Tragic 27.9% |
| Immigrants | England | 0.6 /100 | #278 | Tragic 27.9% |
| Romanians | 0.5 /100 | #279 | Tragic 28.0% |
| Russians | 0.5 /100 | #280 | Tragic 28.0% |
| Burmese | 0.5 /100 | #281 | Tragic 28.0% |
| South Africans | 0.5 /100 | #282 | Tragic 28.0% |
| French Canadians | 0.4 /100 | #283 | Tragic 28.1% |