Alaskan Athabascan 1 or more Vehicles in Household
COMPARE
Alaskan Athabascan
Select to Compare
1 or more Vehicles in Household
Alaskan Athabascan 1 or more Vehicles in Household
86.0%
1+ VEHICLES AVAILABLE
0.0/ 100
METRIC RATING
294th/ 347
METRIC RANK
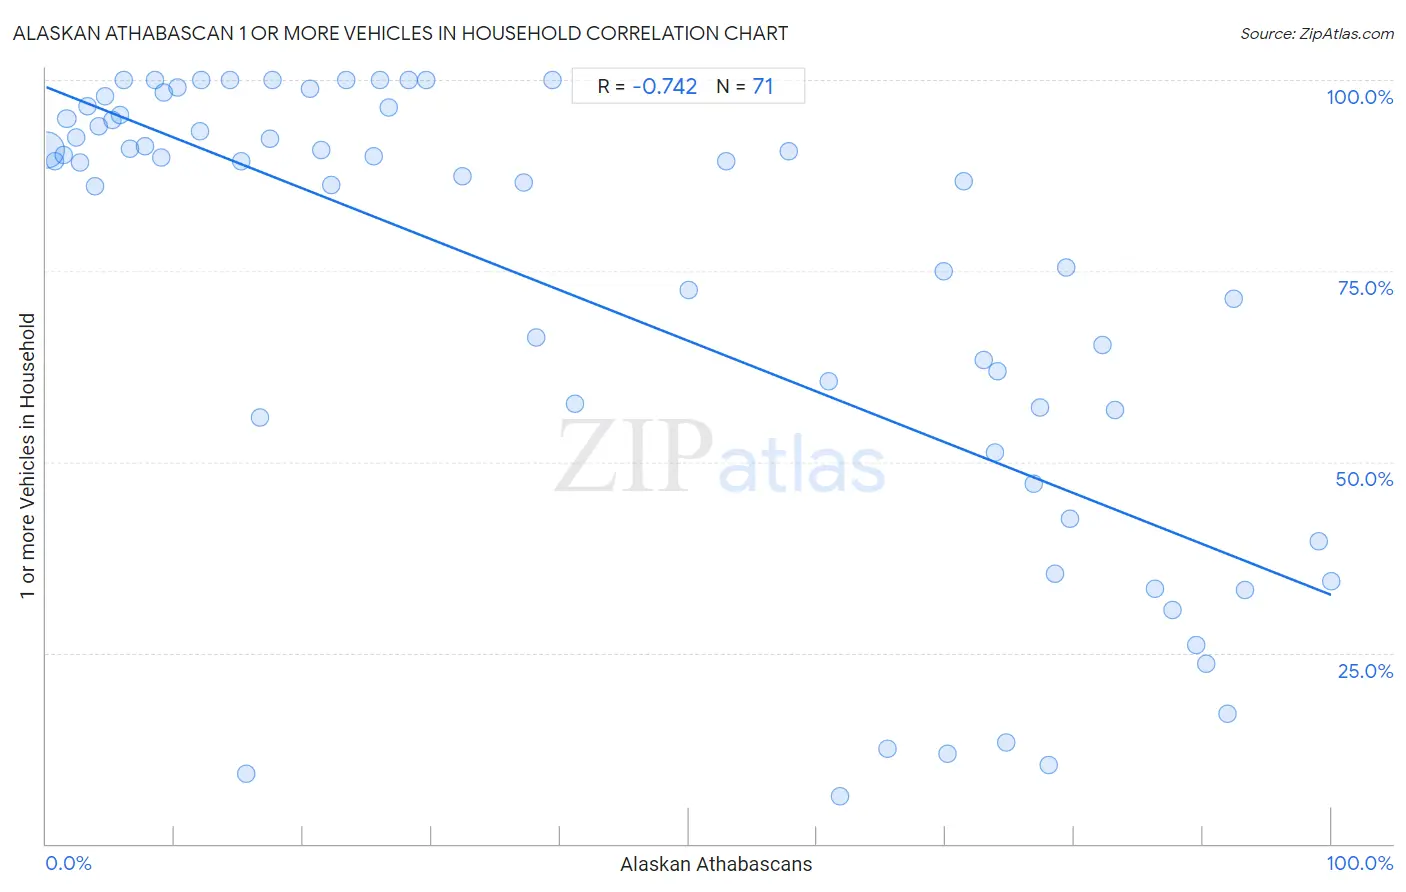
Alaskan Athabascan 1 or more Vehicles in Household Correlation Chart
The statistical analysis conducted on geographies consisting of 45,812,389 people shows a strong negative correlation between the proportion of Alaskan Athabascans and percentage of households with 1 or more vehicles available in the United States with a correlation coefficient (R) of -0.742 and weighted average of 86.0%. On average, for every 1% (one percent) increase in Alaskan Athabascans within a typical geography, there is a decrease of 0.66% in percentage of households with 1 or more vehicles available.
It is essential to understand that the correlation between the percentage of Alaskan Athabascans and percentage of households with 1 or more vehicles available does not imply a direct cause-and-effect relationship. It remains uncertain whether the presence of Alaskan Athabascans influences an upward or downward trend in the level of percentage of households with 1 or more vehicles available within an area, or if Alaskan Athabascans simply ended up residing in those areas with higher or lower levels of percentage of households with 1 or more vehicles available due to other factors.
Demographics Similar to Alaskan Athabascans by 1 or more Vehicles in Household
In terms of 1 or more vehicles in household, the demographic groups most similar to Alaskan Athabascans are Indian (Asian) (86.0%, a difference of 0.070%), Okinawan (86.1%, a difference of 0.13%), Immigrants from Jamaica (85.8%, a difference of 0.17%), Immigrants from Spain (85.8%, a difference of 0.20%), and Paraguayan (85.7%, a difference of 0.29%).
| Demographics | Rating | Rank | 1 or more Vehicles in Household |
| Immigrants from Malaysia | 0.0 /100 | #287 | Tragic 86.5% |
| Hopi | 0.0 /100 | #288 | Tragic 86.4% |
| Immigrants from Ireland | 0.0 /100 | #289 | Tragic 86.4% |
| Immigrants from Australia | 0.0 /100 | #290 | Tragic 86.4% |
| Pima | 0.0 /100 | #291 | Tragic 86.3% |
| Okinawans | 0.0 /100 | #292 | Tragic 86.1% |
| Indians (Asian) | 0.0 /100 | #293 | Tragic 86.0% |
| Alaskan Athabascans | 0.0 /100 | #294 | Tragic 86.0% |
| Immigrants from Jamaica | 0.0 /100 | #295 | Tragic 85.8% |
| Immigrants from Spain | 0.0 /100 | #296 | Tragic 85.8% |
| Paraguayans | 0.0 /100 | #297 | Tragic 85.7% |
| Belizeans | 0.0 /100 | #298 | Tragic 85.7% |
| Yuman | 0.0 /100 | #299 | Tragic 85.5% |
| Immigrants from Russia | 0.0 /100 | #300 | Tragic 85.4% |
| Immigrants from Panama | 0.0 /100 | #301 | Tragic 85.4% |
Alaskan Athabascan 1 or more Vehicles in Household Correlation Summary
| Measurement | Alaskan Athabascan Data | 1 or more Vehicles in Household Data |
| Minimum | 0.025% | 6.2% |
| Maximum | 100.0% | 100.0% |
| Range | 100.0% | 93.8% |
| Mean | 41.5% | 71.5% |
| Median | 29.6% | 87.4% |
| Interquartile 25% (IQ1) | 9.1% | 51.2% |
| Interquartile 75% (IQ3) | 74.7% | 94.9% |
| Interquartile Range (IQR) | 65.6% | 43.7% |
| Standard Deviation (Sample) | 33.3% | 29.8% |
| Standard Deviation (Population) | 33.0% | 29.6% |
Correlation Details
| Alaskan Athabascan Percentile | Sample Size | 1 or more Vehicles in Household |
[ 0.0% - 0.5% ] 0.025% | 44,547,940 | 90.9% |
[ 0.5% - 1.0% ] 0.67% | 227,223 | 89.3% |
[ 1.0% - 1.5% ] 1.34% | 115,464 | 90.2% |
[ 1.5% - 2.0% ] 1.59% | 511,683 | 94.9% |
[ 2.0% - 2.5% ] 2.29% | 152,758 | 92.5% |
[ 2.5% - 3.0% ] 2.63% | 14,176 | 89.2% |
[ 3.0% - 3.5% ] 3.19% | 79,978 | 96.5% |
[ 3.5% - 4.0% ] 3.81% | 6,568 | 86.1% |
[ 4.0% - 4.5% ] 4.09% | 18,102 | 94.0% |
[ 4.5% - 5.0% ] 4.61% | 2,061 | 97.9% |
[ 5.0% - 5.5% ] 5.20% | 28,343 | 94.8% |
[ 5.5% - 6.0% ] 5.76% | 20,604 | 95.4% |
[ 6.0% - 6.5% ] 6.07% | 1,170 | 100.0% |
[ 6.5% - 7.0% ] 6.56% | 33,211 | 91.0% |
[ 7.5% - 8.0% ] 7.65% | 405 | 91.3% |
[ 8.0% - 8.5% ] 8.49% | 5,499 | 100.0% |
[ 8.5% - 9.0% ] 8.96% | 19,529 | 89.9% |
[ 9.0% - 9.5% ] 9.13% | 964 | 98.3% |
[ 10.0% - 10.5% ] 10.26% | 6,542 | 99.0% |
[ 11.5% - 12.0% ] 11.97% | 234 | 93.3% |
[ 12.0% - 12.5% ] 12.01% | 283 | 100.0% |
[ 14.0% - 14.5% ] 14.29% | 182 | 100.0% |
[ 15.0% - 15.5% ] 15.22% | 92 | 89.3% |
[ 15.5% - 16.0% ] 15.52% | 116 | 9.1% |
[ 16.5% - 17.0% ] 16.60% | 235 | 55.8% |
[ 17.0% - 17.5% ] 17.38% | 1,927 | 92.4% |
[ 17.5% - 18.0% ] 17.65% | 34 | 100.0% |
[ 20.5% - 21.0% ] 20.57% | 1,167 | 98.8% |
[ 21.0% - 21.5% ] 21.39% | 1,052 | 90.9% |
[ 22.0% - 22.5% ] 22.16% | 388 | 86.2% |
[ 23.0% - 23.5% ] 23.37% | 522 | 100.0% |
[ 25.0% - 25.5% ] 25.49% | 761 | 90.0% |
[ 25.5% - 26.0% ] 25.93% | 54 | 100.0% |
[ 26.5% - 27.0% ] 26.65% | 439 | 96.3% |
[ 28.0% - 28.5% ] 28.21% | 78 | 100.0% |
[ 29.5% - 30.0% ] 29.58% | 71 | 100.0% |
[ 32.0% - 32.5% ] 32.34% | 1,719 | 87.4% |
[ 37.0% - 37.5% ] 37.20% | 508 | 86.6% |
[ 38.0% - 38.5% ] 38.10% | 525 | 66.3% |
[ 39.0% - 39.5% ] 39.44% | 71 | 100.0% |
[ 41.0% - 41.5% ] 41.18% | 68 | 57.7% |
[ 50.0% - 50.5% ] 50.00% | 470 | 72.4% |
[ 52.5% - 53.0% ] 52.89% | 329 | 89.3% |
[ 57.5% - 58.0% ] 57.74% | 1,254 | 90.6% |
[ 60.5% - 61.0% ] 60.87% | 69 | 60.6% |
[ 61.5% - 62.0% ] 61.76% | 68 | 6.2% |
[ 65.0% - 65.5% ] 65.45% | 220 | 12.5% |
[ 69.5% - 70.0% ] 69.85% | 272 | 75.0% |
[ 70.0% - 70.5% ] 70.15% | 650 | 11.8% |
[ 71.0% - 71.5% ] 71.43% | 28 | 86.7% |
[ 72.5% - 73.0% ] 72.99% | 274 | 63.3% |
[ 73.5% - 74.0% ] 73.81% | 252 | 51.2% |
[ 74.0% - 74.5% ] 74.07% | 270 | 61.9% |
[ 74.5% - 75.0% ] 74.73% | 91 | 13.3% |
[ 76.5% - 77.0% ] 76.80% | 388 | 47.1% |
[ 77.0% - 77.5% ] 77.31% | 952 | 57.2% |
[ 77.5% - 78.0% ] 77.98% | 218 | 10.3% |
[ 78.0% - 78.5% ] 78.46% | 130 | 35.3% |
[ 79.0% - 79.5% ] 79.37% | 252 | 75.5% |
[ 79.5% - 80.0% ] 79.65% | 226 | 42.6% |
[ 82.0% - 82.5% ] 82.22% | 45 | 65.4% |
[ 83.0% - 83.5% ] 83.18% | 428 | 56.8% |
[ 86.0% - 86.5% ] 86.26% | 364 | 33.3% |
[ 87.5% - 88.0% ] 87.62% | 420 | 30.6% |
[ 89.5% - 90.0% ] 89.53% | 554 | 26.0% |
[ 90.0% - 90.5% ] 90.24% | 82 | 23.5% |
[ 91.5% - 92.0% ] 91.95% | 174 | 17.1% |
[ 92.0% - 92.5% ] 92.37% | 524 | 71.4% |
[ 93.0% - 93.5% ] 93.28% | 238 | 33.3% |
[ 99.0% - 99.5% ] 99.00% | 201 | 39.6% |
[ 99.5% - 100.0% ] 100.00% | 200 | 34.3% |