Alaskan Athabascan Disability Age 5 to 17

COMPARE

Alaskan Athabascan
Race
Ancestry
AfghanAfricanAlaska NativeAlaskan AthabascanAlbanianAleutAlsatianAmericanApacheArabArapahoArgentineanArmenianAssyrian/Chaldean/SyriacAustralianAustrianBahamianBangladeshiBarbadianBasqueBelgianBelizeanBermudanBhutaneseBlackfeetBolivianBrazilianBritishBritish West IndianBulgarianBurmeseCajunCambodianCanadianCape VerdeanCarpatho RusynCelticCentral AmericanCentral American IndianCherokeeCheyenneChickasawChileanChineseChippewaChoctawColombianColvilleComancheCosta RicanCreeCreekCroatianCrowCubanCypriotCzechCzechoslovakianDanishDelawareDominicanDutchDutch West IndianEastern EuropeanEcuadorianEgyptianEnglishEstonianEthiopianEuropeanFijianFilipinoFinnishFrenchFrench American IndianFrench CanadianGermanGerman RussianGhanaianGreekGuamanian/ChamorroGuatemalanGuyaneseHaitianHmongHonduranHopiHoumaHungarianIcelanderIndian (Asian)IndonesianInupiatIranianIraqiIrishIroquoisIsraeliItalianJamaicanJapaneseJordanianKenyanKiowaKoreanLaotianLatvianLebaneseLiberianLithuanianLumbeeLuxembourgerMacedonianMalaysianMalteseMarshalleseMenomineeMexicanMexican American IndianMongolianMoroccanNative HawaiianNavajoNepaleseNew ZealanderNicaraguanNigerianNorthern EuropeanNorwegianOkinawanOsageOttawaPaiutePakistaniPalestinianPanamanianParaguayanPennsylvania GermanPeruvianPimaPolishPortuguesePotawatomiPuebloPuerto RicanPuget Sound SalishRomanianRussianSalvadoranSamoanScandinavianScotch-IrishScottishSeminoleSenegaleseSerbianShoshoneSierra LeoneanSiouxSlavicSlovakSloveneSomaliSouth AfricanSouth AmericanSouth American IndianSoviet UnionSpaniardSpanishSpanish AmericanSpanish American IndianSri LankanSubsaharan AfricanSudaneseSwedishSwissSyrianTaiwaneseThaiTlingit-HaidaTohono O'OdhamTonganTrinidadian and TobagonianTsimshianTurkishU.S. Virgin IslanderUgandanUkrainianUruguayanUteVenezuelanVietnameseWelshWest IndianYakamaYaquiYugoslavianYumanYup'ikZimbabwean
Immigration
NonimmigrantsImmigrantsAfghanistanAfricaAlbaniaArgentinaArmeniaAsiaAustraliaAustriaBahamasBangladeshBarbadosBelarusBelgiumBelizeBoliviaBosnia and HerzegovinaBrazilBulgariaBurma/MyanmarCabo VerdeCambodiaCameroonCanadaCaribbeanCentral AmericaChileChinaColombiaCongoCosta RicaCroatiaCubaCzechoslovakiaDenmarkDominicaDominican RepublicEastern AfricaEastern AsiaEastern EuropeEcuadorEgyptEl SalvadorEnglandEritreaEthiopiaEuropeFijiFranceGermanyGhanaGreeceGrenadaGuatemalaGuyanaHaitiHondurasHong KongHungaryIndiaIndonesiaIranIraqIrelandIsraelItalyJamaicaJapanJordanKazakhstanKenyaKoreaKuwaitLaosLatin AmericaLatviaLebanonLiberiaLithuaniaMalaysiaMexicoMicronesiaMiddle AfricaMoldovaMoroccoNepalNetherlandsNicaraguaNigeriaNorth AmericaNorth MacedoniaNorthern AfricaNorthern EuropeNorwayOceaniaPakistanPanamaPeruPhilippinesPolandPortugalRomaniaRussiaSaudi ArabiaScotlandSenegalSerbiaSierra LeoneSingaporeSomaliaSouth AfricaSouth AmericaSouth Central AsiaSouth Eastern AsiaSouthern EuropeSpainSri LankaSt. Vincent and the GrenadinesSudanSwedenSwitzerlandSyriaTaiwanThailandTrinidad and TobagoTurkeyUgandaUkraineUruguayUzbekistanVenezuelaVietnamWest IndiesWestern AfricaWestern AsiaWestern EuropeYemenZaireZimbabweAzores
Select to Compare
Race
Ancestry
AfghanAfricanAlaska NativeAlbanianAleutAlsatianAmericanApacheArabArapahoArgentineanArmenianAssyrian/Chaldean/SyriacAustralianAustrianBahamianBangladeshiBarbadianBasqueBelgianBelizeanBermudanBhutaneseBlackfeetBolivianBrazilianBritishBritish West IndianBulgarianBurmeseCajunCambodianCanadianCape VerdeanCarpatho RusynCelticCentral AmericanCentral American IndianCherokeeCheyenneChickasawChileanChineseChippewaChoctawColombianColvilleComancheCosta RicanCreeCreekCroatianCrowCubanCypriotCzechCzechoslovakianDanishDelawareDominicanDutchDutch West IndianEastern EuropeanEcuadorianEgyptianEnglishEstonianEthiopianEuropeanFijianFilipinoFinnishFrenchFrench American IndianFrench CanadianGermanGerman RussianGhanaianGreekGuamanian/ChamorroGuatemalanGuyaneseHaitianHmongHonduranHopiHoumaHungarianIcelanderIndian (Asian)IndonesianInupiatIranianIraqiIrishIroquoisIsraeliItalianJamaicanJapaneseJordanianKenyanKiowaKoreanLaotianLatvianLebaneseLiberianLithuanianLumbeeLuxembourgerMacedonianMalaysianMalteseMarshalleseMenomineeMexicanMexican American IndianMongolianMoroccanNative HawaiianNavajoNepaleseNew ZealanderNicaraguanNigerianNorthern EuropeanNorwegianOkinawanOsageOttawaPaiutePakistaniPalestinianPanamanianParaguayanPennsylvania GermanPeruvianPimaPolishPortuguesePotawatomiPuebloPuerto RicanPuget Sound SalishRomanianRussianSalvadoranSamoanScandinavianScotch-IrishScottishSeminoleSenegaleseSerbianShoshoneSierra LeoneanSiouxSlavicSlovakSloveneSomaliSouth AfricanSouth AmericanSouth American IndianSoviet UnionSpaniardSpanishSpanish AmericanSpanish American IndianSri LankanSubsaharan AfricanSudaneseSwedishSwissSyrianTaiwaneseThaiTlingit-HaidaTohono O'OdhamTonganTrinidadian and TobagonianTsimshianTurkishU.S. Virgin IslanderUgandanUkrainianUruguayanUteVenezuelanVietnameseWelshWest IndianYakamaYaquiYugoslavianYumanYup'ikZimbabwean
Immigration
NonimmigrantsImmigrantsAfghanistanAfricaAlbaniaArgentinaArmeniaAsiaAustraliaAustriaBahamasBangladeshBarbadosBelarusBelgiumBelizeBoliviaBosnia and HerzegovinaBrazilBulgariaBurma/MyanmarCabo VerdeCambodiaCameroonCanadaCaribbeanCentral AmericaChileChinaColombiaCongoCosta RicaCroatiaCubaCzechoslovakiaDenmarkDominicaDominican RepublicEastern AfricaEastern AsiaEastern EuropeEcuadorEgyptEl SalvadorEnglandEritreaEthiopiaEuropeFijiFranceGermanyGhanaGreeceGrenadaGuatemalaGuyanaHaitiHondurasHong KongHungaryIndiaIndonesiaIranIraqIrelandIsraelItalyJamaicaJapanJordanKazakhstanKenyaKoreaKuwaitLaosLatin AmericaLatviaLebanonLiberiaLithuaniaMalaysiaMexicoMicronesiaMiddle AfricaMoldovaMoroccoNepalNetherlandsNicaraguaNigeriaNorth AmericaNorth MacedoniaNorthern AfricaNorthern EuropeNorwayOceaniaPakistanPanamaPeruPhilippinesPolandPortugalRomaniaRussiaSaudi ArabiaScotlandSenegalSerbiaSierra LeoneSingaporeSomaliaSouth AfricaSouth AmericaSouth Central AsiaSouth Eastern AsiaSouthern EuropeSpainSri LankaSt. Vincent and the GrenadinesSudanSwedenSwitzerlandSyriaTaiwanThailandTrinidad and TobagoTurkeyUgandaUkraineUruguayUzbekistanVenezuelaVietnamWest IndiesWestern AfricaWestern AsiaWestern EuropeYemenZaireZimbabweAzores
Disability Age 5 to 17
Income
Poverty
Unemployment
Labor Participation
Family Structure
Vehicle Availability
Education Level
Disability

Alaskan Athabascan Disability Age 5 to 17
Tragic

6.3%
DISABILITY | AGE 5 TO 17
0.0/ 100
METRIC RATING
310th/ 347
METRIC RANK

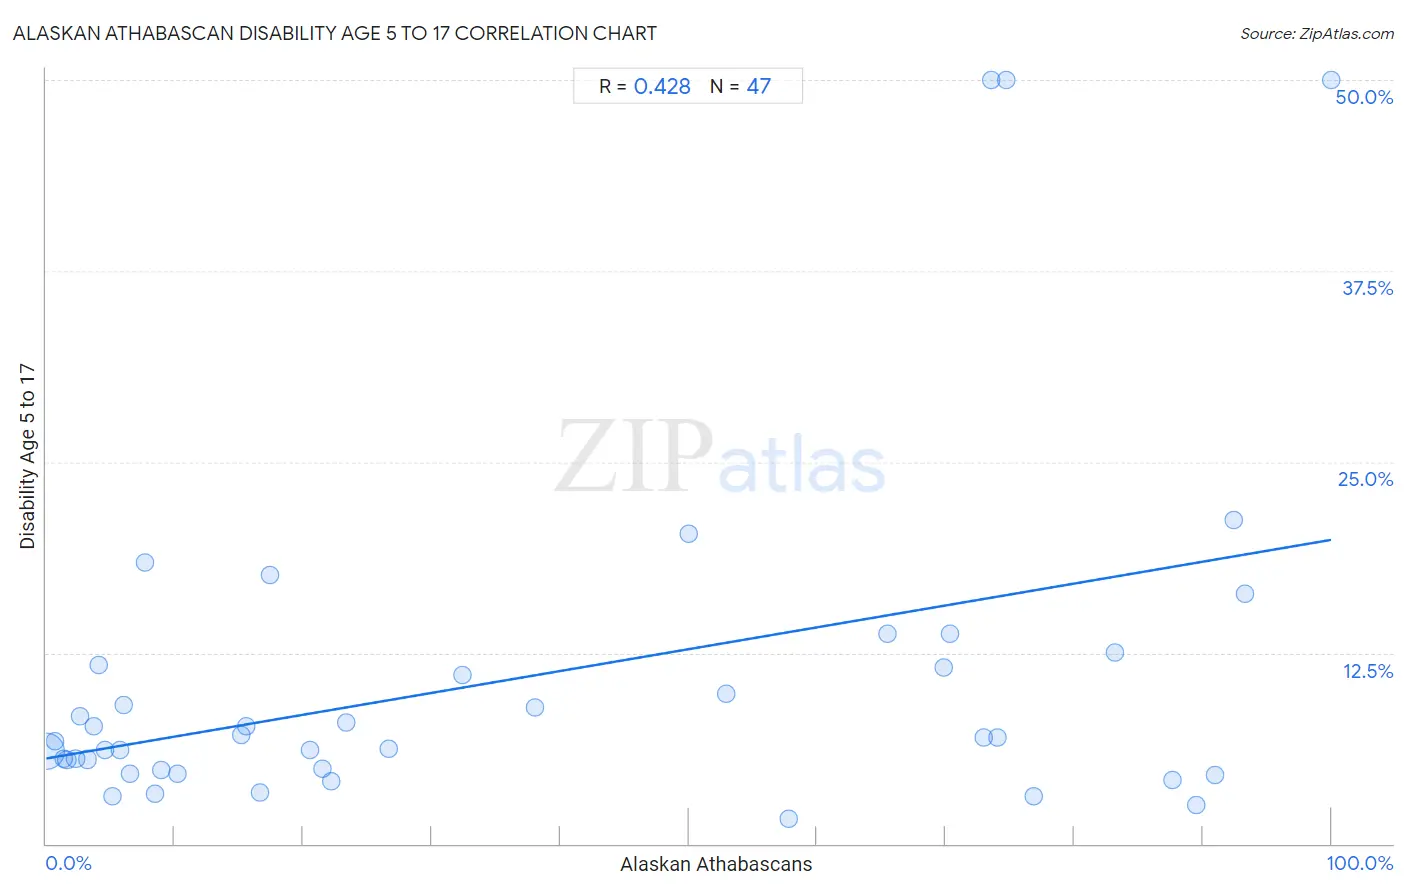
Alaskan Athabascan Disability Age 5 to 17 Correlation Chart

The statistical analysis conducted on geographies consisting of 45,771,406 people shows a moderate positive correlation between the proportion of Alaskan Athabascans and percentage of population with a disability between the ages 5 and 17 in the United States with a correlation coefficient (R) of 0.428 and weighted average of 6.3%. On average, for every 1% (one percent) increase in Alaskan Athabascans within a typical geography, there is an increase of 0.14% in percentage of population with a disability between the ages 5 and 17.
Alaskan Athabascan Disability Age 5 to 17
It is essential to understand that the correlation between the percentage of Alaskan Athabascans and percentage of population with a disability between the ages 5 and 17 does not imply a direct cause-and-effect relationship. It remains uncertain whether the presence of Alaskan Athabascans influences an upward or downward trend in the level of percentage of population with a disability between the ages 5 and 17 within an area, or if Alaskan Athabascans simply ended up residing in those areas with higher or lower levels of percentage of population with a disability between the ages 5 and 17 due to other factors.

Demographics Similar to Alaskan Athabascans by Disability Age 5 to 17

In terms of disability age 5 to 17, the demographic groups most similar to Alaskan Athabascans are Immigrants from Dominica (6.3%, a difference of 0.040%), Hmong (6.3%, a difference of 0.13%), Scotch-Irish (6.3%, a difference of 0.16%), Bermudan (6.4%, a difference of 0.16%), and Bahamian (6.3%, a difference of 0.39%).
DemographicsRating | RankDisability Age 5 to 17
Yakama
0.0
/100
|
#303
Tragic
6.3%
Senegalese
0.0
/100
|
#304
Tragic
6.3%
Natives/Alaskans
0.0
/100
|
#305
Tragic
6.3%
Nonimmigrants
0.0
/100
|
#306
Tragic
6.3%
Bahamians
0.0
/100
|
#307
Tragic
6.3%
Scotch-Irish
0.0
/100
|
#308
Tragic
6.3%
Hmong
0.0
/100
|
#309
Tragic
6.3%
Alaskan Athabascans
0.0
/100
|
#310
Tragic
6.3%
Immigrants from Dominica
0.0
/100
|
#311
Tragic
6.3%
Bermudans
0.0
/100
|
#312
Tragic
6.4%
Apache
0.0
/100
|
#313
Tragic
6.4%
French
0.0
/100
|
#314
Tragic
6.4%
Immigrants from Portugal
0.0
/100
|
#315
Tragic
6.4%
Immigrants from Dominican Republic
0.0
/100
|
#316
Tragic
6.4%
Kiowa
0.0
/100
|
#317
Tragic
6.4%

Alaskan Athabascan Disability Age 5 to 17 Correlation Summary

MeasurementAlaskan Athabascan DataDisability Age 5 to 17 Data
Minimum0.025%1.7%
Maximum100.0%50.0%
Range100.0%48.3%
Mean36.3%10.8%
Median21.5%7.0%
Interquartile 25% (IQ1)5.8%4.8%
Interquartile 75% (IQ3)73.0%11.7%
Interquartile Range (IQR)67.2%6.9%
Standard Deviation (Sample)34.0%11.4%
Standard Deviation (Population)33.7%11.2%

Correlation Details

Alaskan Athabascan PercentileSample SizeDisability Age 5 to 17
[
0.0%
-
0.5%
]
0.025%
44,537,9036.0%
[
0.5%
-
1.0%
]
0.67%
222,8746.7%
[
1.0%
-
1.5%
]
1.34%
111,6385.6%
[
1.5%
-
2.0%
]
1.59%
509,0745.5%
[
2.0%
-
2.5%
]
2.29%
145,8715.6%
[
2.5%
-
3.0%
]
2.63%
13,4048.3%
[
3.0%
-
3.5%
]
3.19%
79,5515.5%
[
3.5%
-
4.0%
]
3.72%
3,5797.7%
[
4.0%
-
4.5%
]
4.08%
16,80111.7%
[
4.5%
-
5.0%
]
4.61%
2,0616.2%
[
5.0%
-
5.5%
]
5.20%
28,3433.1%
[
5.5%
-
6.0%
]
5.75%
20,1606.1%
[
6.0%
-
6.5%
]
6.07%
1,1709.0%
[
6.5%
-
7.0%
]
6.56%
33,2114.6%
[
7.5%
-
8.0%
]
7.65%
40518.4%
[
8.0%
-
8.5%
]
8.49%
5,4993.3%
[
8.5%
-
9.0%
]
8.96%
19,5294.8%
[
10.0%
-
10.5%
]
10.26%
6,5424.6%
[
15.0%
-
15.5%
]
15.22%
927.1%
[
15.5%
-
16.0%
]
15.52%
1167.7%
[
16.5%
-
17.0%
]
16.60%
2353.4%
[
17.0%
-
17.5%
]
17.38%
1,35217.6%
[
20.5%
-
21.0%
]
20.57%
1,1676.1%
[
21.0%
-
21.5%
]
21.47%
8434.9%
[
22.0%
-
22.5%
]
22.16%
3794.1%
[
23.0%
-
23.5%
]
23.37%
5228.0%
[
26.5%
-
27.0%
]
26.65%
4396.2%
[
32.0%
-
32.5%
]
32.34%
1,71911.0%
[
38.0%
-
38.5%
]
38.05%
4528.9%
[
50.0%
-
50.5%
]
50.00%
43020.3%
[
52.5%
-
53.0%
]
52.89%
3299.8%
[
57.5%
-
58.0%
]
57.74%
1,2541.7%
[
65.0%
-
65.5%
]
65.45%
22013.7%
[
69.5%
-
70.0%
]
69.85%
27211.5%
[
70.0%
-
70.5%
]
70.31%
25613.7%
[
72.5%
-
73.0%
]
72.99%
2747.0%
[
73.5%
-
74.0%
]
73.56%
8750.0%
[
74.0%
-
74.5%
]
74.07%
2707.0%
[
74.5%
-
75.0%
]
74.73%
9150.0%
[
76.5%
-
77.0%
]
76.80%
3883.1%
[
83.0%
-
83.5%
]
83.18%
42812.5%
[
87.5%
-
88.0%
]
87.62%
4204.2%
[
89.5%
-
90.0%
]
89.53%
5542.5%
[
90.5%
-
91.0%
]
90.95%
3984.5%
[
92.0%
-
92.5%
]
92.37%
49821.2%
[
93.0%
-
93.5%
]
93.28%
23816.4%
[
99.5%
-
100.0%
]
100.00%
6850.0%