Filer, ID Map & Demographics
Filer Map
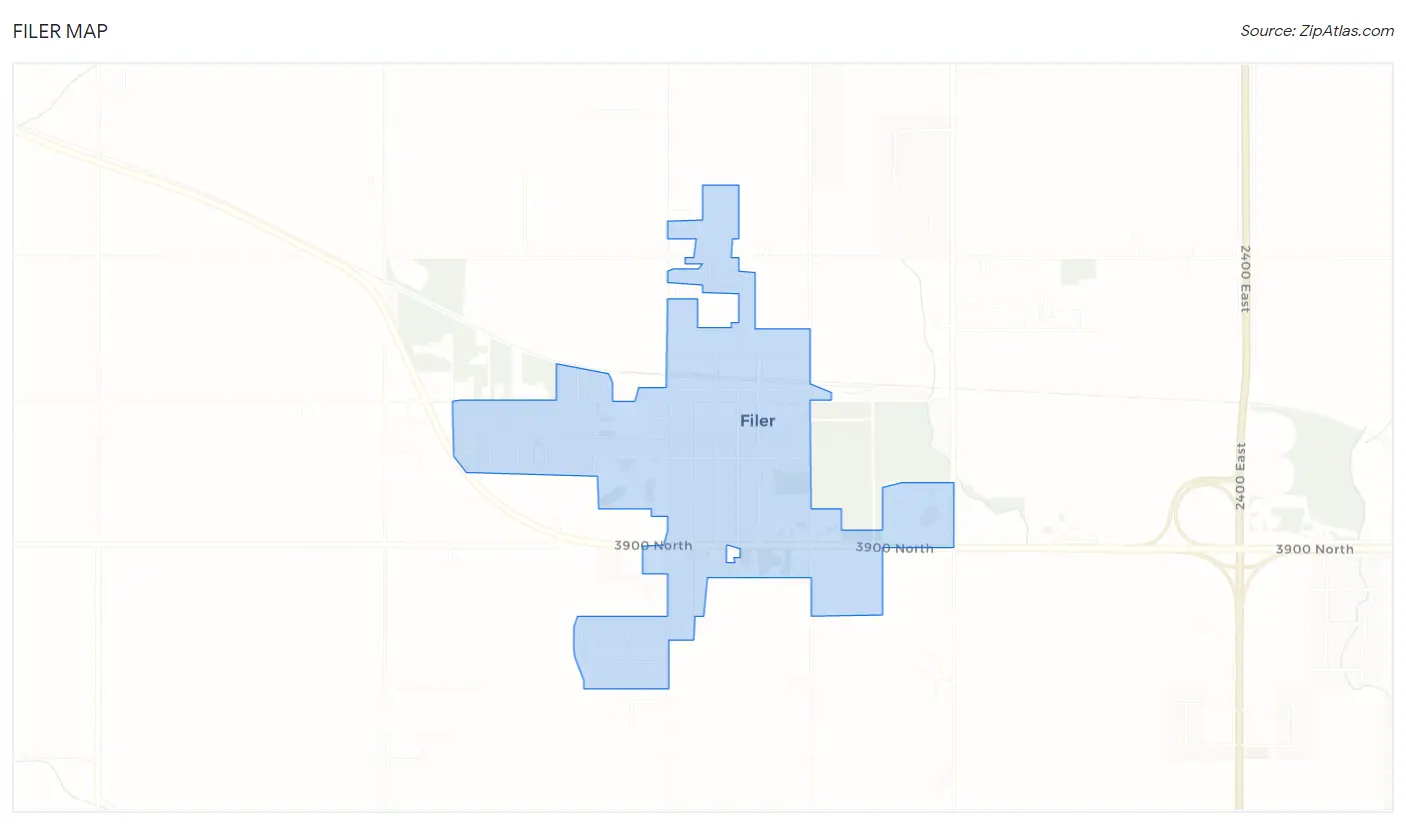
Filer Overview
$21,188
PER CAPITA INCOME
$51,058
AVG FAMILY INCOME
$48,559
AVG HOUSEHOLD INCOME
19.8%
WAGE / INCOME GAP [ % ]
80.2¢/ $1
WAGE / INCOME GAP [ $ ]
0.36
INEQUALITY / GINI INDEX
2,766
TOTAL POPULATION
1,289
MALE POPULATION
1,477
FEMALE POPULATION
87.27
MALES / 100 FEMALES
114.58
FEMALES / 100 MALES
30.2
MEDIAN AGE
3.1
AVG FAMILY SIZE
2.7
AVG HOUSEHOLD SIZE
1,050
LABOR FORCE [ PEOPLE ]
52.6%
PERCENT IN LABOR FORCE
3.3%
UNEMPLOYMENT RATE
Filer Zip Codes
Filer Area Codes
Income in Filer
Income Overview in Filer
Per Capita Income in Filer is $21,188, while median incomes of families and households are $51,058 and $48,559 respectively.
| Characteristic | Number | Measure |
| Per Capita Income | 2,766 | $21,188 |
| Median Family Income | 775 | $51,058 |
| Mean Family Income | 775 | $63,226 |
| Median Household Income | 1,014 | $48,559 |
| Mean Household Income | 1,014 | $56,800 |
| Income Deficit | 775 | $0 |
| Wage / Income Gap (%) | 2,766 | 19.82% |
| Wage / Income Gap ($) | 2,766 | 80.18¢ per $1 |
| Gini / Inequality Index | 2,766 | 0.36 |
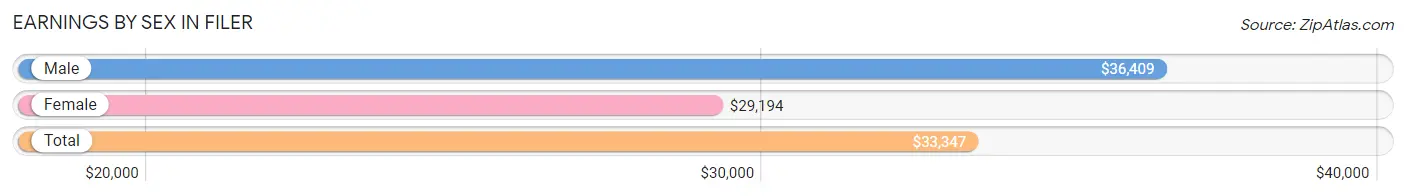
Earnings by Sex in Filer
Average Earnings in Filer are $33,347, $36,409 for men and $29,194 for women, a difference of 19.8%.
| Sex | Number | Average Earnings |
| Male | 642 (54.0%) | $36,409 |
| Female | 546 (46.0%) | $29,194 |
| Total | 1,188 (100.0%) | $33,347 |
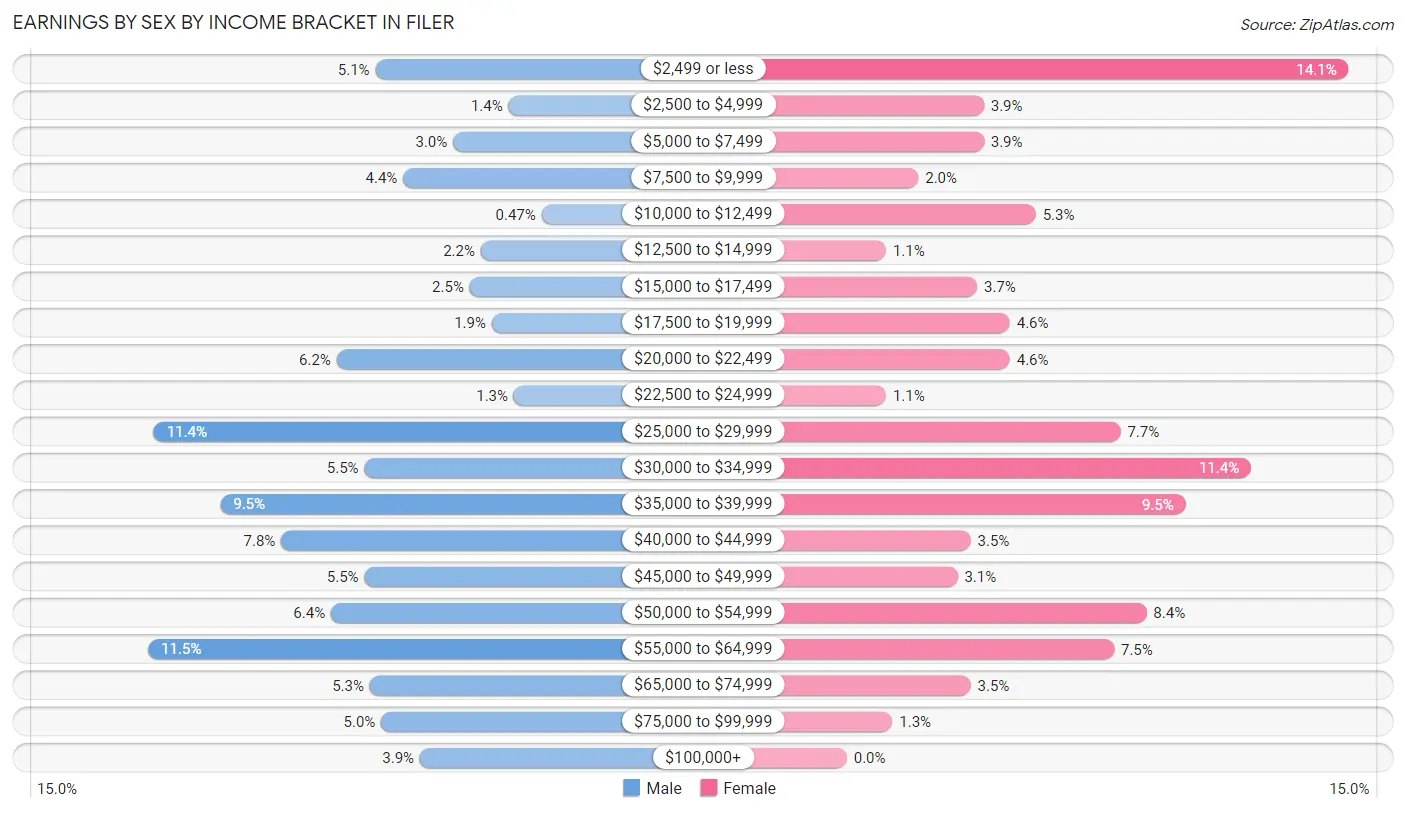
Earnings by Sex by Income Bracket in Filer
The most common earnings brackets in Filer are $55,000 to $64,999 for men (74 | 11.5%) and $2,499 or less for women (77 | 14.1%).
| Income | Male | Female |
| $2,499 or less | 33 (5.1%) | 77 (14.1%) |
| $2,500 to $4,999 | 9 (1.4%) | 21 (3.8%) |
| $5,000 to $7,499 | 19 (3.0%) | 21 (3.8%) |
| $7,500 to $9,999 | 28 (4.4%) | 11 (2.0%) |
| $10,000 to $12,499 | 3 (0.5%) | 29 (5.3%) |
| $12,500 to $14,999 | 14 (2.2%) | 6 (1.1%) |
| $15,000 to $17,499 | 16 (2.5%) | 20 (3.7%) |
| $17,500 to $19,999 | 12 (1.9%) | 25 (4.6%) |
| $20,000 to $22,499 | 40 (6.2%) | 25 (4.6%) |
| $22,500 to $24,999 | 8 (1.3%) | 6 (1.1%) |
| $25,000 to $29,999 | 73 (11.4%) | 42 (7.7%) |
| $30,000 to $34,999 | 35 (5.4%) | 62 (11.4%) |
| $35,000 to $39,999 | 61 (9.5%) | 52 (9.5%) |
| $40,000 to $44,999 | 50 (7.8%) | 19 (3.5%) |
| $45,000 to $49,999 | 35 (5.4%) | 17 (3.1%) |
| $50,000 to $54,999 | 41 (6.4%) | 46 (8.4%) |
| $55,000 to $64,999 | 74 (11.5%) | 41 (7.5%) |
| $65,000 to $74,999 | 34 (5.3%) | 19 (3.5%) |
| $75,000 to $99,999 | 32 (5.0%) | 7 (1.3%) |
| $100,000+ | 25 (3.9%) | 0 (0.0%) |
| Total | 642 (100.0%) | 546 (100.0%) |
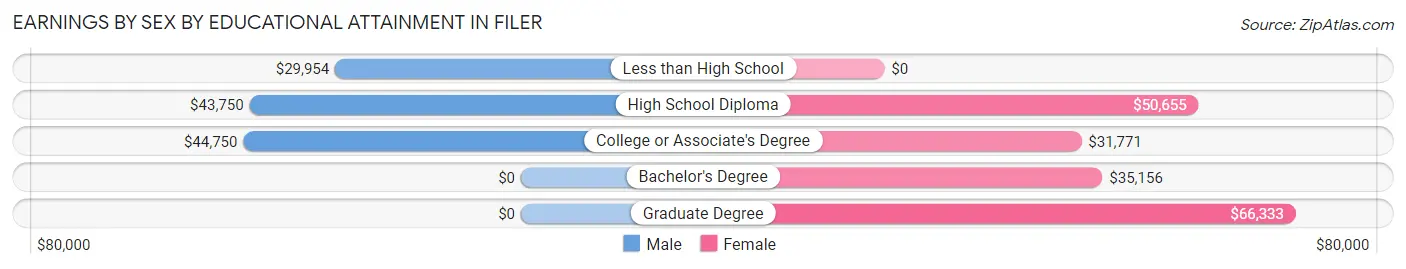
Earnings by Sex by Educational Attainment in Filer
Average earnings in Filer are $36,295 for men and $31,445 for women, a difference of 13.4%. Men with an educational attainment of college or associate's degree enjoy the highest average annual earnings of $44,750, while those with less than high school education earn the least with $29,954. Women with an educational attainment of graduate degree earn the most with the average annual earnings of $66,333, while those with college or associate's degree education have the smallest earnings of $31,771.
| Educational Attainment | Male Income | Female Income |
| Less than High School | $29,954 | $0 |
| High School Diploma | $43,750 | $50,655 |
| College or Associate's Degree | $44,750 | $31,771 |
| Bachelor's Degree | - | - |
| Graduate Degree | - | - |
| Total | $36,295 | $31,445 |
Family Income in Filer
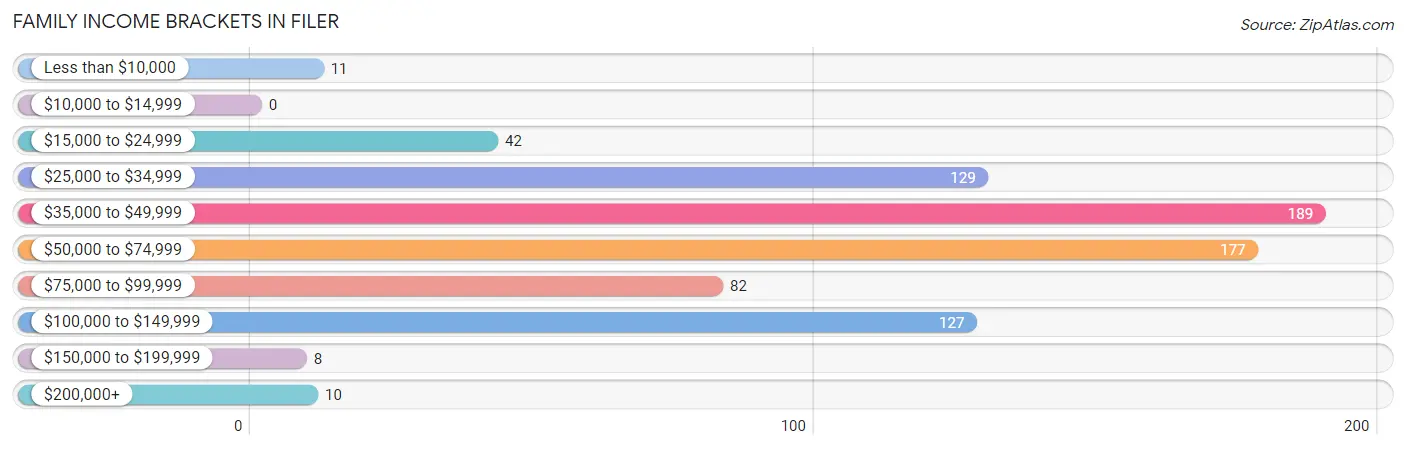
Family Income Brackets in Filer
According to the Filer family income data, there are 189 families falling into the $35,000 to $49,999 income range, which is the most common income bracket and makes up 24.4% of all families.
| Income Bracket | # Families | % Families |
| Less than $10,000 | 11 | 1.4% |
| $10,000 to $14,999 | 0 | 0.0% |
| $15,000 to $24,999 | 42 | 5.4% |
| $25,000 to $34,999 | 129 | 16.6% |
| $35,000 to $49,999 | 189 | 24.4% |
| $50,000 to $74,999 | 177 | 22.8% |
| $75,000 to $99,999 | 82 | 10.6% |
| $100,000 to $149,999 | 127 | 16.4% |
| $150,000 to $199,999 | 8 | 1.0% |
| $200,000+ | 10 | 1.3% |
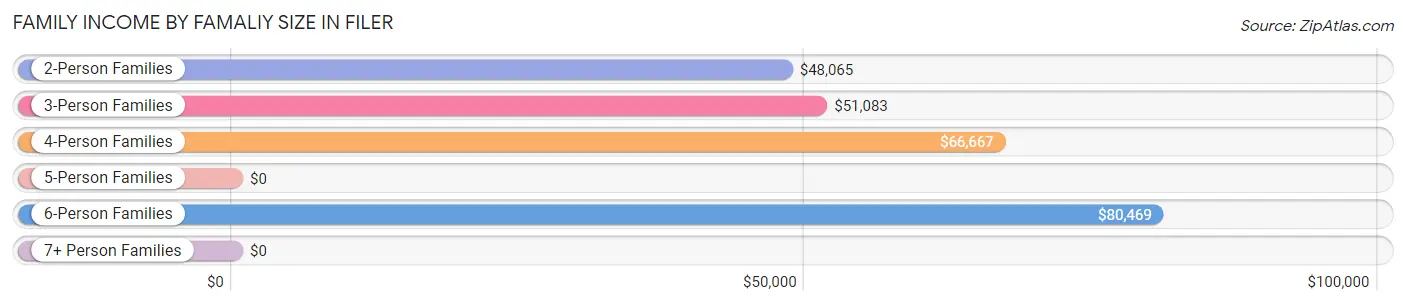
Family Income by Famaliy Size in Filer
6-person families (45 | 5.8%) account for the highest median family income in Filer with $80,469 per family, while 2-person families (412 | 53.2%) have the highest median income of $24,032 per family member.
| Income Bracket | # Families | Median Income |
| 2-Person Families | 412 (53.2%) | $48,065 |
| 3-Person Families | 81 (10.4%) | $51,083 |
| 4-Person Families | 164 (21.2%) | $66,667 |
| 5-Person Families | 58 (7.5%) | $0 |
| 6-Person Families | 45 (5.8%) | $80,469 |
| 7+ Person Families | 15 (1.9%) | $0 |
| Total | 775 (100.0%) | $51,058 |
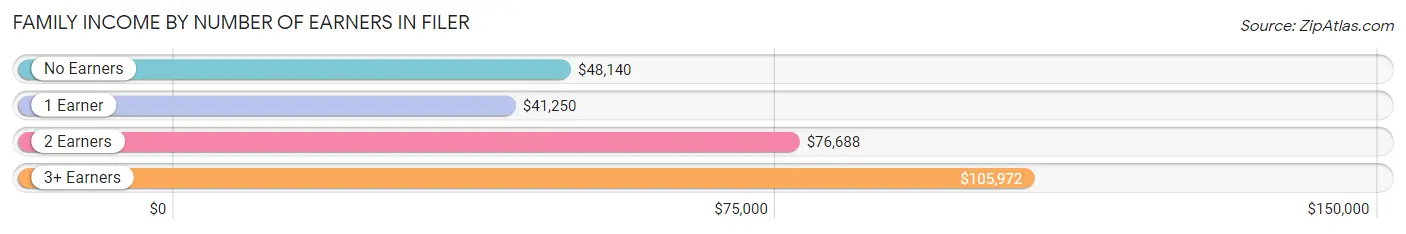
Family Income by Number of Earners in Filer
The median family income in Filer is $51,058, with families comprising 3+ earners (42) having the highest median family income of $105,972, while families with 1 earner (289) have the lowest median family income of $41,250, accounting for 5.4% and 37.3% of families, respectively.
| Number of Earners | # Families | Median Income |
| No Earners | 171 (22.1%) | $48,140 |
| 1 Earner | 289 (37.3%) | $41,250 |
| 2 Earners | 273 (35.2%) | $76,688 |
| 3+ Earners | 42 (5.4%) | $105,972 |
| Total | 775 (100.0%) | $51,058 |
Household Income in Filer
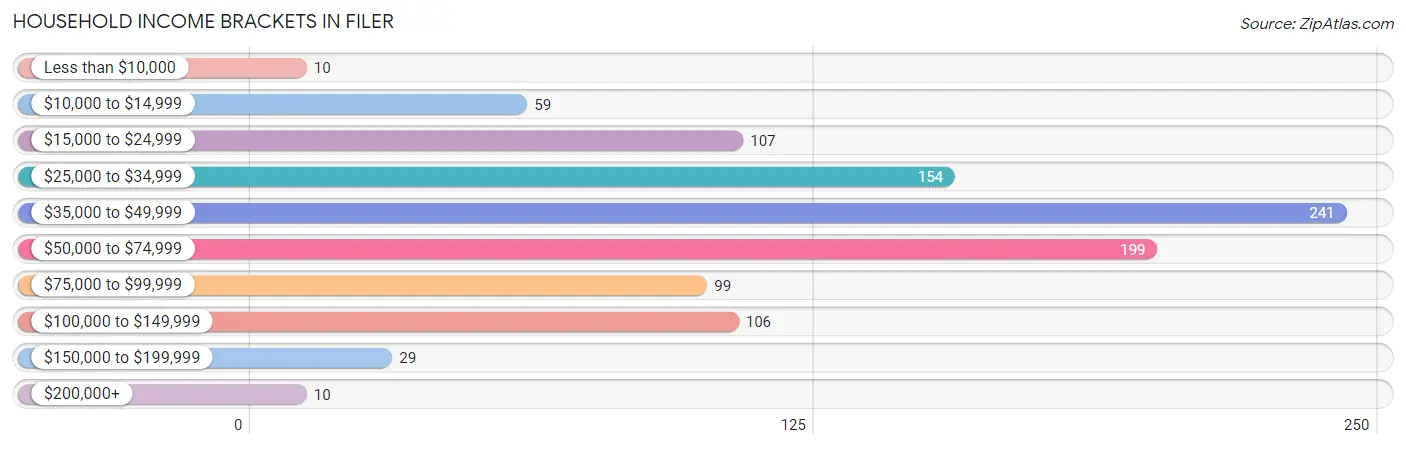
Household Income Brackets in Filer
With 241 households falling in the category, the $35,000 to $49,999 income range is the most frequent in Filer, accounting for 23.8% of all households. In contrast, only 10 households (1.0%) fall into the less than $10,000 income bracket, making it the least populous group.
| Income Bracket | # Households | % Households |
| Less than $10,000 | 10 | 1.0% |
| $10,000 to $14,999 | 59 | 5.8% |
| $15,000 to $24,999 | 107 | 10.6% |
| $25,000 to $34,999 | 154 | 15.2% |
| $35,000 to $49,999 | 241 | 23.8% |
| $50,000 to $74,999 | 199 | 19.6% |
| $75,000 to $99,999 | 99 | 9.8% |
| $100,000 to $149,999 | 106 | 10.5% |
| $150,000 to $199,999 | 29 | 2.9% |
| $200,000+ | 10 | 1.0% |
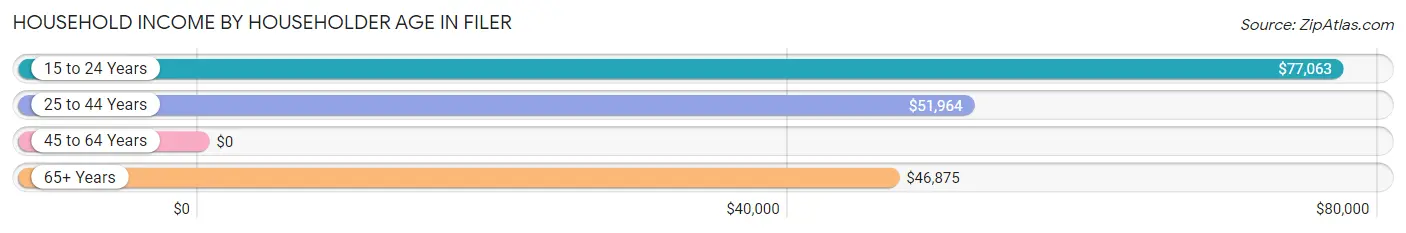
Household Income by Householder Age in Filer
The median household income in Filer is $48,559, with the highest median household income of $77,063 found in the 15 to 24 years age bracket for the primary householder. A total of 63 households (6.2%) fall into this category. Meanwhile, the 45 to 64 years age bracket for the primary householder has the lowest median household income of $0, with 287 households (28.3%) in this group.
| Income Bracket | # Households | Median Income |
| 15 to 24 Years | 63 (6.2%) | $77,063 |
| 25 to 44 Years | 311 (30.7%) | $51,964 |
| 45 to 64 Years | 287 (28.3%) | $0 |
| 65+ Years | 353 (34.8%) | $46,875 |
| Total | 1,014 (100.0%) | $48,559 |
Poverty in Filer
Income Below Poverty by Sex and Age in Filer
With 16.8% poverty level for males and 12.5% for females among the residents of Filer, under 5 year old males and 75 year old and over females are the most vulnerable to poverty, with 73 males (60.3%) and 26 females (30.9%) in their respective age groups living below the poverty level.
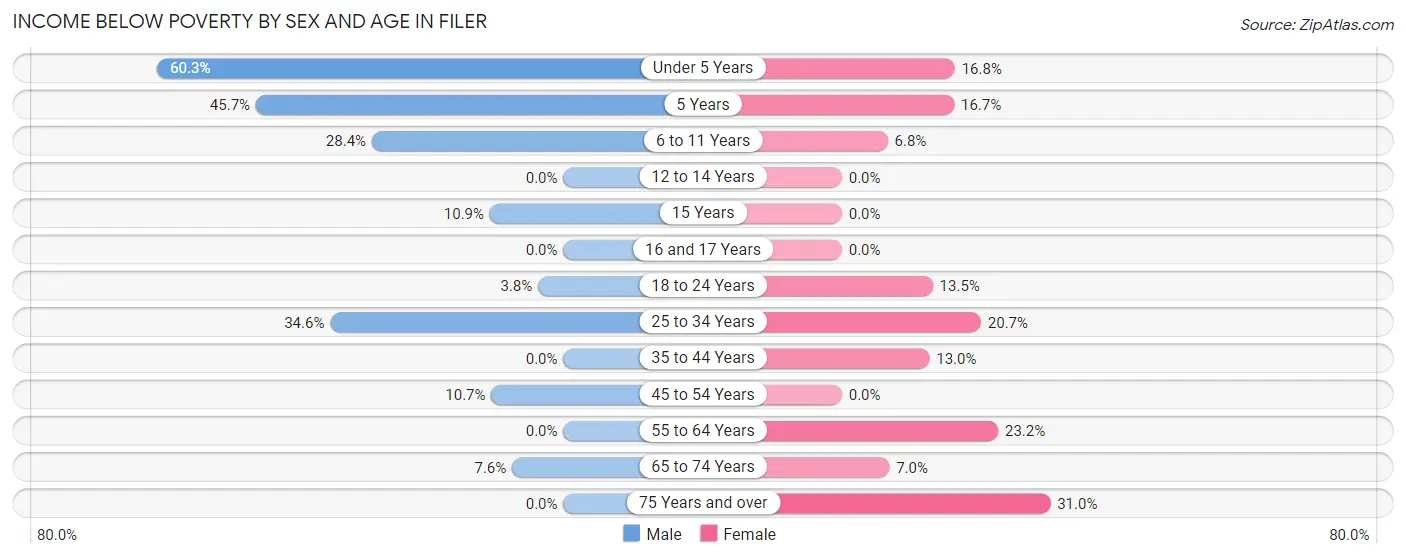
| Age Bracket | Male | Female |
| Under 5 Years | 73 (60.3%) | 28 (16.8%) |
| 5 Years | 21 (45.7%) | 2 (16.7%) |
| 6 to 11 Years | 29 (28.4%) | 10 (6.8%) |
| 12 to 14 Years | 0 (0.0%) | 0 (0.0%) |
| 15 Years | 6 (10.9%) | 0 (0.0%) |
| 16 and 17 Years | 0 (0.0%) | 0 (0.0%) |
| 18 to 24 Years | 5 (3.8%) | 17 (13.5%) |
| 25 to 34 Years | 54 (34.6%) | 38 (20.6%) |
| 35 to 44 Years | 0 (0.0%) | 20 (13.0%) |
| 45 to 54 Years | 14 (10.7%) | 0 (0.0%) |
| 55 to 64 Years | 0 (0.0%) | 29 (23.2%) |
| 65 to 74 Years | 14 (7.6%) | 15 (7.0%) |
| 75 Years and over | 0 (0.0%) | 26 (30.9%) |
| Total | 216 (16.8%) | 185 (12.5%) |
Income Above Poverty by Sex and Age in Filer
According to the poverty statistics in Filer, males aged 12 to 14 years and females aged 12 to 14 years are the age groups that are most secure financially, with 100.0% of males and 100.0% of females in these age groups living above the poverty line.
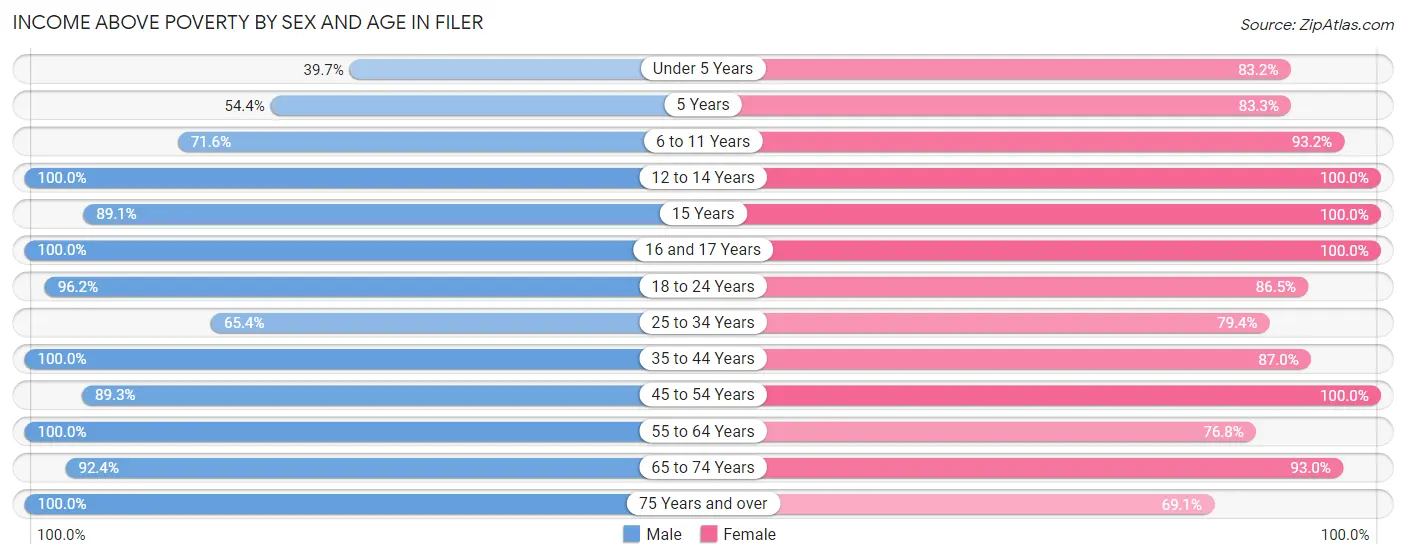
| Age Bracket | Male | Female |
| Under 5 Years | 48 (39.7%) | 139 (83.2%) |
| 5 Years | 25 (54.3%) | 10 (83.3%) |
| 6 to 11 Years | 73 (71.6%) | 137 (93.2%) |
| 12 to 14 Years | 36 (100.0%) | 38 (100.0%) |
| 15 Years | 49 (89.1%) | 45 (100.0%) |
| 16 and 17 Years | 103 (100.0%) | 69 (100.0%) |
| 18 to 24 Years | 128 (96.2%) | 109 (86.5%) |
| 25 to 34 Years | 102 (65.4%) | 146 (79.3%) |
| 35 to 44 Years | 102 (100.0%) | 134 (87.0%) |
| 45 to 54 Years | 117 (89.3%) | 113 (100.0%) |
| 55 to 64 Years | 77 (100.0%) | 96 (76.8%) |
| 65 to 74 Years | 170 (92.4%) | 198 (93.0%) |
| 75 Years and over | 43 (100.0%) | 58 (69.1%) |
| Total | 1,073 (83.2%) | 1,292 (87.5%) |
Income Below Poverty Among Married-Couple Families in Filer
The poverty statistics for married-couple families in Filer show that 9.6% or 50 of the total 522 families live below the poverty line. Families with 3 or 4 children have the highest poverty rate of 52.1%, comprising of 37 families. On the other hand, families with 1 or 2 children have the lowest poverty rate of 0.0%, which includes 0 families.
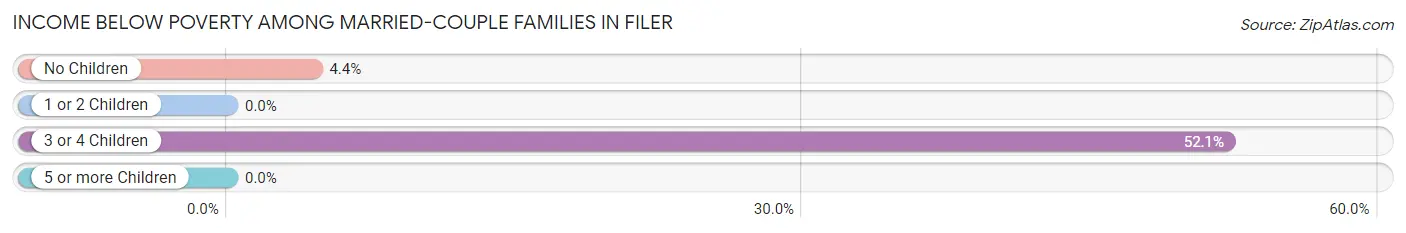
| Children | Above Poverty | Below Poverty |
| No Children | 282 (95.6%) | 13 (4.4%) |
| 1 or 2 Children | 141 (100.0%) | 0 (0.0%) |
| 3 or 4 Children | 34 (47.9%) | 37 (52.1%) |
| 5 or more Children | 15 (100.0%) | 0 (0.0%) |
| Total | 472 (90.4%) | 50 (9.6%) |
Income Below Poverty Among Single-Parent Households in Filer
According to the poverty data in Filer, 8.7% or 8 single-father households and 14.9% or 24 single-mother households are living below the poverty line. Among single-father households, those with 1 or 2 children have the highest poverty rate, with 8 households (12.7%) experiencing poverty. Likewise, among single-mother households, those with 1 or 2 children have the highest poverty rate, with 24 households (28.6%) falling below the poverty line.
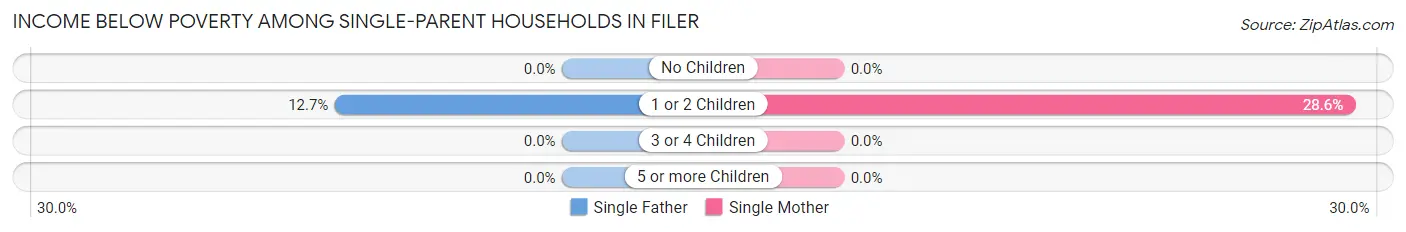
| Children | Single Father | Single Mother |
| No Children | 0 (0.0%) | 0 (0.0%) |
| 1 or 2 Children | 8 (12.7%) | 24 (28.6%) |
| 3 or 4 Children | 0 (0.0%) | 0 (0.0%) |
| 5 or more Children | 0 (0.0%) | 0 (0.0%) |
| Total | 8 (8.7%) | 24 (14.9%) |
Income Below Poverty Among Married-Couple vs Single-Parent Households in Filer
The poverty data for Filer shows that 50 of the married-couple family households (9.6%) and 32 of the single-parent households (12.7%) are living below the poverty level. Within the married-couple family households, those with 3 or 4 children have the highest poverty rate, with 37 households (52.1%) falling below the poverty line. Among the single-parent households, those with 1 or 2 children have the highest poverty rate, with 32 household (21.8%) living below poverty.
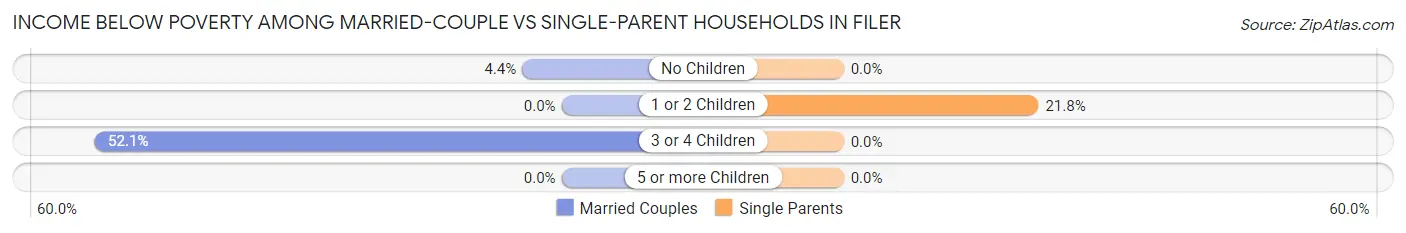
| Children | Married-Couple Families | Single-Parent Households |
| No Children | 13 (4.4%) | 0 (0.0%) |
| 1 or 2 Children | 0 (0.0%) | 32 (21.8%) |
| 3 or 4 Children | 37 (52.1%) | 0 (0.0%) |
| 5 or more Children | 0 (0.0%) | 0 (0.0%) |
| Total | 50 (9.6%) | 32 (12.7%) |
Race in Filer
The most populous races in Filer are White / Caucasian (2,612 | 94.4%), Hispanic or Latino (232 | 8.4%), and Two or more Races (63 | 2.3%).
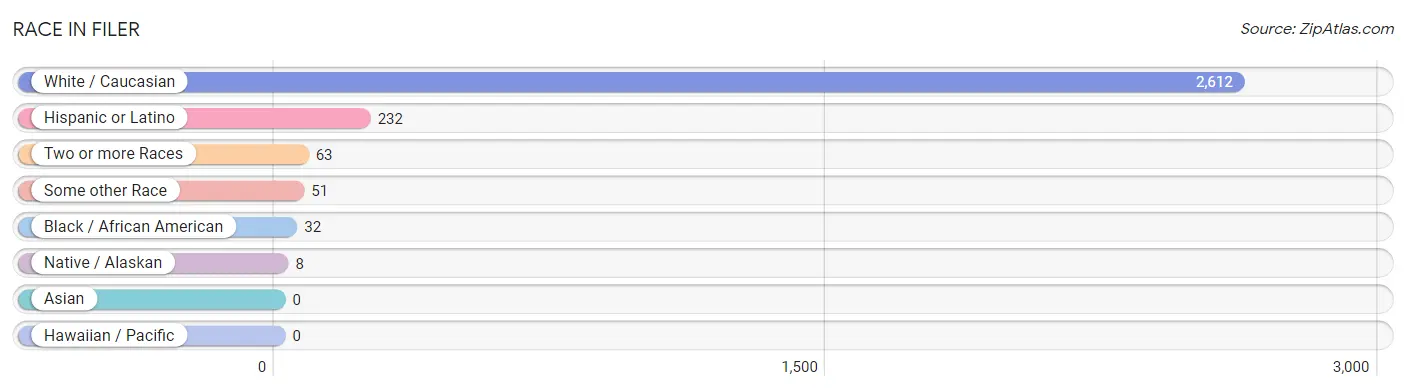
| Race | # Population | % Population |
| Asian | 0 | 0.0% |
| Black / African American | 32 | 1.2% |
| Hawaiian / Pacific | 0 | 0.0% |
| Hispanic or Latino | 232 | 8.4% |
| Native / Alaskan | 8 | 0.3% |
| White / Caucasian | 2,612 | 94.4% |
| Two or more Races | 63 | 2.3% |
| Some other Race | 51 | 1.8% |
| Total | 2,766 | 100.0% |
Ancestry in Filer
The most populous ancestries reported in Filer are English (468 | 16.9%), German (396 | 14.3%), American (284 | 10.3%), Mexican (221 | 8.0%), and Scottish (188 | 6.8%), together accounting for 56.3% of all Filer residents.
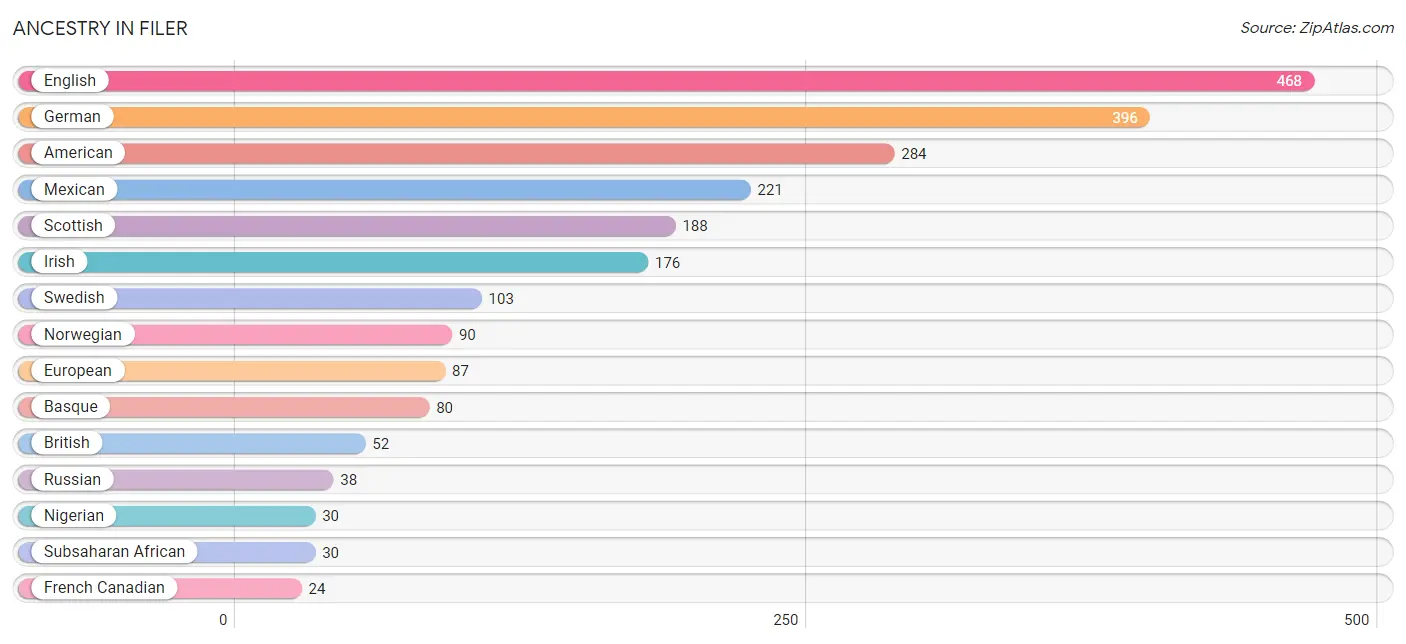
| Ancestry | # Population | % Population |
| American | 284 | 10.3% |
| Austrian | 16 | 0.6% |
| Basque | 80 | 2.9% |
| Belgian | 8 | 0.3% |
| Bhutanese | 8 | 0.3% |
| Blackfeet | 2 | 0.1% |
| British | 52 | 1.9% |
| Central American Indian | 5 | 0.2% |
| Cherokee | 2 | 0.1% |
| Czechoslovakian | 10 | 0.4% |
| Danish | 15 | 0.5% |
| Dutch | 5 | 0.2% |
| Eastern European | 4 | 0.1% |
| English | 468 | 16.9% |
| European | 87 | 3.2% |
| French | 19 | 0.7% |
| French Canadian | 24 | 0.9% |
| German | 396 | 14.3% |
| Hungarian | 12 | 0.4% |
| Icelander | 12 | 0.4% |
| Irish | 176 | 6.4% |
| Italian | 21 | 0.8% |
| Mexican | 221 | 8.0% |
| Mexican American Indian | 5 | 0.2% |
| Nigerian | 30 | 1.1% |
| Norwegian | 90 | 3.3% |
| Peruvian | 11 | 0.4% |
| Polish | 17 | 0.6% |
| Russian | 38 | 1.4% |
| Scottish | 188 | 6.8% |
| South American | 11 | 0.4% |
| Subsaharan African | 30 | 1.1% |
| Swedish | 103 | 3.7% |
| Swiss | 12 | 0.4% |
| Welsh | 5 | 0.2% | View All 35 Rows |
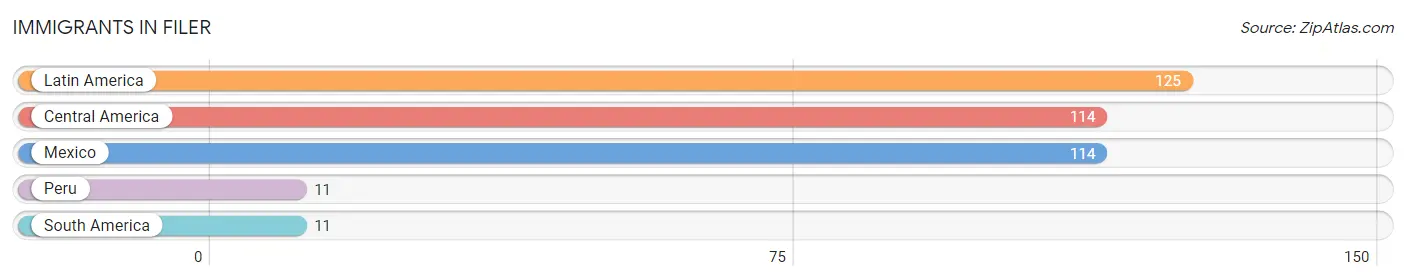
Immigrants in Filer
The most numerous immigrant groups reported in Filer came from Latin America (125 | 4.5%), Central America (114 | 4.1%), Mexico (114 | 4.1%), Peru (11 | 0.4%), and South America (11 | 0.4%), together accounting for 13.6% of all Filer residents.
| Immigration Origin | # Population | % Population |
| Central America | 114 | 4.1% |
| Latin America | 125 | 4.5% |
| Mexico | 114 | 4.1% |
| Peru | 11 | 0.4% |
| South America | 11 | 0.4% | View All 5 Rows |
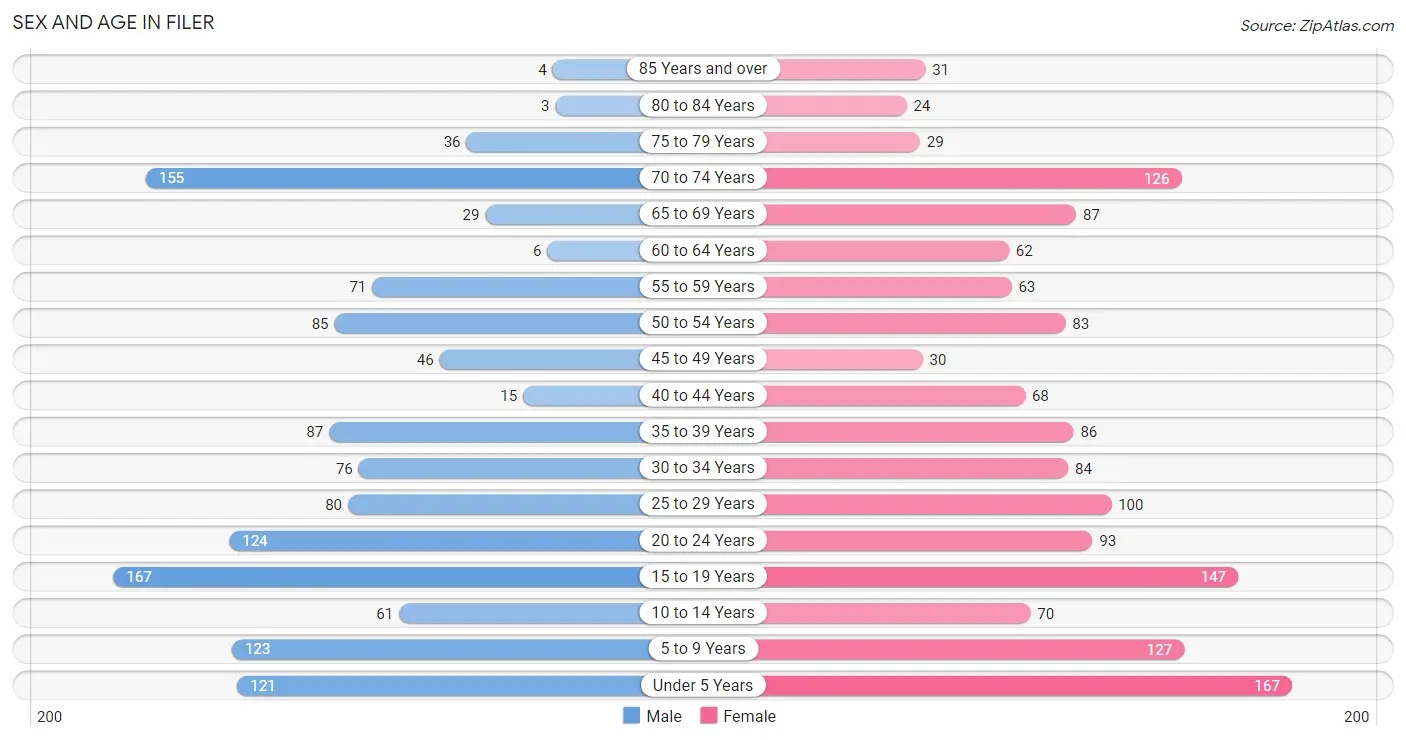
Sex and Age in Filer
Sex and Age in Filer
The most populous age groups in Filer are 15 to 19 Years (167 | 13.0%) for men and Under 5 Years (167 | 11.3%) for women.
| Age Bracket | Male | Female |
| Under 5 Years | 121 (9.4%) | 167 (11.3%) |
| 5 to 9 Years | 123 (9.5%) | 127 (8.6%) |
| 10 to 14 Years | 61 (4.7%) | 70 (4.7%) |
| 15 to 19 Years | 167 (13.0%) | 147 (10.0%) |
| 20 to 24 Years | 124 (9.6%) | 93 (6.3%) |
| 25 to 29 Years | 80 (6.2%) | 100 (6.8%) |
| 30 to 34 Years | 76 (5.9%) | 84 (5.7%) |
| 35 to 39 Years | 87 (6.8%) | 86 (5.8%) |
| 40 to 44 Years | 15 (1.2%) | 68 (4.6%) |
| 45 to 49 Years | 46 (3.6%) | 30 (2.0%) |
| 50 to 54 Years | 85 (6.6%) | 83 (5.6%) |
| 55 to 59 Years | 71 (5.5%) | 63 (4.3%) |
| 60 to 64 Years | 6 (0.5%) | 62 (4.2%) |
| 65 to 69 Years | 29 (2.2%) | 87 (5.9%) |
| 70 to 74 Years | 155 (12.0%) | 126 (8.5%) |
| 75 to 79 Years | 36 (2.8%) | 29 (2.0%) |
| 80 to 84 Years | 3 (0.2%) | 24 (1.6%) |
| 85 Years and over | 4 (0.3%) | 31 (2.1%) |
| Total | 1,289 (100.0%) | 1,477 (100.0%) |
Families and Households in Filer
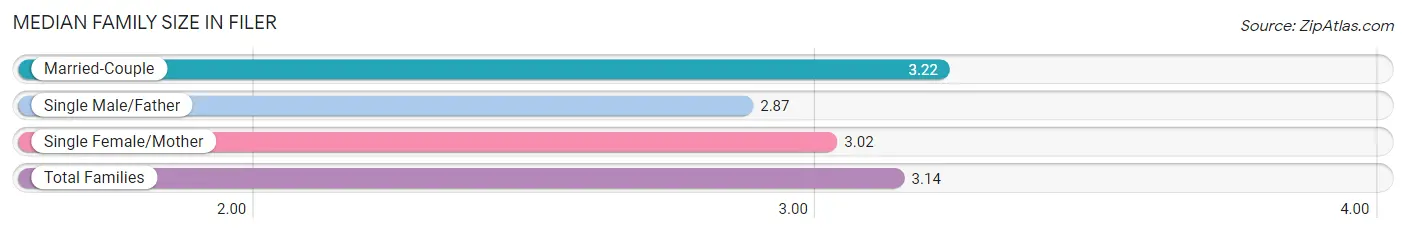
Median Family Size in Filer
The median family size in Filer is 3.14 persons per family, with married-couple families (522 | 67.3%) accounting for the largest median family size of 3.22 persons per family. On the other hand, single male/father families (92 | 11.9%) represent the smallest median family size with 2.87 persons per family.
| Family Type | # Families | Family Size |
| Married-Couple | 522 (67.3%) | 3.22 |
| Single Male/Father | 92 (11.9%) | 2.87 |
| Single Female/Mother | 161 (20.8%) | 3.02 |
| Total Families | 775 (100.0%) | 3.14 |
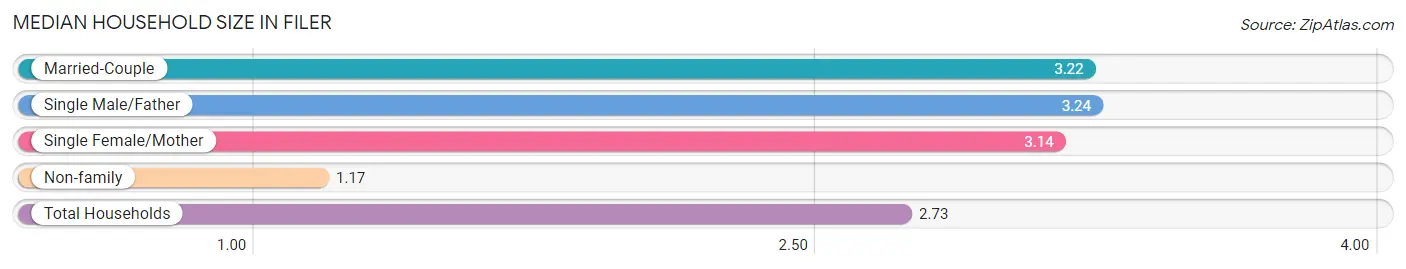
Median Household Size in Filer
The median household size in Filer is 2.73 persons per household, with single male/father households (92 | 9.1%) accounting for the largest median household size of 3.24 persons per household. non-family households (239 | 23.6%) represent the smallest median household size with 1.17 persons per household.
| Household Type | # Households | Household Size |
| Married-Couple | 522 (51.5%) | 3.22 |
| Single Male/Father | 92 (9.1%) | 3.24 |
| Single Female/Mother | 161 (15.9%) | 3.14 |
| Non-family | 239 (23.6%) | 1.17 |
| Total Households | 1,014 (100.0%) | 2.73 |
Household Size by Marriage Status in Filer
Out of a total of 1,014 households in Filer, 775 (76.4%) are family households, while 239 (23.6%) are nonfamily households. The most numerous type of family households are 2-person households, comprising 412, and the most common type of nonfamily households are 1-person households, comprising 204.
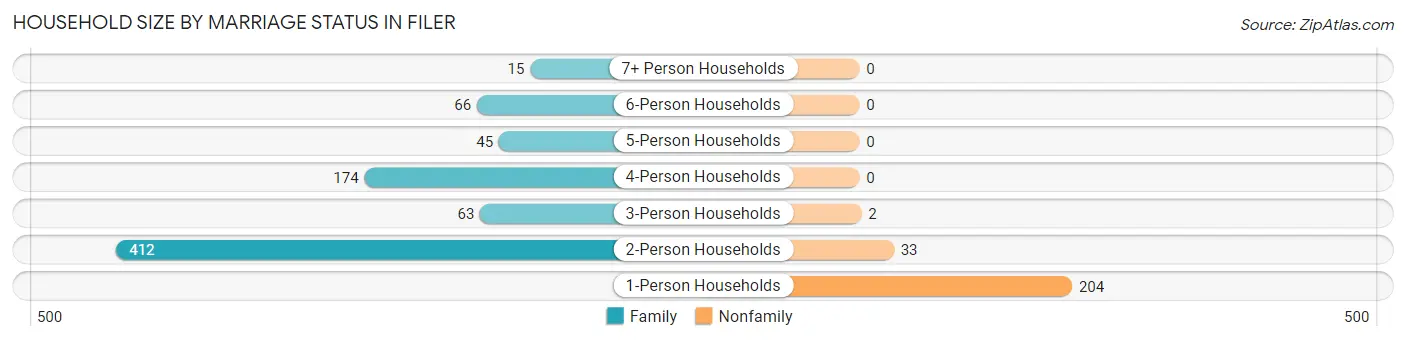
| Household Size | Family Households | Nonfamily Households |
| 1-Person Households | - | 204 (20.1%) |
| 2-Person Households | 412 (40.6%) | 33 (3.3%) |
| 3-Person Households | 63 (6.2%) | 2 (0.2%) |
| 4-Person Households | 174 (17.2%) | 0 (0.0%) |
| 5-Person Households | 45 (4.4%) | 0 (0.0%) |
| 6-Person Households | 66 (6.5%) | 0 (0.0%) |
| 7+ Person Households | 15 (1.5%) | 0 (0.0%) |
| Total | 775 (76.4%) | 239 (23.6%) |
Female Fertility in Filer
Fertility by Age in Filer
Average fertility rate in Filer is 201.0 births per 1,000 women. Women in the age bracket of 20 to 34 years have the highest fertility rate with 419.0 births per 1,000 women. Women in the age bracket of 20 to 34 years acount for 93.5% of all women with births.
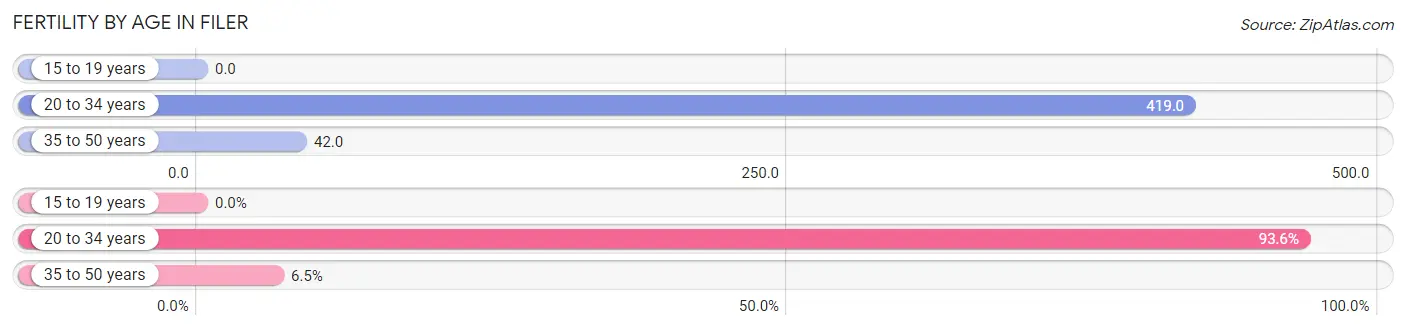
| Age Bracket | Women with Births | Births / 1,000 Women |
| 15 to 19 years | 0 (0.0%) | 0.0 |
| 20 to 34 years | 116 (93.5%) | 419.0 |
| 35 to 50 years | 8 (6.5%) | 42.0 |
| Total | 124 (100.0%) | 201.0 |
Fertility by Age by Marriage Status in Filer
81.5% of women with births (124) in Filer are married. The highest percentage of unmarried women with births falls into 20 to 34 years age bracket with 19.8% of them unmarried at the time of birth, while the lowest percentage of unmarried women with births belong to 35 to 50 years age bracket with 0.0% of them unmarried.
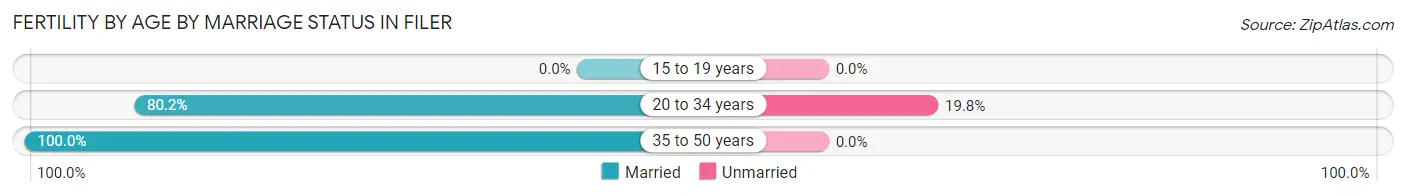
| Age Bracket | Married | Unmarried |
| 15 to 19 years | 0 (0.0%) | 0 (0.0%) |
| 20 to 34 years | 93 (80.2%) | 23 (19.8%) |
| 35 to 50 years | 8 (100.0%) | 0 (0.0%) |
| Total | 101 (81.5%) | 23 (18.5%) |
Fertility by Education in Filer
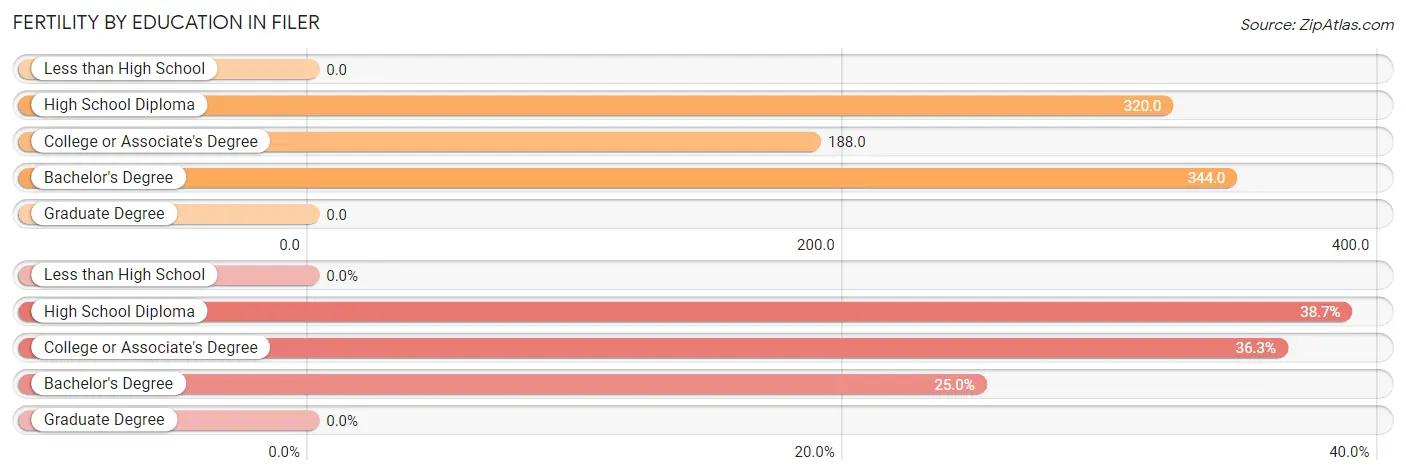
| Educational Attainment | Women with Births | Births / 1,000 Women |
| Less than High School | 0 (0.0%) | 0.0 |
| High School Diploma | 48 (38.7%) | 320.0 |
| College or Associate's Degree | 45 (36.3%) | 188.0 |
| Bachelor's Degree | 31 (25.0%) | 344.0 |
| Graduate Degree | 0 (0.0%) | 0.0 |
| Total | 124 (100.0%) | 201.0 |
Fertility by Education by Marriage Status in Filer
18.5% of women with births in Filer are unmarried. Women with the educational attainment of high school diploma are most likely to be married with 100.0% of them married at childbirth, while women with the educational attainment of college or associate's degree are least likely to be married with 51.1% of them unmarried at childbirth.
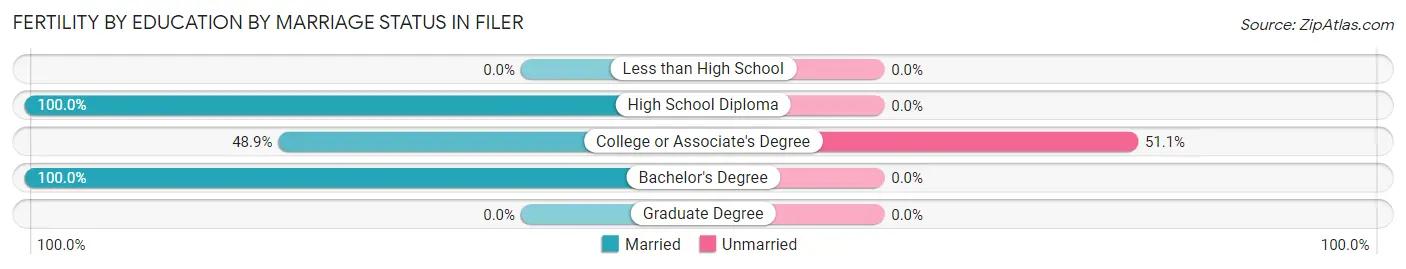
| Educational Attainment | Married | Unmarried |
| Less than High School | 0 (0.0%) | 0 (0.0%) |
| High School Diploma | 48 (100.0%) | 0 (0.0%) |
| College or Associate's Degree | 22 (48.9%) | 23 (51.1%) |
| Bachelor's Degree | 31 (100.0%) | 0 (0.0%) |
| Graduate Degree | 0 (0.0%) | 0 (0.0%) |
| Total | 101 (81.5%) | 23 (18.5%) |
Employment Characteristics in Filer
Employment by Class of Employer in Filer
Among the 957 employed individuals in Filer, private company employees (699 | 73.0%), self-employed (not incorporated) (83 | 8.7%), and local government employees (79 | 8.3%) make up the most common classes of employment.
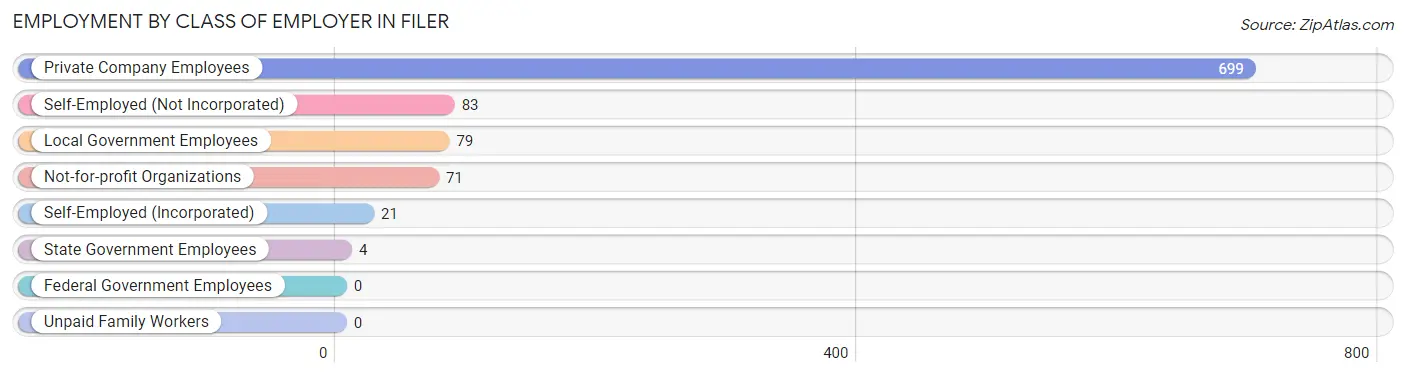
| Employer Class | # Employees | % Employees |
| Private Company Employees | 699 | 73.0% |
| Self-Employed (Incorporated) | 21 | 2.2% |
| Self-Employed (Not Incorporated) | 83 | 8.7% |
| Not-for-profit Organizations | 71 | 7.4% |
| Local Government Employees | 79 | 8.3% |
| State Government Employees | 4 | 0.4% |
| Federal Government Employees | 0 | 0.0% |
| Unpaid Family Workers | 0 | 0.0% |
| Total | 957 | 100.0% |
Employment Status by Age in Filer
According to the labor force statistics for Filer, out of the total population over 16 years of age (1,997), 52.6% or 1,050 individuals are in the labor force, with 3.3% or 35 of them unemployed. The age group with the highest labor force participation rate is 20 to 24 years, with 85.3% or 185 individuals in the labor force. Within the labor force, the 75 years and over age range has the highest percentage of unemployed individuals, with 69.2% or 9 of them being unemployed.
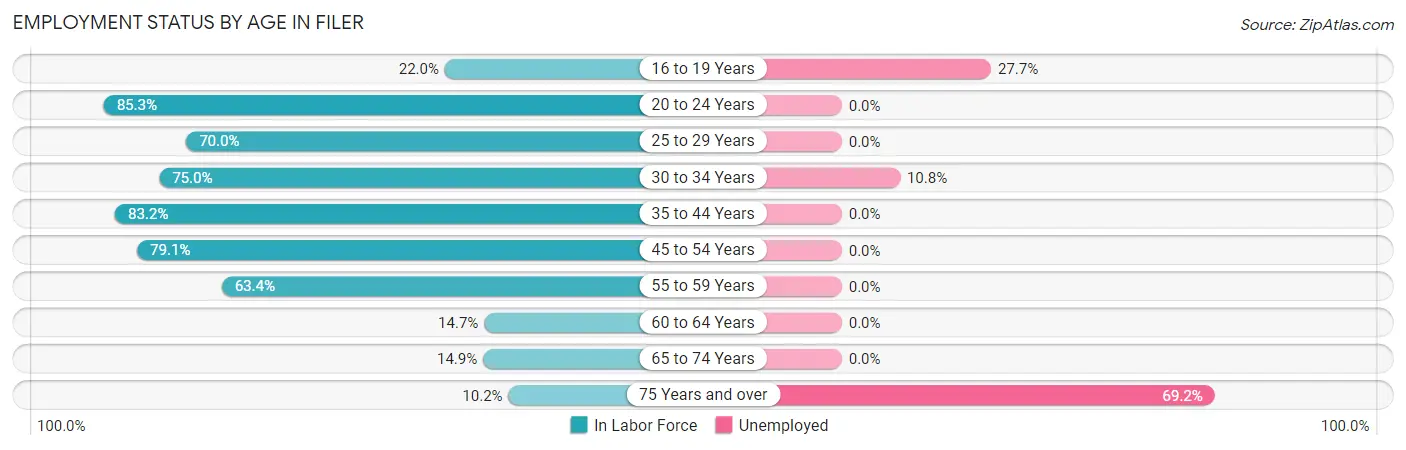
| Age Bracket | In Labor Force | Unemployed |
| 16 to 19 Years | 47 (22.0%) | 13 (27.7%) |
| 20 to 24 Years | 185 (85.3%) | 0 (0.0%) |
| 25 to 29 Years | 126 (70.0%) | 0 (0.0%) |
| 30 to 34 Years | 120 (75.0%) | 13 (10.8%) |
| 35 to 44 Years | 213 (83.2%) | 0 (0.0%) |
| 45 to 54 Years | 193 (79.1%) | 0 (0.0%) |
| 55 to 59 Years | 85 (63.4%) | 0 (0.0%) |
| 60 to 64 Years | 10 (14.7%) | 0 (0.0%) |
| 65 to 74 Years | 59 (14.9%) | 0 (0.0%) |
| 75 Years and over | 13 (10.2%) | 9 (69.2%) |
| Total | 1,050 (52.6%) | 35 (3.3%) |
Employment Status by Educational Attainment in Filer
According to labor force statistics for Filer, 71.7% of individuals (747) out of the total population between 25 and 64 years of age (1,042) are in the labor force, with 1.7% or 13 of them being unemployed. The group with the highest labor force participation rate are those with the educational attainment of bachelor's degree or higher, with 79.4% or 135 individuals in the labor force. Within the labor force, individuals with less than high school education have the highest percentage of unemployment, with 10.4% or 13 of them being unemployed.
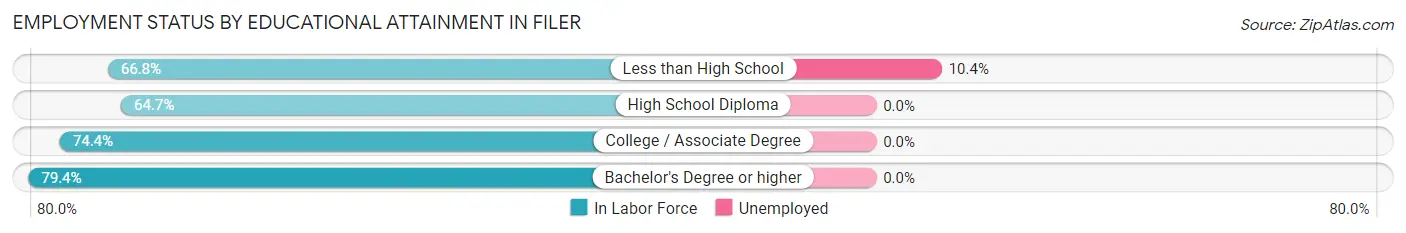
| Educational Attainment | In Labor Force | Unemployed |
| Less than High School | 125 (66.8%) | 19 (10.4%) |
| High School Diploma | 152 (64.7%) | 0 (0.0%) |
| College / Associate Degree | 335 (74.4%) | 0 (0.0%) |
| Bachelor's Degree or higher | 135 (79.4%) | 0 (0.0%) |
| Total | 747 (71.7%) | 18 (1.7%) |
Employment Occupations by Sex in Filer
Management, Business, Science and Arts Occupations
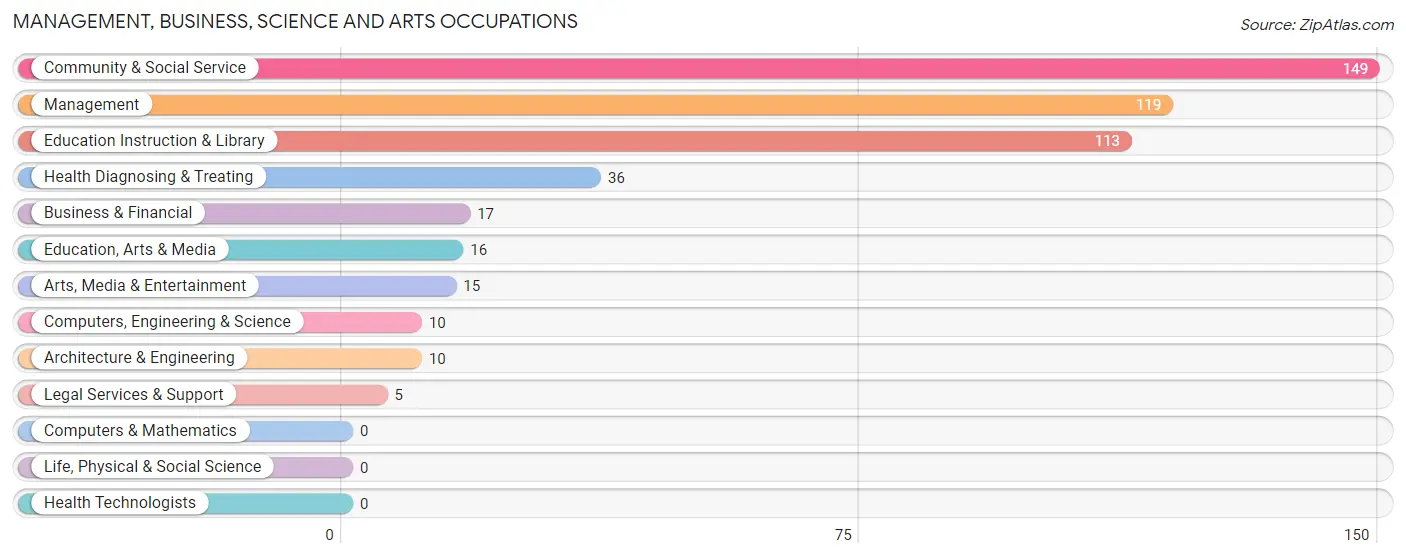
The most common Management, Business, Science and Arts occupations in Filer are Community & Social Service (149 | 14.7%), Management (119 | 11.7%), Education Instruction & Library (113 | 11.1%), Health Diagnosing & Treating (36 | 3.5%), and Business & Financial (17 | 1.7%).
Management, Business, Science and Arts Occupations by Sex
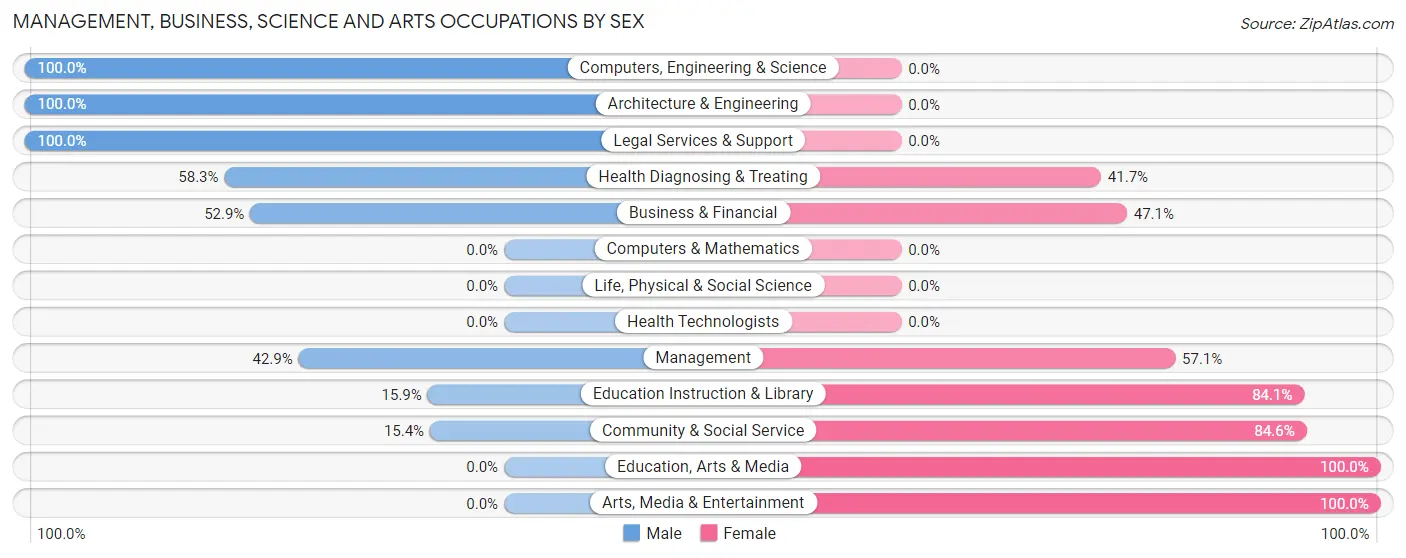
Within the Management, Business, Science and Arts occupations in Filer, the most male-oriented occupations are Computers, Engineering & Science (100.0%), Architecture & Engineering (100.0%), and Legal Services & Support (100.0%), while the most female-oriented occupations are Education, Arts & Media (100.0%), Arts, Media & Entertainment (100.0%), and Community & Social Service (84.6%).
| Occupation | Male | Female |
| Management | 51 (42.9%) | 68 (57.1%) |
| Business & Financial | 9 (52.9%) | 8 (47.1%) |
| Computers, Engineering & Science | 10 (100.0%) | 0 (0.0%) |
| Computers & Mathematics | 0 (0.0%) | 0 (0.0%) |
| Architecture & Engineering | 10 (100.0%) | 0 (0.0%) |
| Life, Physical & Social Science | 0 (0.0%) | 0 (0.0%) |
| Community & Social Service | 23 (15.4%) | 126 (84.6%) |
| Education, Arts & Media | 0 (0.0%) | 16 (100.0%) |
| Legal Services & Support | 5 (100.0%) | 0 (0.0%) |
| Education Instruction & Library | 18 (15.9%) | 95 (84.1%) |
| Arts, Media & Entertainment | 0 (0.0%) | 15 (100.0%) |
| Health Diagnosing & Treating | 21 (58.3%) | 15 (41.7%) |
| Health Technologists | 0 (0.0%) | 0 (0.0%) |
| Total (Category) | 114 (34.4%) | 217 (65.6%) |
| Total (Overall) | 578 (56.9%) | 438 (43.1%) |
Services Occupations
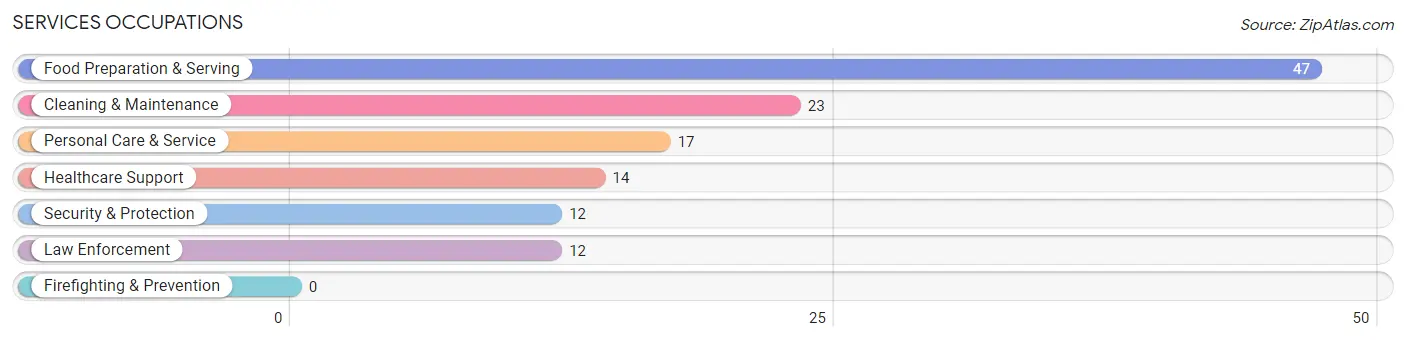
The most common Services occupations in Filer are Food Preparation & Serving (47 | 4.6%), Cleaning & Maintenance (23 | 2.3%), Personal Care & Service (17 | 1.7%), Healthcare Support (14 | 1.4%), and Security & Protection (12 | 1.2%).
Services Occupations by Sex
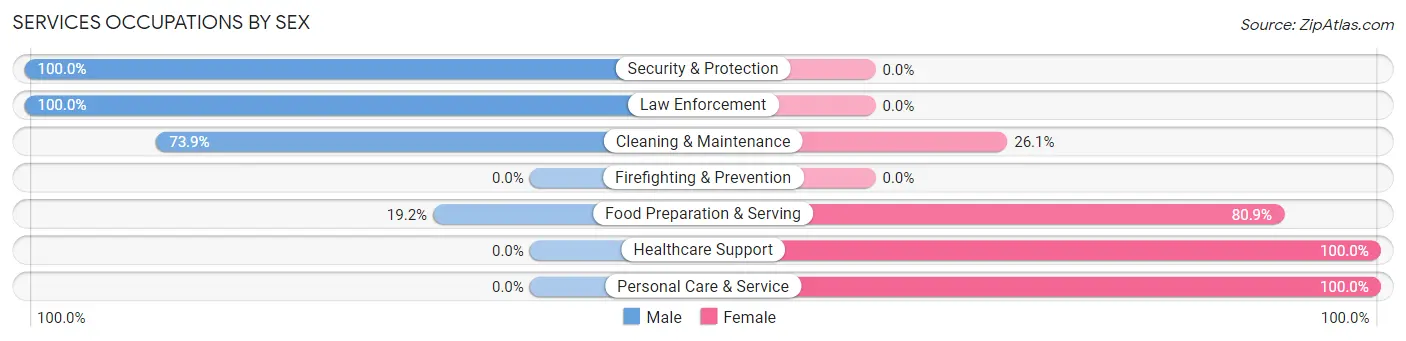
Within the Services occupations in Filer, the most male-oriented occupations are Security & Protection (100.0%), Law Enforcement (100.0%), and Cleaning & Maintenance (73.9%), while the most female-oriented occupations are Healthcare Support (100.0%), Personal Care & Service (100.0%), and Food Preparation & Serving (80.8%).
| Occupation | Male | Female |
| Healthcare Support | 0 (0.0%) | 14 (100.0%) |
| Security & Protection | 12 (100.0%) | 0 (0.0%) |
| Firefighting & Prevention | 0 (0.0%) | 0 (0.0%) |
| Law Enforcement | 12 (100.0%) | 0 (0.0%) |
| Food Preparation & Serving | 9 (19.2%) | 38 (80.8%) |
| Cleaning & Maintenance | 17 (73.9%) | 6 (26.1%) |
| Personal Care & Service | 0 (0.0%) | 17 (100.0%) |
| Total (Category) | 38 (33.6%) | 75 (66.4%) |
| Total (Overall) | 578 (56.9%) | 438 (43.1%) |
Sales and Office Occupations
The most common Sales and Office occupations in Filer are Sales & Related (87 | 8.6%), and Office & Administration (80 | 7.9%).
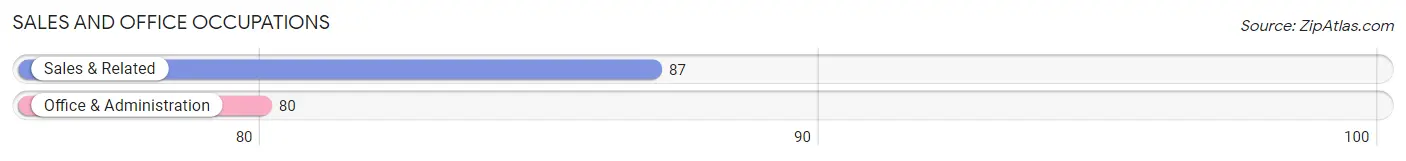
Sales and Office Occupations by Sex
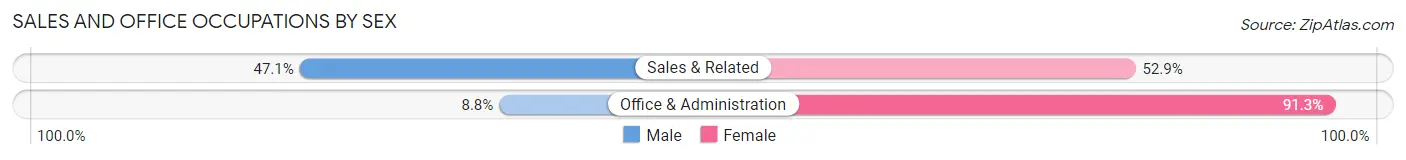
| Occupation | Male | Female |
| Sales & Related | 41 (47.1%) | 46 (52.9%) |
| Office & Administration | 7 (8.7%) | 73 (91.2%) |
| Total (Category) | 48 (28.7%) | 119 (71.3%) |
| Total (Overall) | 578 (56.9%) | 438 (43.1%) |
Natural Resources, Construction and Maintenance Occupations
The most common Natural Resources, Construction and Maintenance occupations in Filer are Construction & Extraction (99 | 9.7%), Farming, Fishing & Forestry (63 | 6.2%), and Installation, Maintenance & Repair (47 | 4.6%).
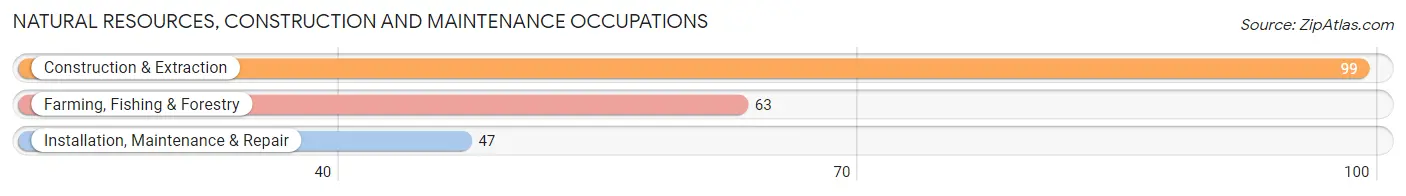
Natural Resources, Construction and Maintenance Occupations by Sex
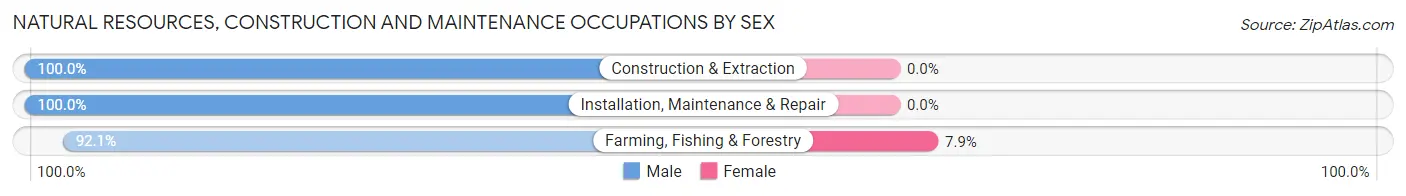
| Occupation | Male | Female |
| Farming, Fishing & Forestry | 58 (92.1%) | 5 (7.9%) |
| Construction & Extraction | 99 (100.0%) | 0 (0.0%) |
| Installation, Maintenance & Repair | 47 (100.0%) | 0 (0.0%) |
| Total (Category) | 204 (97.6%) | 5 (2.4%) |
| Total (Overall) | 578 (56.9%) | 438 (43.1%) |
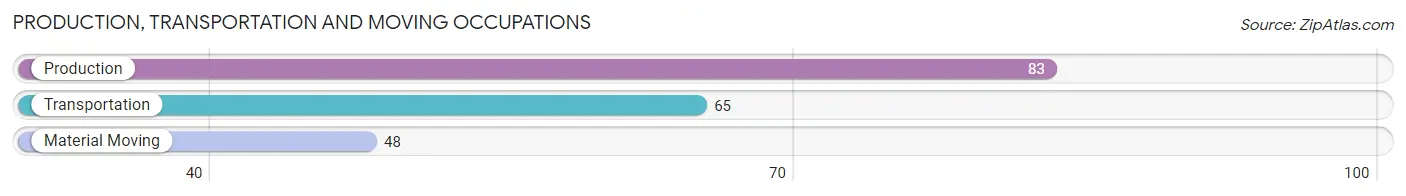
Production, Transportation and Moving Occupations
The most common Production, Transportation and Moving occupations in Filer are Production (83 | 8.2%), Transportation (65 | 6.4%), and Material Moving (48 | 4.7%).
Production, Transportation and Moving Occupations by Sex
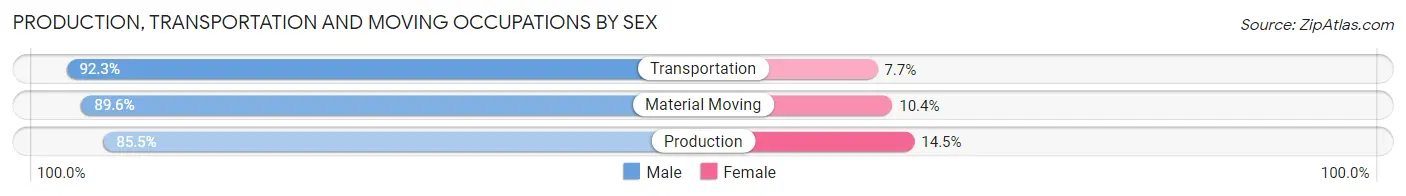
| Occupation | Male | Female |
| Production | 71 (85.5%) | 12 (14.5%) |
| Transportation | 60 (92.3%) | 5 (7.7%) |
| Material Moving | 43 (89.6%) | 5 (10.4%) |
| Total (Category) | 174 (88.8%) | 22 (11.2%) |
| Total (Overall) | 578 (56.9%) | 438 (43.1%) |
Employment Industries by Sex in Filer
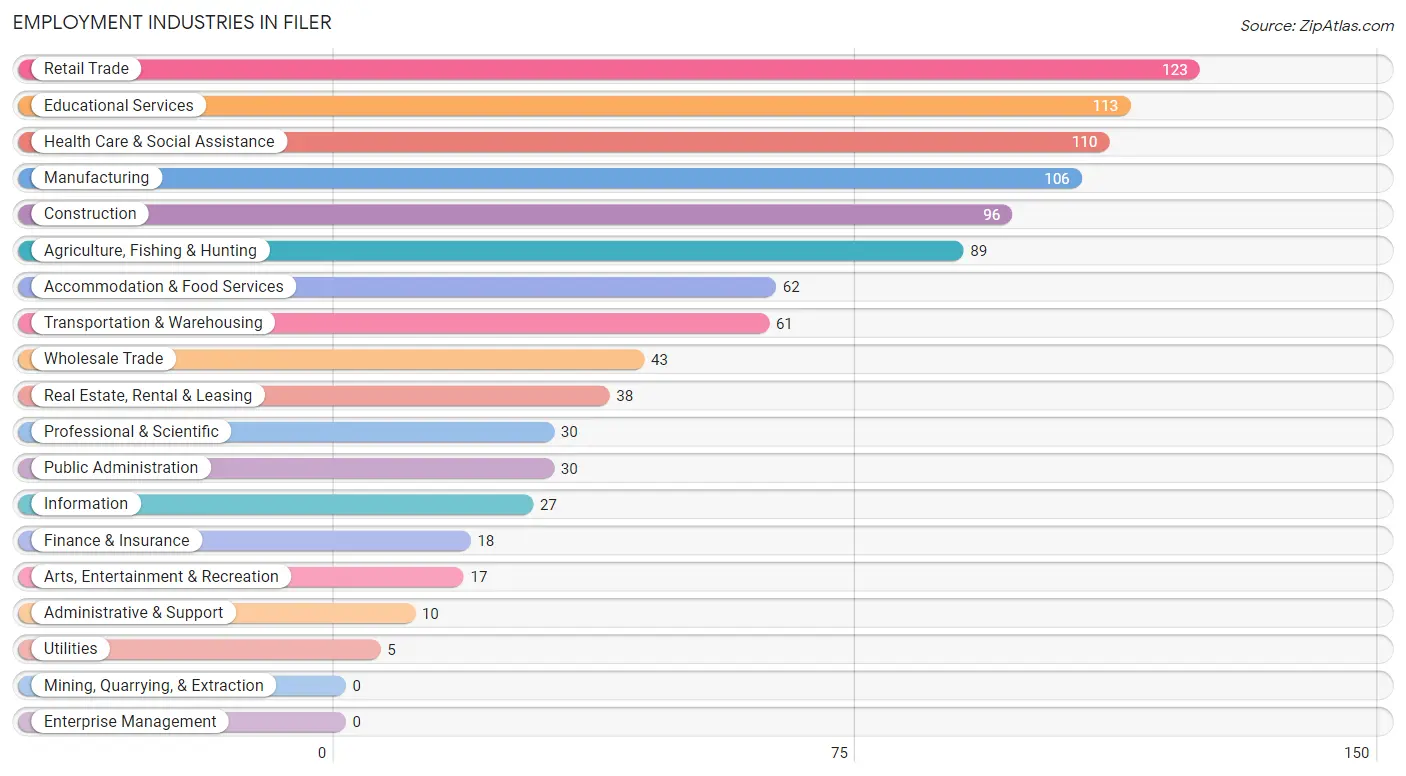
Employment Industries in Filer
The major employment industries in Filer include Retail Trade (123 | 12.1%), Educational Services (113 | 11.1%), Health Care & Social Assistance (110 | 10.8%), Manufacturing (106 | 10.4%), and Construction (96 | 9.5%).
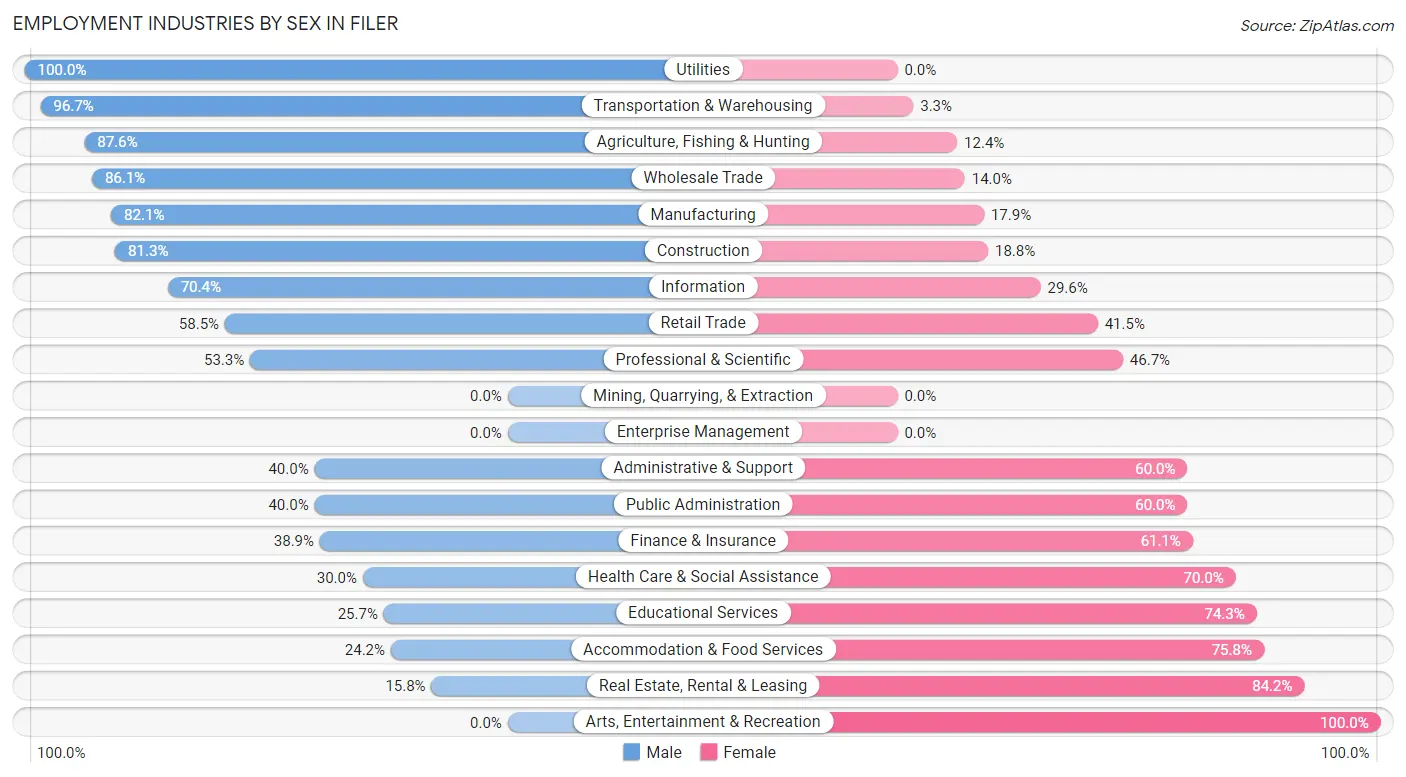
Employment Industries by Sex in Filer
The Filer industries that see more men than women are Utilities (100.0%), Transportation & Warehousing (96.7%), and Agriculture, Fishing & Hunting (87.6%), whereas the industries that tend to have a higher number of women are Arts, Entertainment & Recreation (100.0%), Real Estate, Rental & Leasing (84.2%), and Accommodation & Food Services (75.8%).
| Industry | Male | Female |
| Agriculture, Fishing & Hunting | 78 (87.6%) | 11 (12.4%) |
| Mining, Quarrying, & Extraction | 0 (0.0%) | 0 (0.0%) |
| Construction | 78 (81.2%) | 18 (18.8%) |
| Manufacturing | 87 (82.1%) | 19 (17.9%) |
| Wholesale Trade | 37 (86.1%) | 6 (14.0%) |
| Retail Trade | 72 (58.5%) | 51 (41.5%) |
| Transportation & Warehousing | 59 (96.7%) | 2 (3.3%) |
| Utilities | 5 (100.0%) | 0 (0.0%) |
| Information | 19 (70.4%) | 8 (29.6%) |
| Finance & Insurance | 7 (38.9%) | 11 (61.1%) |
| Real Estate, Rental & Leasing | 6 (15.8%) | 32 (84.2%) |
| Professional & Scientific | 16 (53.3%) | 14 (46.7%) |
| Enterprise Management | 0 (0.0%) | 0 (0.0%) |
| Administrative & Support | 4 (40.0%) | 6 (60.0%) |
| Educational Services | 29 (25.7%) | 84 (74.3%) |
| Health Care & Social Assistance | 33 (30.0%) | 77 (70.0%) |
| Arts, Entertainment & Recreation | 0 (0.0%) | 17 (100.0%) |
| Accommodation & Food Services | 15 (24.2%) | 47 (75.8%) |
| Public Administration | 12 (40.0%) | 18 (60.0%) |
| Total | 578 (56.9%) | 438 (43.1%) |
Education in Filer
School Enrollment in Filer
The most common levels of schooling among the 755 students in Filer are high school (277 | 36.7%), elementary school (161 | 21.3%), and middle school (105 | 13.9%).
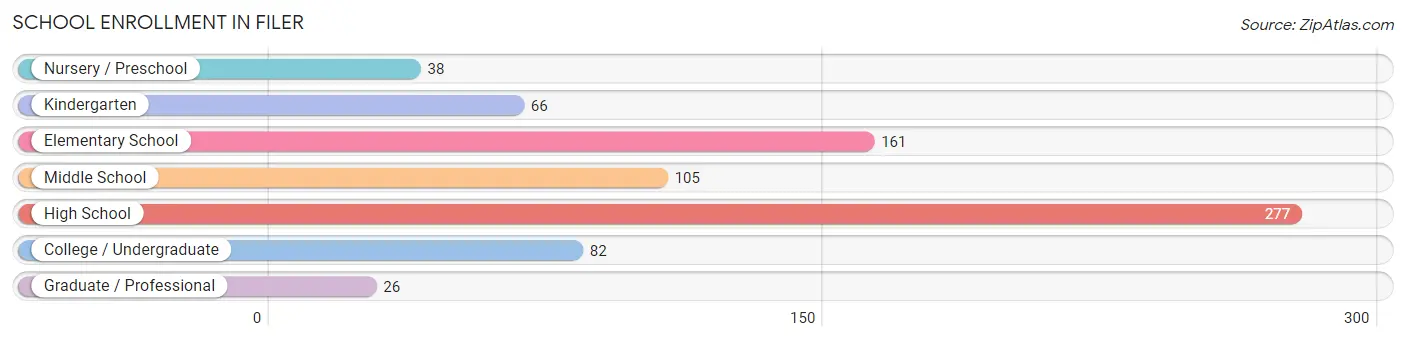
| School Level | # Students | % Students |
| Nursery / Preschool | 38 | 5.0% |
| Kindergarten | 66 | 8.7% |
| Elementary School | 161 | 21.3% |
| Middle School | 105 | 13.9% |
| High School | 277 | 36.7% |
| College / Undergraduate | 82 | 10.9% |
| Graduate / Professional | 26 | 3.4% |
| Total | 755 | 100.0% |
School Enrollment by Age by Funding Source in Filer
Out of a total of 755 students who are enrolled in schools in Filer, 54 (7.2%) attend a private institution, while the remaining 701 (92.8%) are enrolled in public schools. The age group of 3 to 4 year olds has the highest likelihood of being enrolled in private schools, with 21 (61.8% in the age bracket) enrolled. Conversely, the age group of 10 to 14 year olds has the lowest likelihood of being enrolled in a private school, with 131 (100.0% in the age bracket) attending a public institution.
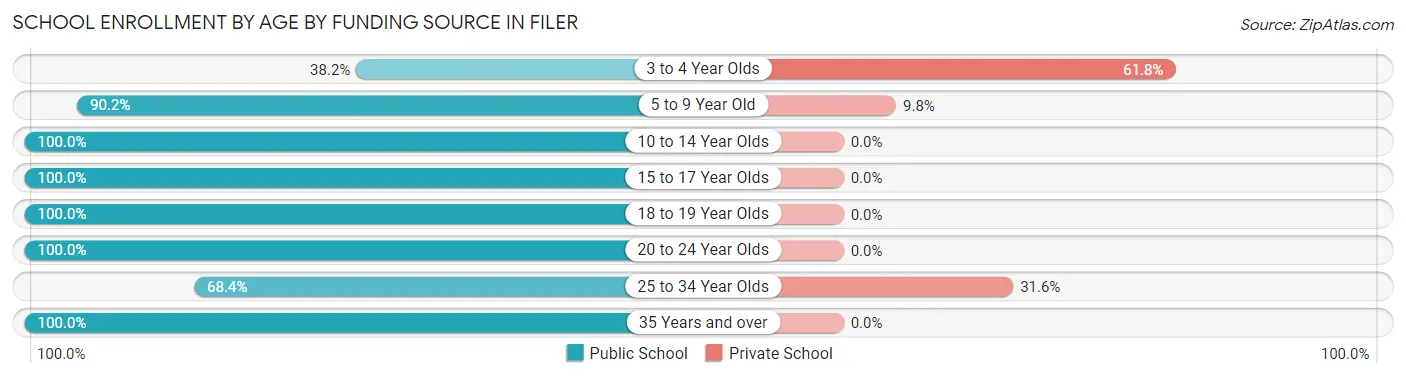
| Age Bracket | Public School | Private School |
| 3 to 4 Year Olds | 13 (38.2%) | 21 (61.8%) |
| 5 to 9 Year Old | 194 (90.2%) | 21 (9.8%) |
| 10 to 14 Year Olds | 131 (100.0%) | 0 (0.0%) |
| 15 to 17 Year Olds | 272 (100.0%) | 0 (0.0%) |
| 18 to 19 Year Olds | 26 (100.0%) | 0 (0.0%) |
| 20 to 24 Year Olds | 22 (100.0%) | 0 (0.0%) |
| 25 to 34 Year Olds | 26 (68.4%) | 12 (31.6%) |
| 35 Years and over | 17 (100.0%) | 0 (0.0%) |
| Total | 701 (92.8%) | 54 (7.2%) |
Educational Attainment by Field of Study in Filer
Education (86 | 35.4%), science & technology (45 | 18.5%), bio, nature & agricultural (37 | 15.2%), business (35 | 14.4%), and arts & humanities (21 | 8.6%) are the most common fields of study among 243 individuals in Filer who have obtained a bachelor's degree or higher.
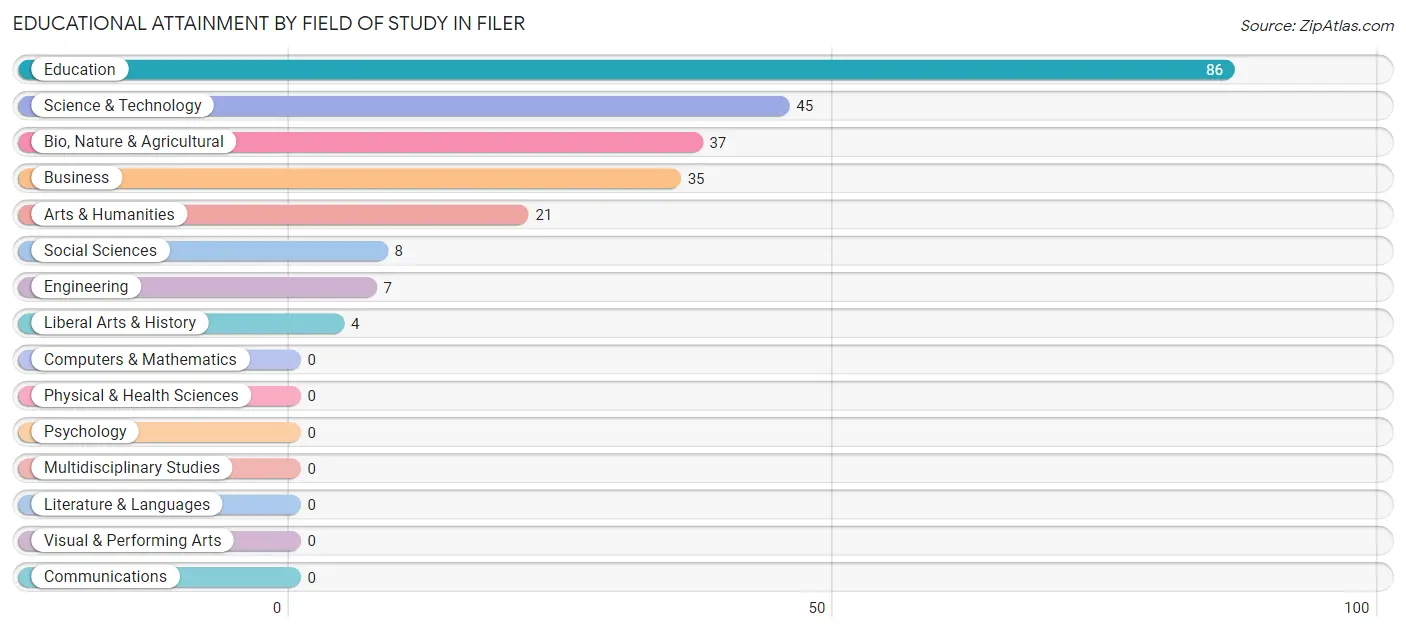
| Field of Study | # Graduates | % Graduates |
| Computers & Mathematics | 0 | 0.0% |
| Bio, Nature & Agricultural | 37 | 15.2% |
| Physical & Health Sciences | 0 | 0.0% |
| Psychology | 0 | 0.0% |
| Social Sciences | 8 | 3.3% |
| Engineering | 7 | 2.9% |
| Multidisciplinary Studies | 0 | 0.0% |
| Science & Technology | 45 | 18.5% |
| Business | 35 | 14.4% |
| Education | 86 | 35.4% |
| Literature & Languages | 0 | 0.0% |
| Liberal Arts & History | 4 | 1.7% |
| Visual & Performing Arts | 0 | 0.0% |
| Communications | 0 | 0.0% |
| Arts & Humanities | 21 | 8.6% |
| Total | 243 | 100.0% |
Transportation & Commute in Filer
Vehicle Availability by Sex in Filer
The most prevalent vehicle ownership categories in Filer are males with 3 vehicles (207, accounting for 36.6%) and females with 3 vehicles (119, making up 52.8%).
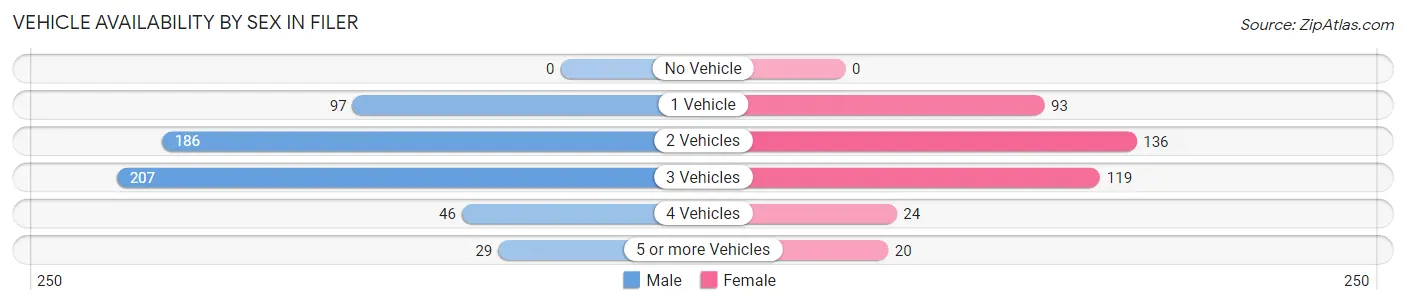
| Vehicles Available | Male | Female |
| No Vehicle | 0 (0.0%) | 0 (0.0%) |
| 1 Vehicle | 97 (17.2%) | 93 (23.7%) |
| 2 Vehicles | 186 (32.9%) | 136 (34.7%) |
| 3 Vehicles | 207 (36.6%) | 119 (30.4%) |
| 4 Vehicles | 46 (8.1%) | 24 (6.1%) |
| 5 or more Vehicles | 29 (5.1%) | 20 (5.1%) |
| Total | 565 (100.0%) | 392 (100.0%) |
Commute Time in Filer
The most frequently occuring commute durations in Filer are 15 to 19 minutes (299 commuters, 34.7%), 10 to 14 minutes (100 commuters, 11.6%), and 45 to 59 minutes (89 commuters, 10.3%).
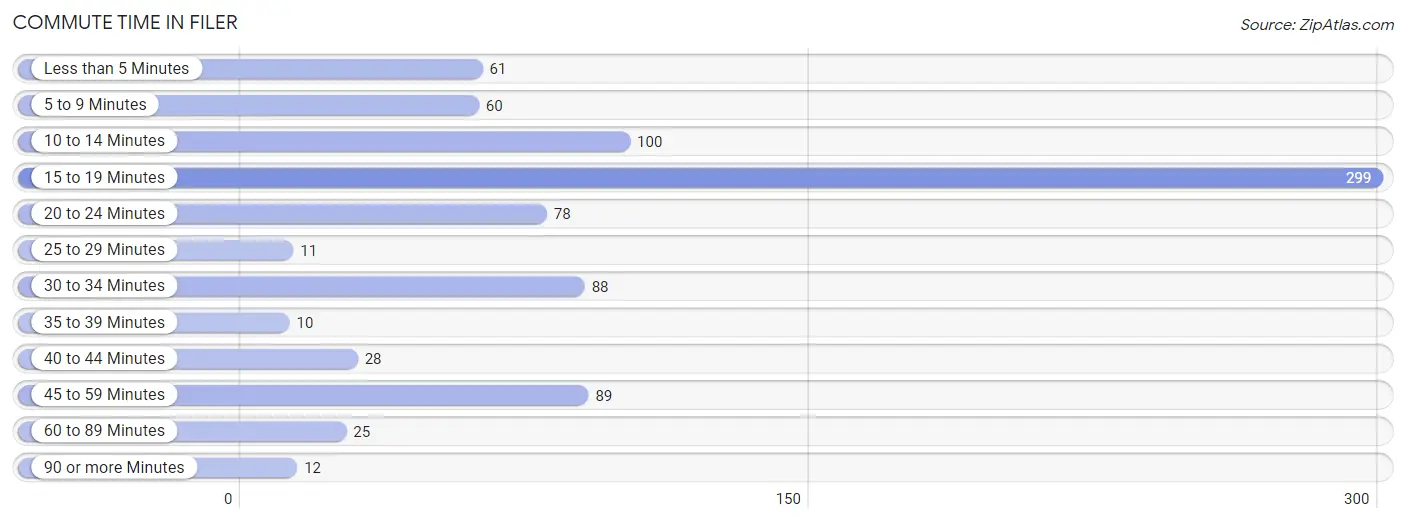
| Commute Time | # Commuters | % Commuters |
| Less than 5 Minutes | 61 | 7.1% |
| 5 to 9 Minutes | 60 | 7.0% |
| 10 to 14 Minutes | 100 | 11.6% |
| 15 to 19 Minutes | 299 | 34.7% |
| 20 to 24 Minutes | 78 | 9.1% |
| 25 to 29 Minutes | 11 | 1.3% |
| 30 to 34 Minutes | 88 | 10.2% |
| 35 to 39 Minutes | 10 | 1.2% |
| 40 to 44 Minutes | 28 | 3.3% |
| 45 to 59 Minutes | 89 | 10.3% |
| 60 to 89 Minutes | 25 | 2.9% |
| 90 or more Minutes | 12 | 1.4% |
Commute Time by Sex in Filer
The most common commute times in Filer are 15 to 19 minutes (167 commuters, 31.6%) for males and 15 to 19 minutes (132 commuters, 39.6%) for females.
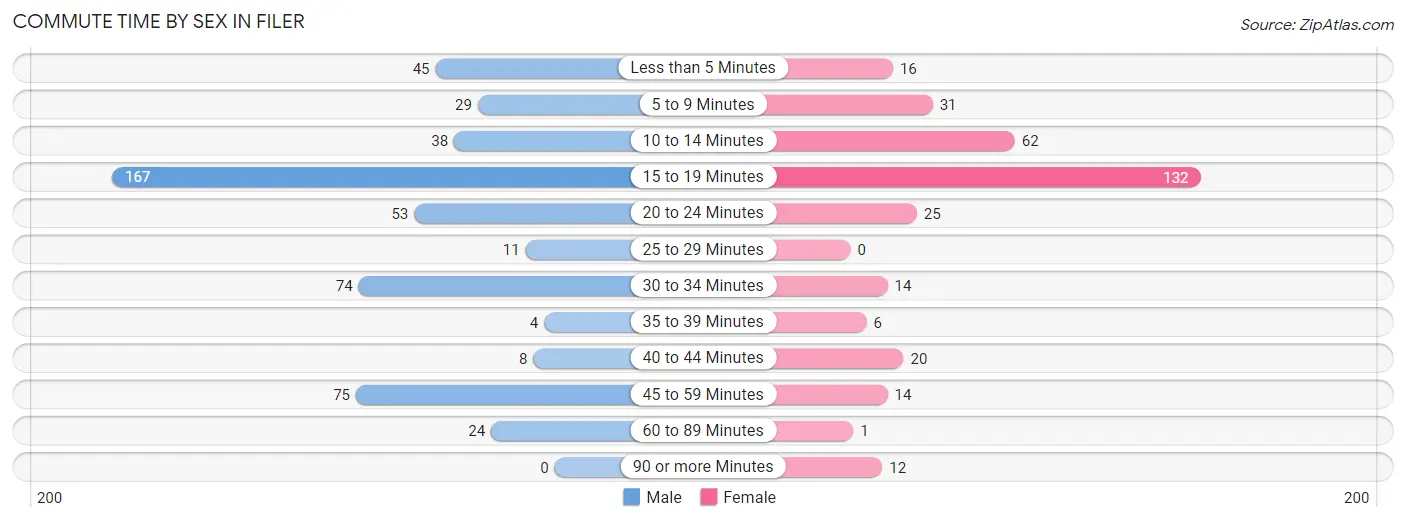
| Commute Time | Male | Female |
| Less than 5 Minutes | 45 (8.5%) | 16 (4.8%) |
| 5 to 9 Minutes | 29 (5.5%) | 31 (9.3%) |
| 10 to 14 Minutes | 38 (7.2%) | 62 (18.6%) |
| 15 to 19 Minutes | 167 (31.6%) | 132 (39.6%) |
| 20 to 24 Minutes | 53 (10.0%) | 25 (7.5%) |
| 25 to 29 Minutes | 11 (2.1%) | 0 (0.0%) |
| 30 to 34 Minutes | 74 (14.0%) | 14 (4.2%) |
| 35 to 39 Minutes | 4 (0.8%) | 6 (1.8%) |
| 40 to 44 Minutes | 8 (1.5%) | 20 (6.0%) |
| 45 to 59 Minutes | 75 (14.2%) | 14 (4.2%) |
| 60 to 89 Minutes | 24 (4.5%) | 1 (0.3%) |
| 90 or more Minutes | 0 (0.0%) | 12 (3.6%) |
Time of Departure to Work by Sex in Filer
The most frequent times of departure to work in Filer are 7:30 AM to 7:59 AM (105, 19.9%) for males and 7:30 AM to 7:59 AM (67, 20.1%) for females.
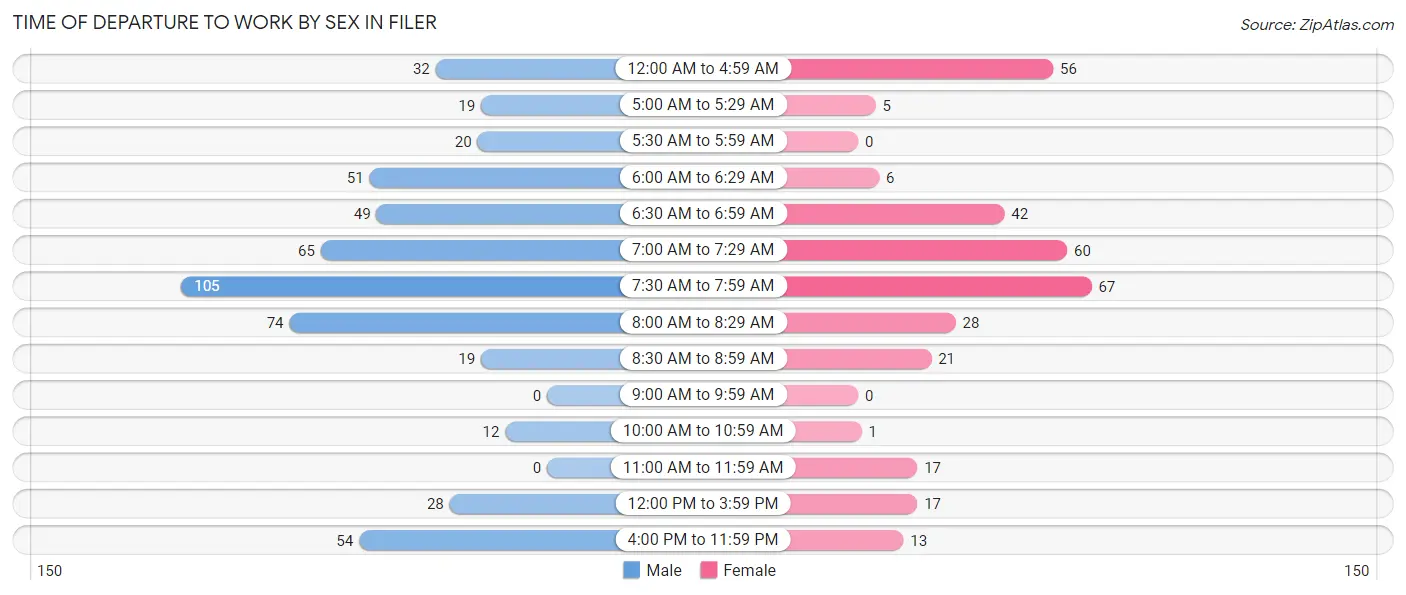
| Time of Departure | Male | Female |
| 12:00 AM to 4:59 AM | 32 (6.1%) | 56 (16.8%) |
| 5:00 AM to 5:29 AM | 19 (3.6%) | 5 (1.5%) |
| 5:30 AM to 5:59 AM | 20 (3.8%) | 0 (0.0%) |
| 6:00 AM to 6:29 AM | 51 (9.7%) | 6 (1.8%) |
| 6:30 AM to 6:59 AM | 49 (9.3%) | 42 (12.6%) |
| 7:00 AM to 7:29 AM | 65 (12.3%) | 60 (18.0%) |
| 7:30 AM to 7:59 AM | 105 (19.9%) | 67 (20.1%) |
| 8:00 AM to 8:29 AM | 74 (14.0%) | 28 (8.4%) |
| 8:30 AM to 8:59 AM | 19 (3.6%) | 21 (6.3%) |
| 9:00 AM to 9:59 AM | 0 (0.0%) | 0 (0.0%) |
| 10:00 AM to 10:59 AM | 12 (2.3%) | 1 (0.3%) |
| 11:00 AM to 11:59 AM | 0 (0.0%) | 17 (5.1%) |
| 12:00 PM to 3:59 PM | 28 (5.3%) | 17 (5.1%) |
| 4:00 PM to 11:59 PM | 54 (10.2%) | 13 (3.9%) |
| Total | 528 (100.0%) | 333 (100.0%) |
Housing Occupancy in Filer
Occupancy by Ownership in Filer
Of the total 1,014 dwellings in Filer, owner-occupied units account for 714 (70.4%), while renter-occupied units make up 300 (29.6%).
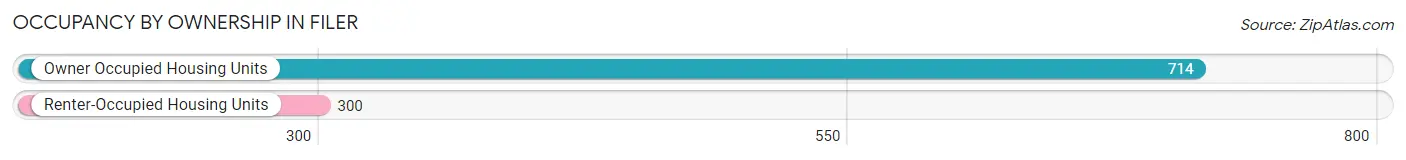
| Occupancy | # Housing Units | % Housing Units |
| Owner Occupied Housing Units | 714 | 70.4% |
| Renter-Occupied Housing Units | 300 | 29.6% |
| Total Occupied Housing Units | 1,014 | 100.0% |
Occupancy by Household Size in Filer
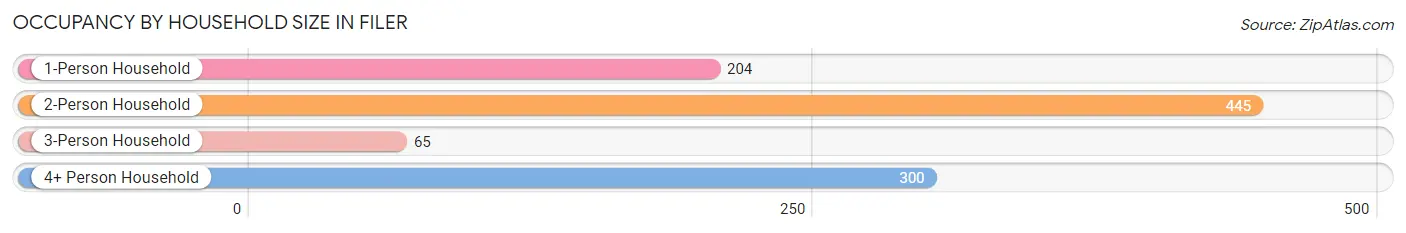
| Household Size | # Housing Units | % Housing Units |
| 1-Person Household | 204 | 20.1% |
| 2-Person Household | 445 | 43.9% |
| 3-Person Household | 65 | 6.4% |
| 4+ Person Household | 300 | 29.6% |
| Total Housing Units | 1,014 | 100.0% |
Occupancy by Ownership by Household Size in Filer
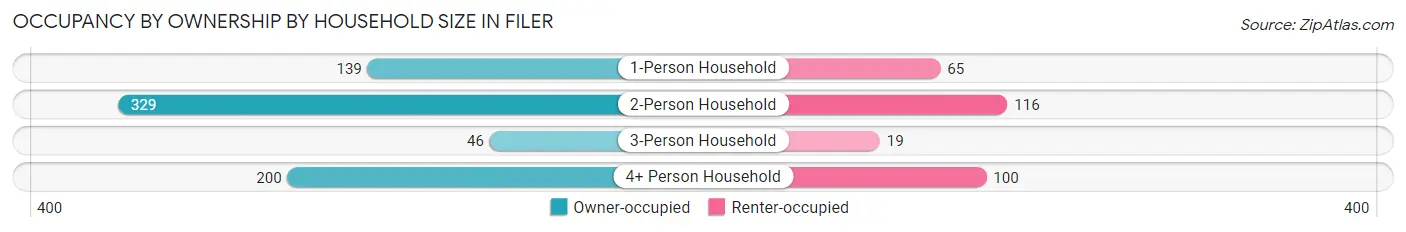
| Household Size | Owner-occupied | Renter-occupied |
| 1-Person Household | 139 (68.1%) | 65 (31.9%) |
| 2-Person Household | 329 (73.9%) | 116 (26.1%) |
| 3-Person Household | 46 (70.8%) | 19 (29.2%) |
| 4+ Person Household | 200 (66.7%) | 100 (33.3%) |
| Total Housing Units | 714 (70.4%) | 300 (29.6%) |
Occupancy by Educational Attainment in Filer
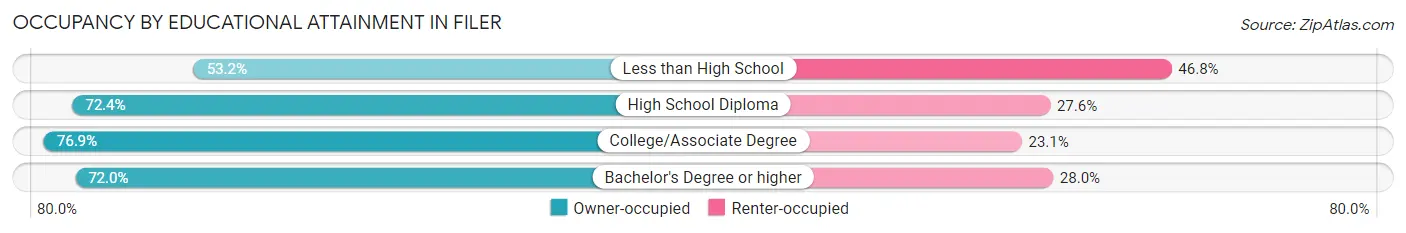
| Household Size | Owner-occupied | Renter-occupied |
| Less than High School | 109 (53.2%) | 96 (46.8%) |
| High School Diploma | 155 (72.4%) | 59 (27.6%) |
| College/Associate Degree | 337 (76.9%) | 101 (23.1%) |
| Bachelor's Degree or higher | 113 (72.0%) | 44 (28.0%) |
Occupancy by Age of Householder in Filer
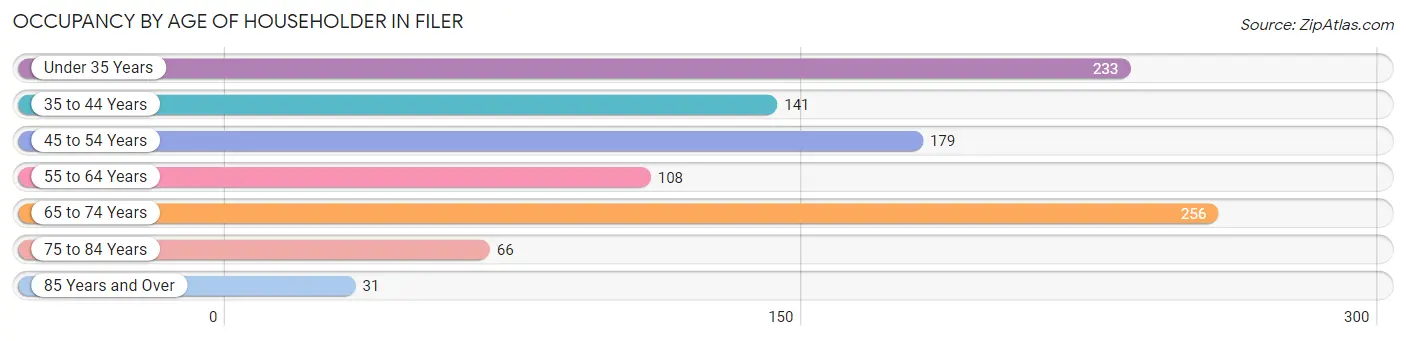
| Age Bracket | # Households | % Households |
| Under 35 Years | 233 | 23.0% |
| 35 to 44 Years | 141 | 13.9% |
| 45 to 54 Years | 179 | 17.6% |
| 55 to 64 Years | 108 | 10.6% |
| 65 to 74 Years | 256 | 25.3% |
| 75 to 84 Years | 66 | 6.5% |
| 85 Years and Over | 31 | 3.1% |
| Total | 1,014 | 100.0% |
Housing Finances in Filer
Median Income by Occupancy in Filer
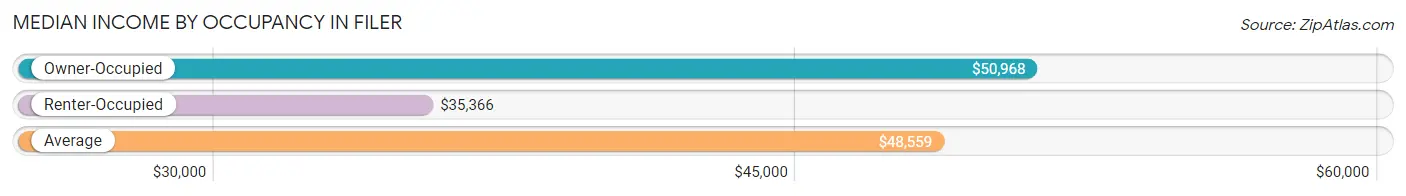
| Occupancy Type | # Households | Median Income |
| Owner-Occupied | 714 (70.4%) | $50,968 |
| Renter-Occupied | 300 (29.6%) | $35,366 |
| Average | 1,014 (100.0%) | $48,559 |
Occupancy by Householder Income Bracket in Filer
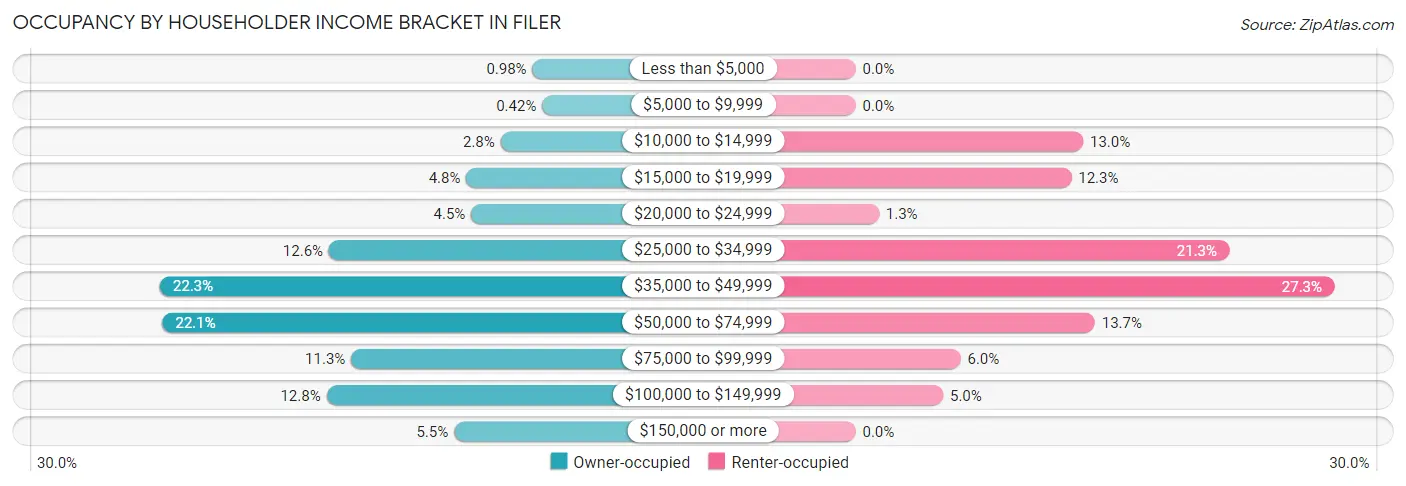
| Income Bracket | Owner-occupied | Renter-occupied |
| Less than $5,000 | 7 (1.0%) | 0 (0.0%) |
| $5,000 to $9,999 | 3 (0.4%) | 0 (0.0%) |
| $10,000 to $14,999 | 20 (2.8%) | 39 (13.0%) |
| $15,000 to $19,999 | 34 (4.8%) | 37 (12.3%) |
| $20,000 to $24,999 | 32 (4.5%) | 4 (1.3%) |
| $25,000 to $34,999 | 90 (12.6%) | 64 (21.3%) |
| $35,000 to $49,999 | 159 (22.3%) | 82 (27.3%) |
| $50,000 to $74,999 | 158 (22.1%) | 41 (13.7%) |
| $75,000 to $99,999 | 81 (11.3%) | 18 (6.0%) |
| $100,000 to $149,999 | 91 (12.8%) | 15 (5.0%) |
| $150,000 or more | 39 (5.5%) | 0 (0.0%) |
| Total | 714 (100.0%) | 300 (100.0%) |
Monthly Housing Cost Tiers in Filer
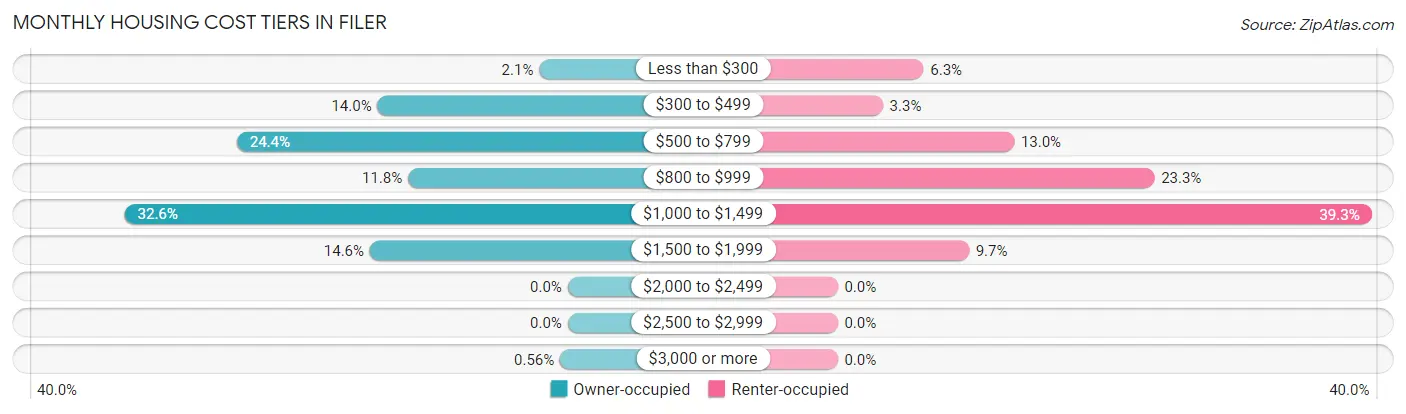
| Monthly Cost | Owner-occupied | Renter-occupied |
| Less than $300 | 15 (2.1%) | 19 (6.3%) |
| $300 to $499 | 100 (14.0%) | 10 (3.3%) |
| $500 to $799 | 174 (24.4%) | 39 (13.0%) |
| $800 to $999 | 84 (11.8%) | 70 (23.3%) |
| $1,000 to $1,499 | 233 (32.6%) | 118 (39.3%) |
| $1,500 to $1,999 | 104 (14.6%) | 29 (9.7%) |
| $2,000 to $2,499 | 0 (0.0%) | 0 (0.0%) |
| $2,500 to $2,999 | 0 (0.0%) | 0 (0.0%) |
| $3,000 or more | 4 (0.6%) | 0 (0.0%) |
| Total | 714 (100.0%) | 300 (100.0%) |
Physical Housing Characteristics in Filer
Housing Structures in Filer
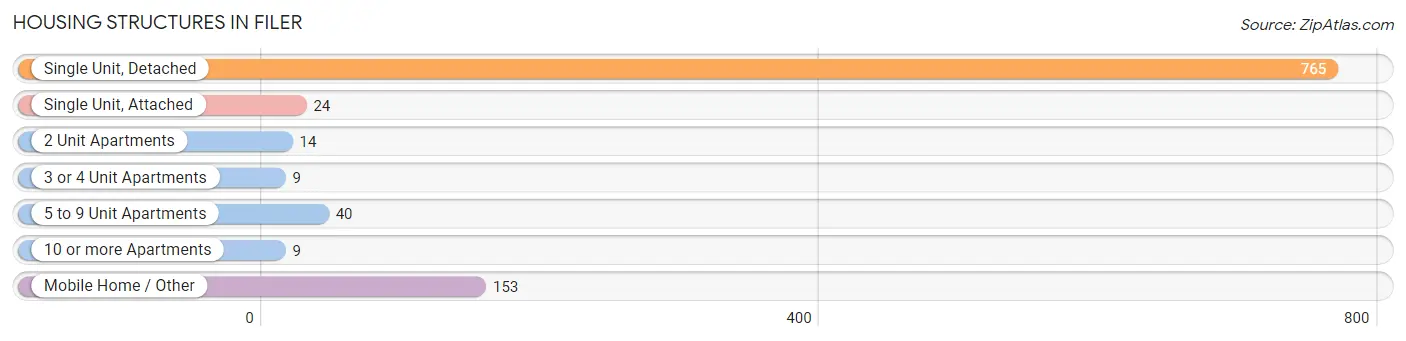
| Structure Type | # Housing Units | % Housing Units |
| Single Unit, Detached | 765 | 75.4% |
| Single Unit, Attached | 24 | 2.4% |
| 2 Unit Apartments | 14 | 1.4% |
| 3 or 4 Unit Apartments | 9 | 0.9% |
| 5 to 9 Unit Apartments | 40 | 3.9% |
| 10 or more Apartments | 9 | 0.9% |
| Mobile Home / Other | 153 | 15.1% |
| Total | 1,014 | 100.0% |
Housing Structures by Occupancy in Filer
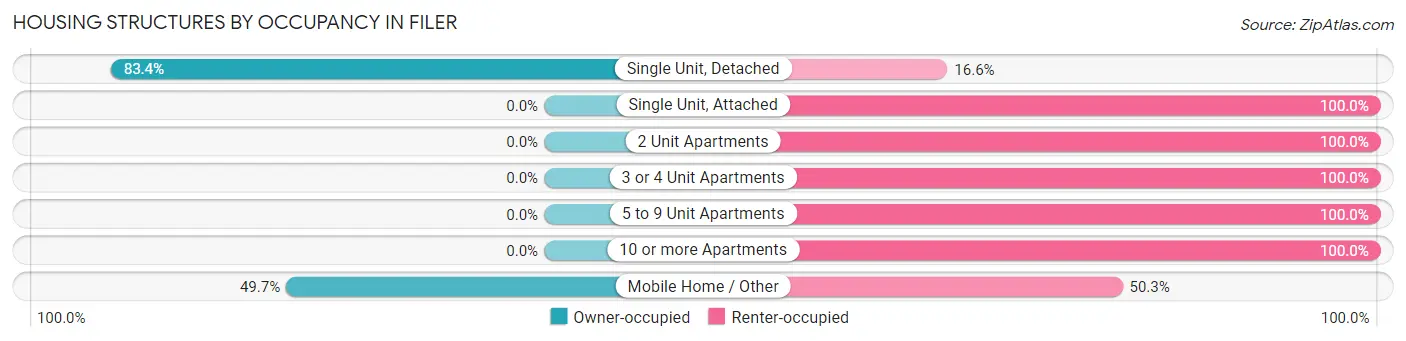
| Structure Type | Owner-occupied | Renter-occupied |
| Single Unit, Detached | 638 (83.4%) | 127 (16.6%) |
| Single Unit, Attached | 0 (0.0%) | 24 (100.0%) |
| 2 Unit Apartments | 0 (0.0%) | 14 (100.0%) |
| 3 or 4 Unit Apartments | 0 (0.0%) | 9 (100.0%) |
| 5 to 9 Unit Apartments | 0 (0.0%) | 40 (100.0%) |
| 10 or more Apartments | 0 (0.0%) | 9 (100.0%) |
| Mobile Home / Other | 76 (49.7%) | 77 (50.3%) |
| Total | 714 (70.4%) | 300 (29.6%) |
Housing Structures by Number of Rooms in Filer
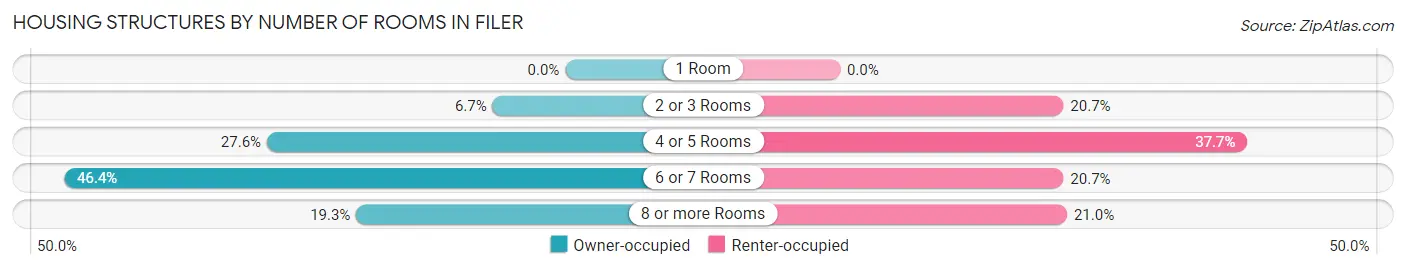
| Number of Rooms | Owner-occupied | Renter-occupied |
| 1 Room | 0 (0.0%) | 0 (0.0%) |
| 2 or 3 Rooms | 48 (6.7%) | 62 (20.7%) |
| 4 or 5 Rooms | 197 (27.6%) | 113 (37.7%) |
| 6 or 7 Rooms | 331 (46.4%) | 62 (20.7%) |
| 8 or more Rooms | 138 (19.3%) | 63 (21.0%) |
| Total | 714 (100.0%) | 300 (100.0%) |
Housing Structure by Heating Type in Filer
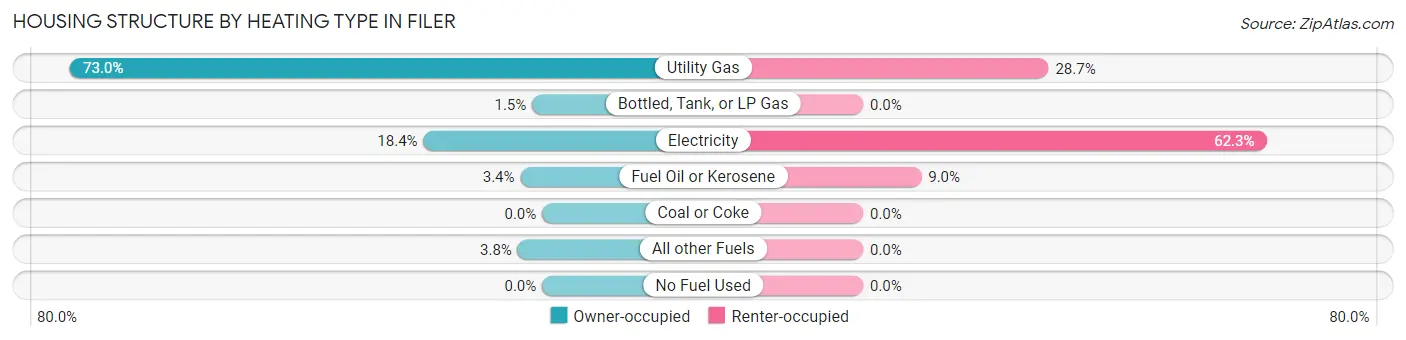
| Heating Type | Owner-occupied | Renter-occupied |
| Utility Gas | 521 (73.0%) | 86 (28.7%) |
| Bottled, Tank, or LP Gas | 11 (1.5%) | 0 (0.0%) |
| Electricity | 131 (18.3%) | 187 (62.3%) |
| Fuel Oil or Kerosene | 24 (3.4%) | 27 (9.0%) |
| Coal or Coke | 0 (0.0%) | 0 (0.0%) |
| All other Fuels | 27 (3.8%) | 0 (0.0%) |
| No Fuel Used | 0 (0.0%) | 0 (0.0%) |
| Total | 714 (100.0%) | 300 (100.0%) |
Household Vehicle Usage in Filer
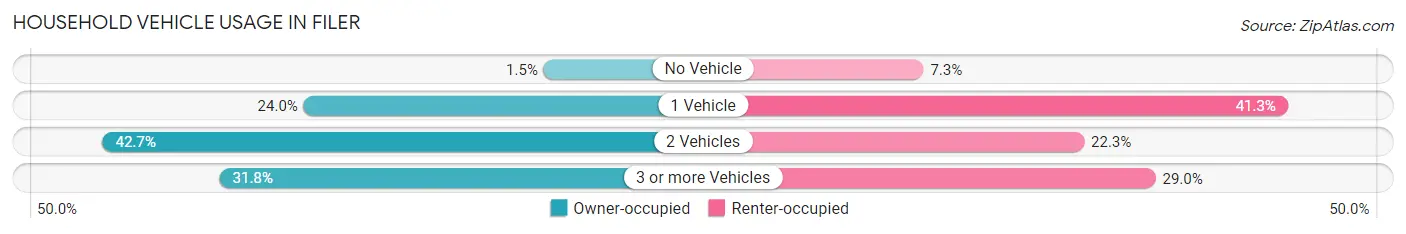
| Vehicles per Household | Owner-occupied | Renter-occupied |
| No Vehicle | 11 (1.5%) | 22 (7.3%) |
| 1 Vehicle | 171 (23.9%) | 124 (41.3%) |
| 2 Vehicles | 305 (42.7%) | 67 (22.3%) |
| 3 or more Vehicles | 227 (31.8%) | 87 (29.0%) |
| Total | 714 (100.0%) | 300 (100.0%) |
Real Estate & Mortgages in Filer
Real Estate and Mortgage Overview in Filer
| Characteristic | Without Mortgage | With Mortgage |
| Housing Units | 205 | 509 |
| Median Property Value | $179,000 | $206,300 |
| Median Household Income | $38,583 | $39 |
| Monthly Housing Costs | $478 | $4 |
| Real Estate Taxes | $1,520 | $31 |
Property Value by Mortgage Status in Filer
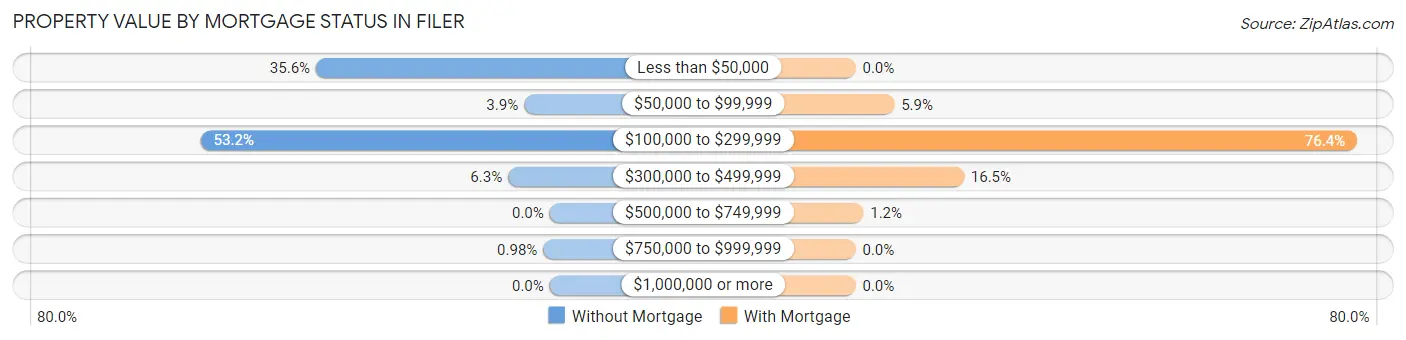
| Property Value | Without Mortgage | With Mortgage |
| Less than $50,000 | 73 (35.6%) | 0 (0.0%) |
| $50,000 to $99,999 | 8 (3.9%) | 30 (5.9%) |
| $100,000 to $299,999 | 109 (53.2%) | 389 (76.4%) |
| $300,000 to $499,999 | 13 (6.3%) | 84 (16.5%) |
| $500,000 to $749,999 | 0 (0.0%) | 6 (1.2%) |
| $750,000 to $999,999 | 2 (1.0%) | 0 (0.0%) |
| $1,000,000 or more | 0 (0.0%) | 0 (0.0%) |
| Total | 205 (100.0%) | 509 (100.0%) |
Household Income by Mortgage Status in Filer
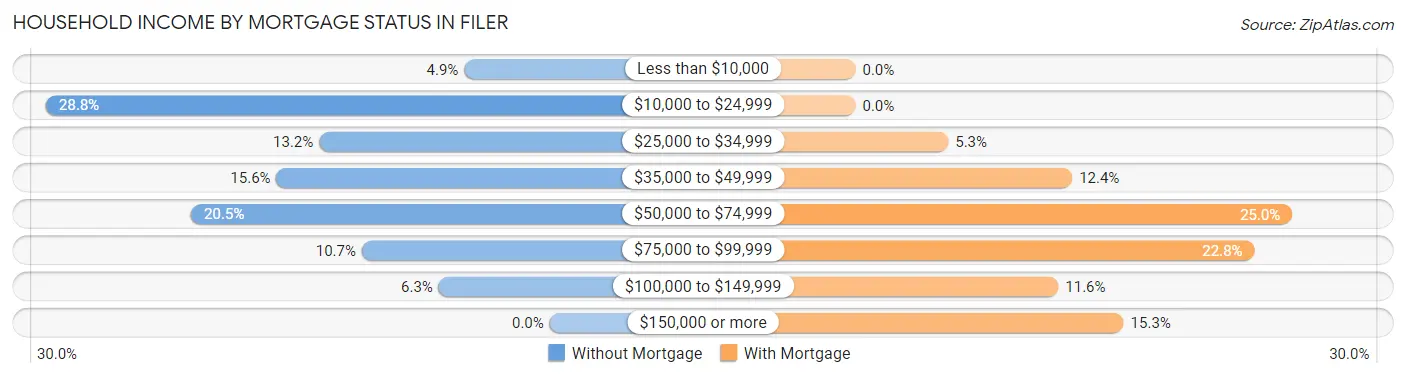
| Household Income | Without Mortgage | With Mortgage |
| Less than $10,000 | 10 (4.9%) | 0 (0.0%) |
| $10,000 to $24,999 | 59 (28.8%) | 0 (0.0%) |
| $25,000 to $34,999 | 27 (13.2%) | 27 (5.3%) |
| $35,000 to $49,999 | 32 (15.6%) | 63 (12.4%) |
| $50,000 to $74,999 | 42 (20.5%) | 127 (24.9%) |
| $75,000 to $99,999 | 22 (10.7%) | 116 (22.8%) |
| $100,000 to $149,999 | 13 (6.3%) | 59 (11.6%) |
| $150,000 or more | 0 (0.0%) | 78 (15.3%) |
| Total | 205 (100.0%) | 509 (100.0%) |
Property Value to Household Income Ratio in Filer
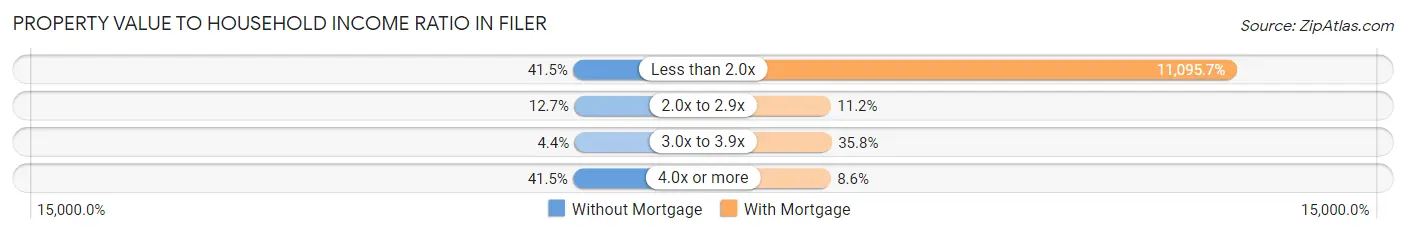
| Value-to-Income Ratio | Without Mortgage | With Mortgage |
| Less than 2.0x | 85 (41.5%) | 56,477 (11,095.7%) |
| 2.0x to 2.9x | 26 (12.7%) | 57 (11.2%) |
| 3.0x to 3.9x | 9 (4.4%) | 182 (35.8%) |
| 4.0x or more | 85 (41.5%) | 44 (8.6%) |
| Total | 205 (100.0%) | 509 (100.0%) |
Real Estate Taxes by Mortgage Status in Filer
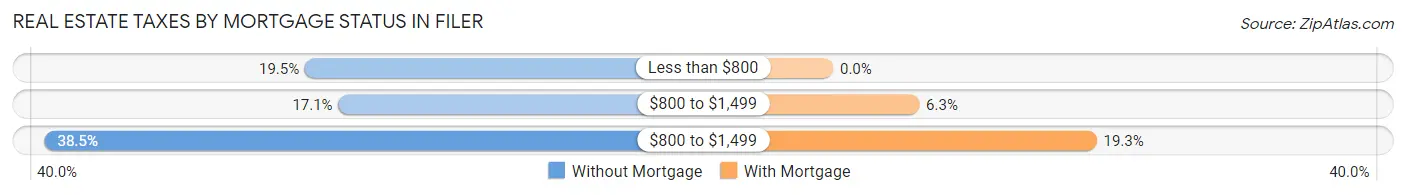
| Property Taxes | Without Mortgage | With Mortgage |
| Less than $800 | 40 (19.5%) | 0 (0.0%) |
| $800 to $1,499 | 35 (17.1%) | 32 (6.3%) |
| $800 to $1,499 | 79 (38.5%) | 98 (19.3%) |
| Total | 205 (100.0%) | 509 (100.0%) |
Health & Disability in Filer
Health Insurance Coverage by Age in Filer
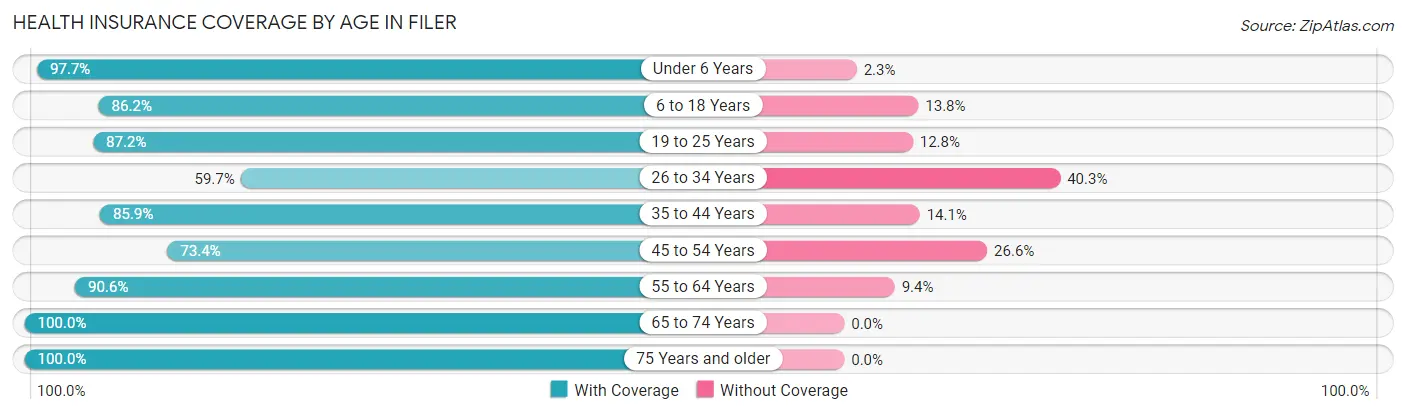
| Age Bracket | With Coverage | Without Coverage |
| Under 6 Years | 338 (97.7%) | 8 (2.3%) |
| 6 to 18 Years | 543 (86.2%) | 87 (13.8%) |
| 19 to 25 Years | 232 (87.2%) | 34 (12.8%) |
| 26 to 34 Years | 178 (59.7%) | 120 (40.3%) |
| 35 to 44 Years | 220 (85.9%) | 36 (14.1%) |
| 45 to 54 Years | 179 (73.4%) | 65 (26.6%) |
| 55 to 64 Years | 183 (90.6%) | 19 (9.4%) |
| 65 to 74 Years | 397 (100.0%) | 0 (0.0%) |
| 75 Years and older | 127 (100.0%) | 0 (0.0%) |
| Total | 2,397 (86.7%) | 369 (13.3%) |
Health Insurance Coverage by Citizenship Status in Filer
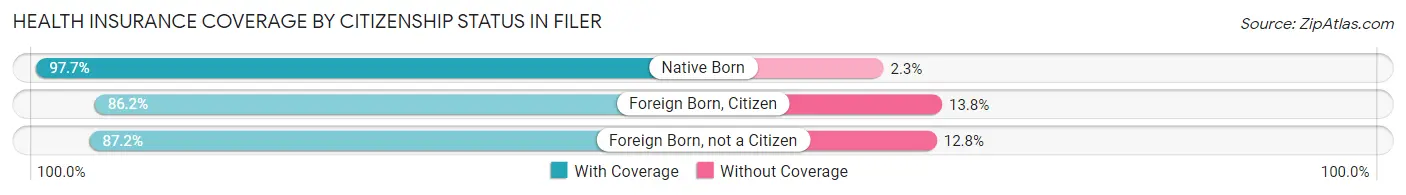
| Citizenship Status | With Coverage | Without Coverage |
| Native Born | 338 (97.7%) | 8 (2.3%) |
| Foreign Born, Citizen | 543 (86.2%) | 87 (13.8%) |
| Foreign Born, not a Citizen | 232 (87.2%) | 34 (12.8%) |
Health Insurance Coverage by Household Income in Filer
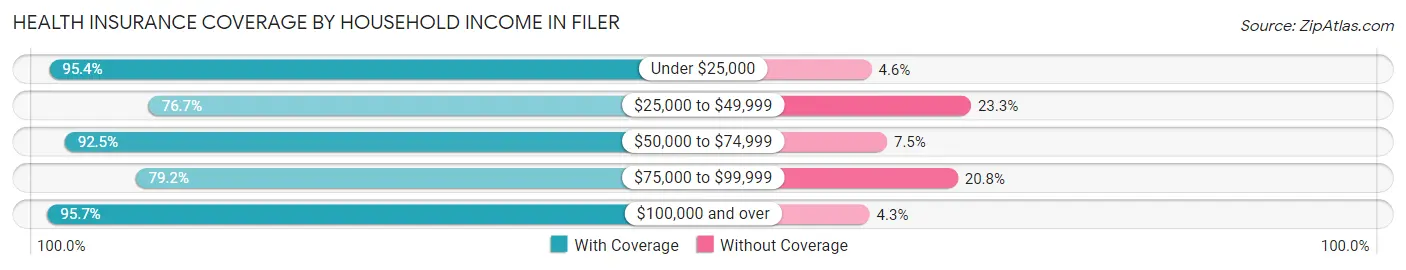
| Household Income | With Coverage | Without Coverage |
| Under $25,000 | 268 (95.4%) | 13 (4.6%) |
| $25,000 to $49,999 | 689 (76.7%) | 209 (23.3%) |
| $50,000 to $74,999 | 576 (92.5%) | 47 (7.5%) |
| $75,000 to $99,999 | 282 (79.2%) | 74 (20.8%) |
| $100,000 and over | 582 (95.7%) | 26 (4.3%) |
Public vs Private Health Insurance Coverage by Age in Filer
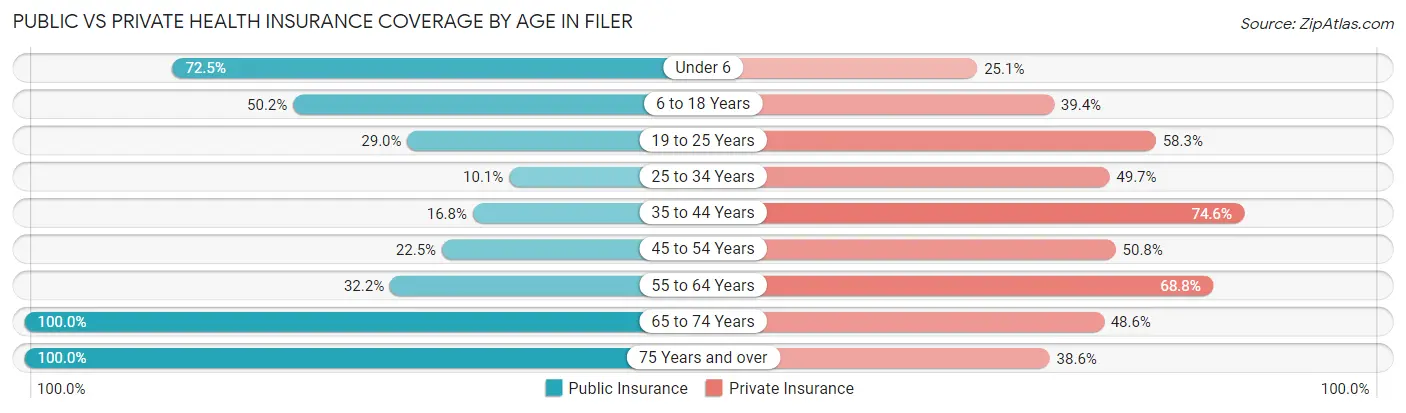
| Age Bracket | Public Insurance | Private Insurance |
| Under 6 | 251 (72.5%) | 87 (25.1%) |
| 6 to 18 Years | 316 (50.2%) | 248 (39.4%) |
| 19 to 25 Years | 77 (28.9%) | 155 (58.3%) |
| 25 to 34 Years | 30 (10.1%) | 148 (49.7%) |
| 35 to 44 Years | 43 (16.8%) | 191 (74.6%) |
| 45 to 54 Years | 55 (22.5%) | 124 (50.8%) |
| 55 to 64 Years | 65 (32.2%) | 139 (68.8%) |
| 65 to 74 Years | 397 (100.0%) | 193 (48.6%) |
| 75 Years and over | 127 (100.0%) | 49 (38.6%) |
| Total | 1,361 (49.2%) | 1,334 (48.2%) |
Disability Status by Sex by Age in Filer
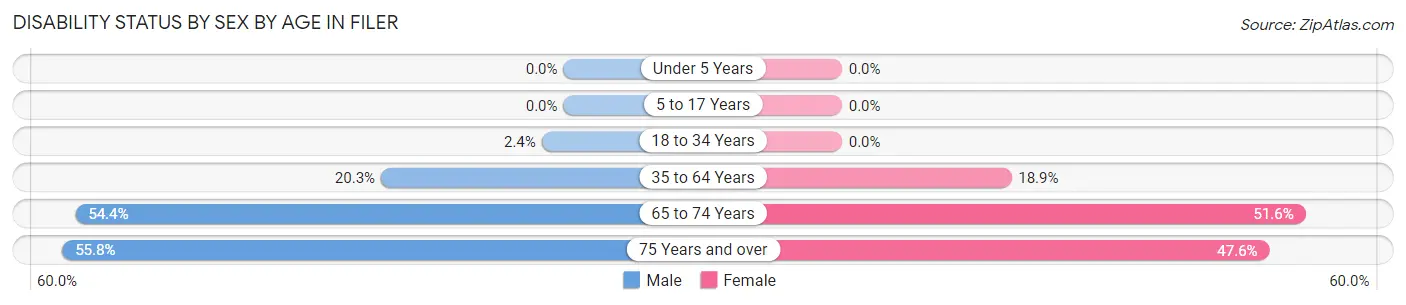
| Age Bracket | Male | Female |
| Under 5 Years | 0 (0.0%) | 0 (0.0%) |
| 5 to 17 Years | 0 (0.0%) | 0 (0.0%) |
| 18 to 34 Years | 7 (2.4%) | 0 (0.0%) |
| 35 to 64 Years | 63 (20.3%) | 74 (18.9%) |
| 65 to 74 Years | 100 (54.3%) | 110 (51.6%) |
| 75 Years and over | 24 (55.8%) | 40 (47.6%) |
Disability Class by Sex by Age in Filer
Disability Class: Hearing Difficulty
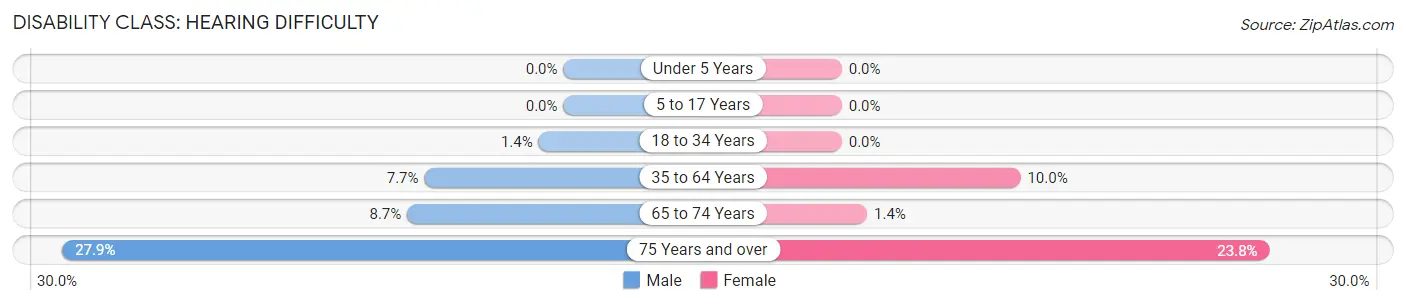
| Age Bracket | Male | Female |
| Under 5 Years | 0 (0.0%) | 0 (0.0%) |
| 5 to 17 Years | 0 (0.0%) | 0 (0.0%) |
| 18 to 34 Years | 4 (1.4%) | 0 (0.0%) |
| 35 to 64 Years | 24 (7.7%) | 39 (10.0%) |
| 65 to 74 Years | 16 (8.7%) | 3 (1.4%) |
| 75 Years and over | 12 (27.9%) | 20 (23.8%) |
Disability Class: Vision Difficulty
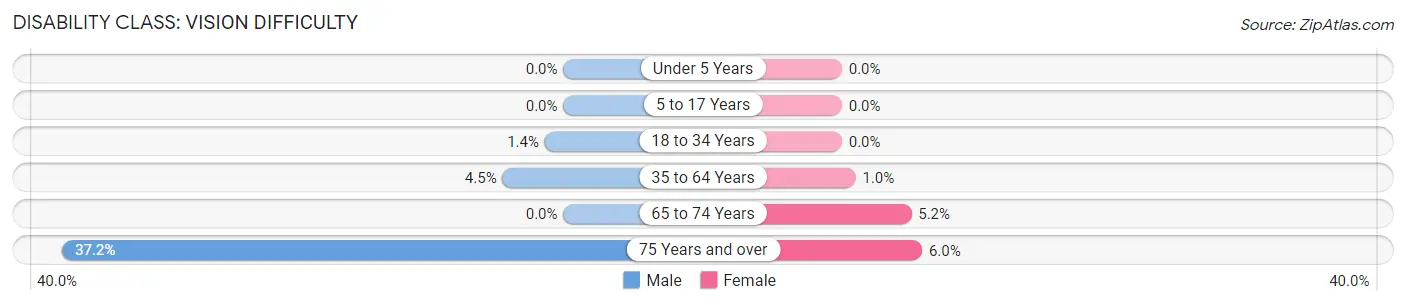
| Age Bracket | Male | Female |
| Under 5 Years | 0 (0.0%) | 0 (0.0%) |
| 5 to 17 Years | 0 (0.0%) | 0 (0.0%) |
| 18 to 34 Years | 4 (1.4%) | 0 (0.0%) |
| 35 to 64 Years | 14 (4.5%) | 4 (1.0%) |
| 65 to 74 Years | 0 (0.0%) | 11 (5.2%) |
| 75 Years and over | 16 (37.2%) | 5 (5.9%) |
Disability Class: Cognitive Difficulty
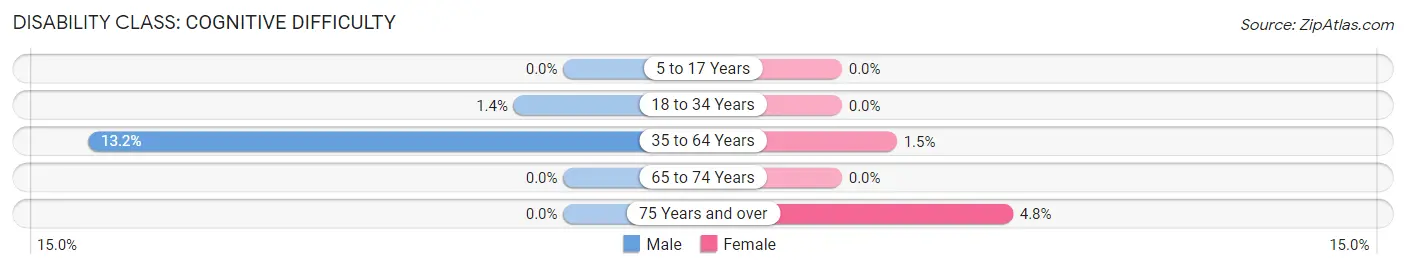
| Age Bracket | Male | Female |
| 5 to 17 Years | 0 (0.0%) | 0 (0.0%) |
| 18 to 34 Years | 4 (1.4%) | 0 (0.0%) |
| 35 to 64 Years | 41 (13.2%) | 6 (1.5%) |
| 65 to 74 Years | 0 (0.0%) | 0 (0.0%) |
| 75 Years and over | 0 (0.0%) | 4 (4.8%) |
Disability Class: Ambulatory Difficulty
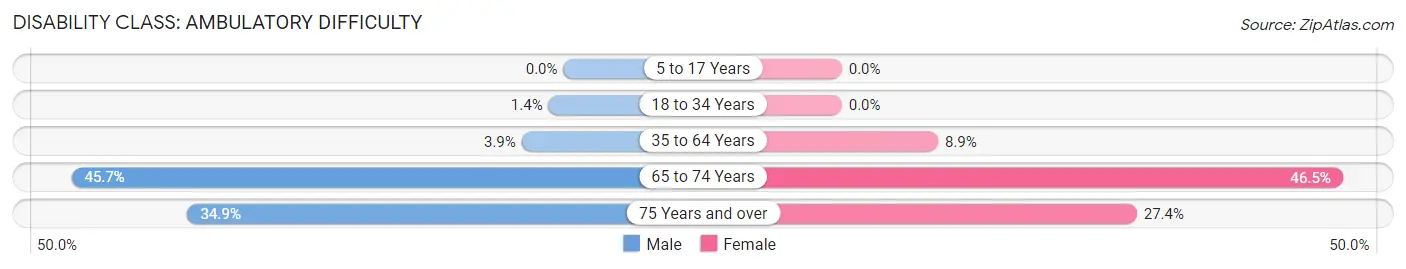
| Age Bracket | Male | Female |
| 5 to 17 Years | 0 (0.0%) | 0 (0.0%) |
| 18 to 34 Years | 4 (1.4%) | 0 (0.0%) |
| 35 to 64 Years | 12 (3.9%) | 35 (8.9%) |
| 65 to 74 Years | 84 (45.7%) | 99 (46.5%) |
| 75 Years and over | 15 (34.9%) | 23 (27.4%) |
Disability Class: Self-Care Difficulty
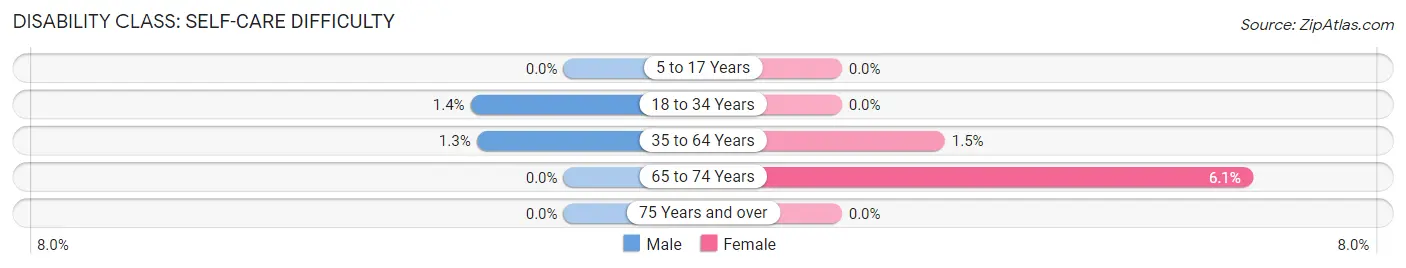
| Age Bracket | Male | Female |
| 5 to 17 Years | 0 (0.0%) | 0 (0.0%) |
| 18 to 34 Years | 4 (1.4%) | 0 (0.0%) |
| 35 to 64 Years | 4 (1.3%) | 6 (1.5%) |
| 65 to 74 Years | 0 (0.0%) | 13 (6.1%) |
| 75 Years and over | 0 (0.0%) | 0 (0.0%) |
Technology Access in Filer
Computing Device Access in Filer
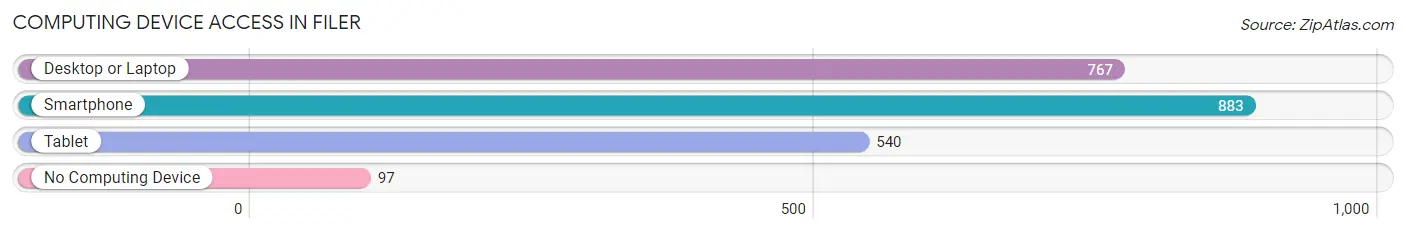
| Device Type | # Households | % Households |
| Desktop or Laptop | 767 | 75.6% |
| Smartphone | 883 | 87.1% |
| Tablet | 540 | 53.2% |
| No Computing Device | 97 | 9.6% |
| Total | 1,014 | 100.0% |
Internet Access in Filer
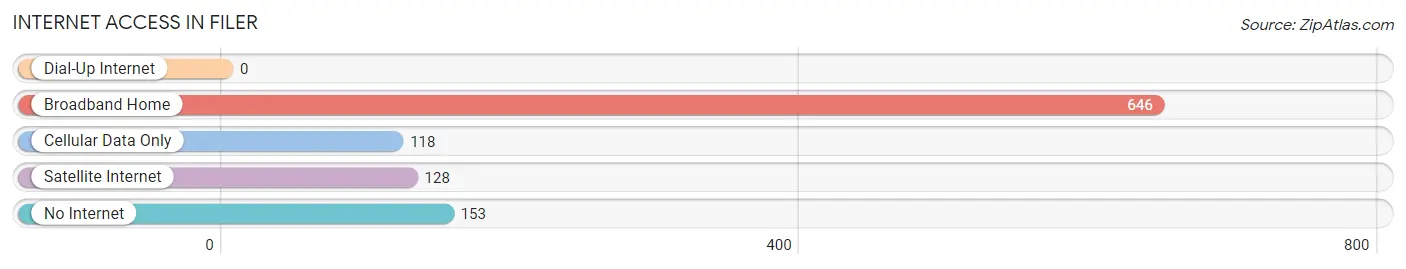
| Internet Type | # Households | % Households |
| Dial-Up Internet | 0 | 0.0% |
| Broadband Home | 646 | 63.7% |
| Cellular Data Only | 118 | 11.6% |
| Satellite Internet | 128 | 12.6% |
| No Internet | 153 | 15.1% |
| Total | 1,014 | 100.0% |
Filer Summary
History
Filer is a city located in Twin Falls County, Idaho. It is part of the Twin Falls, Idaho Metropolitan Statistical Area. The city was founded in 1884 by William Filer, a rancher and farmer who had moved to the area from Illinois. The city was originally known as Filer's Station, and was a stop on the Oregon Short Line Railroad. The city was incorporated in 1907.
Filer has a rich history of agriculture and ranching. The area was first settled by ranchers and farmers in the late 1800s, and the city was known for its production of hay, grain, and livestock. The city was also home to a number of dairies, which provided milk and other dairy products to the local population.
In the early 1900s, Filer was a major center for the lumber industry. The city was home to several sawmills, and the lumber produced in the area was used to build homes, barns, and other structures throughout the region.
Geography
Filer is located in the Snake River Plain, a region of south-central Idaho that is characterized by flat terrain and sparse vegetation. The city is situated at an elevation of 4,072 feet (1,241 m) above sea level. The city is located approximately 10 miles (16 km) south of Twin Falls, the county seat of Twin Falls County.
The city is located in a semi-arid climate, with hot summers and cold winters. The average annual precipitation is approximately 11 inches (279 mm). The average high temperature in July is 92°F (33°C), and the average low temperature in January is 22°F (-6°C).
Economy
Filer’s economy is largely based on agriculture and ranching. The city is home to several large farms and ranches, which produce hay, grain, and livestock. The city is also home to a number of dairies, which provide milk and other dairy products to the local population.
In addition to agriculture, Filer is home to a number of businesses, including a lumber mill, a furniture factory, and a number of retail stores. The city is also home to a number of restaurants, hotels, and other tourist attractions.
Demographics
As of the 2010 census, the population of Filer was 2,717. The racial makeup of the city was 91.2% White, 0.3% African American, 0.7% Native American, 0.3% Asian, 0.1% Pacific Islander, 5.2% from other races, and 2.3% from two or more races. Hispanic or Latino of any race were 11.2% of the population.
The median household income in Filer was $37,917, and the median family income was $45,938. The per capita income for the city was $17,945. About 11.2% of families and 14.2% of the population were below the poverty line, including 18.2% of those under age 18 and 8.2% of those age 65 or over.
Common Questions
What is Per Capita Income in Filer?
Per Capita income in Filer is $21,188.
What is the Median Family Income in Filer?
Median Family Income in Filer is $51,058.
What is the Median Household income in Filer?
Median Household Income in Filer is $48,559.
What is Income or Wage Gap in Filer?
Income or Wage Gap in Filer is 19.8%.
Women in Filer earn 80.2 cents for every dollar earned by a man.
What is Inequality or Gini Index in Filer?
Inequality or Gini Index in Filer is 0.36.
What is the Total Population of Filer?
Total Population of Filer is 2,766.
What is the Total Male Population of Filer?
Total Male Population of Filer is 1,289.
What is the Total Female Population of Filer?
Total Female Population of Filer is 1,477.
What is the Ratio of Males per 100 Females in Filer?
There are 87.27 Males per 100 Females in Filer.
What is the Ratio of Females per 100 Males in Filer?
There are 114.58 Females per 100 Males in Filer.
What is the Median Population Age in Filer?
Median Population Age in Filer is 30.2 Years.
What is the Average Family Size in Filer
Average Family Size in Filer is 3.1 People.
What is the Average Household Size in Filer
Average Household Size in Filer is 2.7 People.
How Large is the Labor Force in Filer?
There are 1,050 People in the Labor Forcein in Filer.
What is the Percentage of People in the Labor Force in Filer?
52.6% of People are in the Labor Force in Filer.
What is the Unemployment Rate in Filer?
Unemployment Rate in Filer is 3.3%.