Rupert, ID Map & Demographics
Rupert Map
Rupert Overview
$23,321
PER CAPITA INCOME
$66,684
AVG FAMILY INCOME
$53,348
AVG HOUSEHOLD INCOME
49.4%
WAGE / INCOME GAP [ % ]
50.6¢/ $1
WAGE / INCOME GAP [ $ ]
0.42
INEQUALITY / GINI INDEX
6,066
TOTAL POPULATION
3,173
MALE POPULATION
2,893
FEMALE POPULATION
109.68
MALES / 100 FEMALES
91.18
FEMALES / 100 MALES
34.1
MEDIAN AGE
3.5
AVG FAMILY SIZE
2.9
AVG HOUSEHOLD SIZE
2,933
LABOR FORCE [ PEOPLE ]
64.8%
PERCENT IN LABOR FORCE
2.9%
UNEMPLOYMENT RATE
Rupert Zip Codes
Rupert Area Codes
Income in Rupert
Income Overview in Rupert
Per Capita Income in Rupert is $23,321, while median incomes of families and households are $66,684 and $53,348 respectively.
| Characteristic | Number | Measure |
| Per Capita Income | 6,066 | $23,321 |
| Median Family Income | 1,472 | $66,684 |
| Mean Family Income | 1,472 | $74,326 |
| Median Household Income | 2,037 | $53,348 |
| Mean Household Income | 2,037 | $65,090 |
| Income Deficit | 1,472 | $0 |
| Wage / Income Gap (%) | 6,066 | 49.40% |
| Wage / Income Gap ($) | 6,066 | 50.60¢ per $1 |
| Gini / Inequality Index | 6,066 | 0.42 |
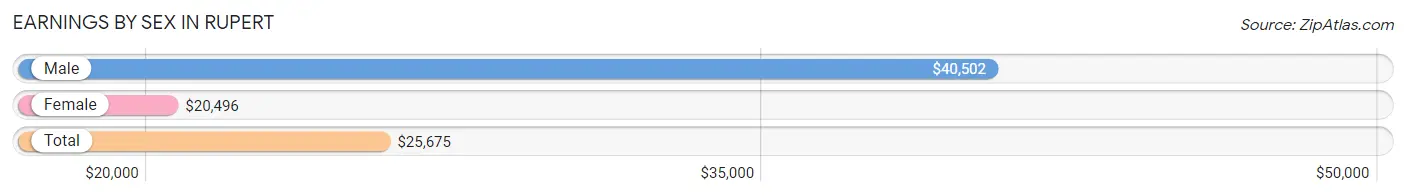
Earnings by Sex in Rupert
Average Earnings in Rupert are $25,675, $40,502 for men and $20,496 for women, a difference of 49.4%.
| Sex | Number | Average Earnings |
| Male | 1,657 (52.4%) | $40,502 |
| Female | 1,506 (47.6%) | $20,496 |
| Total | 3,163 (100.0%) | $25,675 |
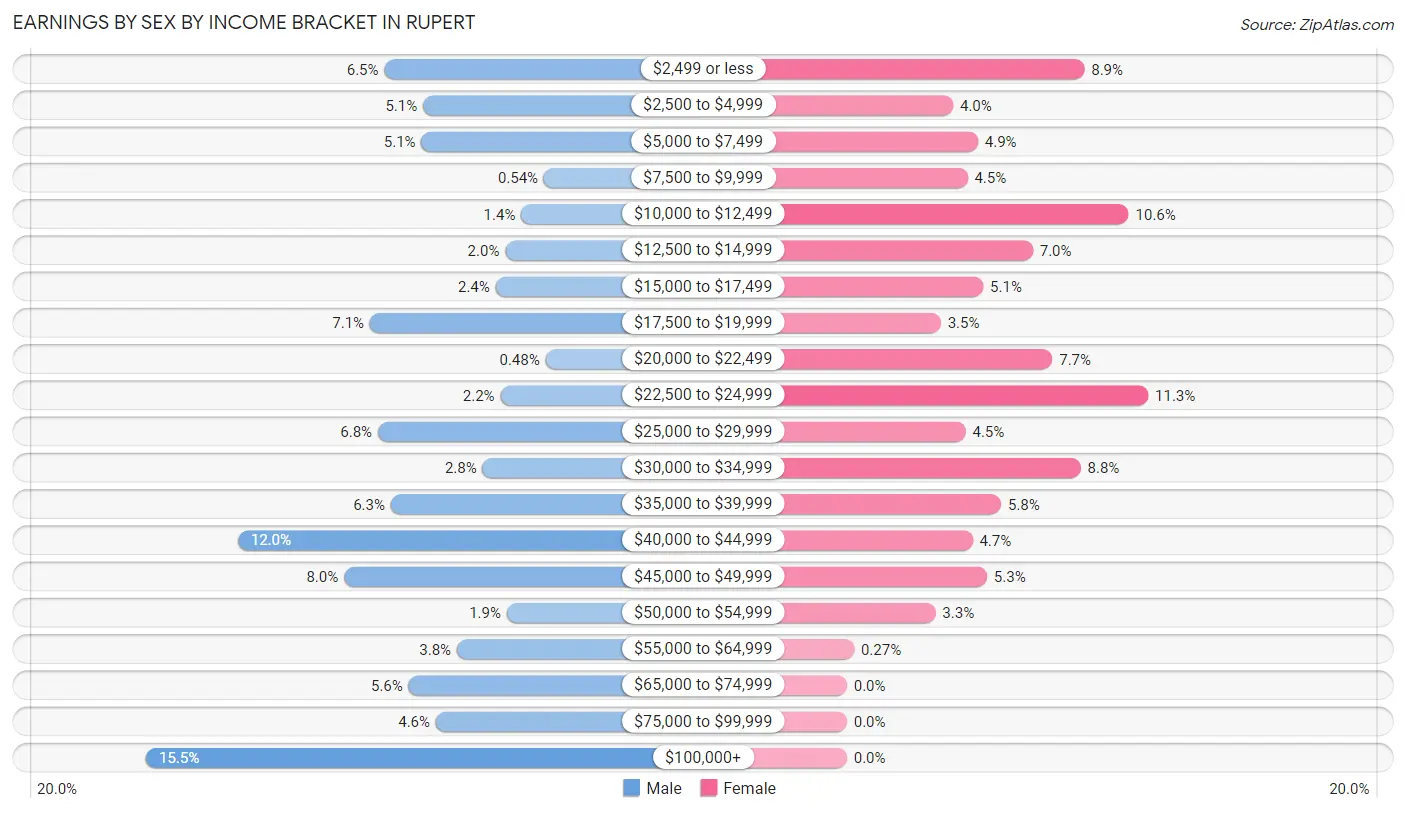
Earnings by Sex by Income Bracket in Rupert
The most common earnings brackets in Rupert are $100,000+ for men (256 | 15.4%) and $22,500 to $24,999 for women (170 | 11.3%).
| Income | Male | Female |
| $2,499 or less | 108 (6.5%) | 134 (8.9%) |
| $2,500 to $4,999 | 84 (5.1%) | 60 (4.0%) |
| $5,000 to $7,499 | 85 (5.1%) | 74 (4.9%) |
| $7,500 to $9,999 | 9 (0.5%) | 68 (4.5%) |
| $10,000 to $12,499 | 23 (1.4%) | 159 (10.6%) |
| $12,500 to $14,999 | 33 (2.0%) | 105 (7.0%) |
| $15,000 to $17,499 | 39 (2.4%) | 77 (5.1%) |
| $17,500 to $19,999 | 117 (7.1%) | 53 (3.5%) |
| $20,000 to $22,499 | 8 (0.5%) | 116 (7.7%) |
| $22,500 to $24,999 | 36 (2.2%) | 170 (11.3%) |
| $25,000 to $29,999 | 112 (6.8%) | 67 (4.4%) |
| $30,000 to $34,999 | 47 (2.8%) | 132 (8.8%) |
| $35,000 to $39,999 | 104 (6.3%) | 87 (5.8%) |
| $40,000 to $44,999 | 199 (12.0%) | 71 (4.7%) |
| $45,000 to $49,999 | 133 (8.0%) | 79 (5.2%) |
| $50,000 to $54,999 | 32 (1.9%) | 50 (3.3%) |
| $55,000 to $64,999 | 63 (3.8%) | 4 (0.3%) |
| $65,000 to $74,999 | 93 (5.6%) | 0 (0.0%) |
| $75,000 to $99,999 | 76 (4.6%) | 0 (0.0%) |
| $100,000+ | 256 (15.4%) | 0 (0.0%) |
| Total | 1,657 (100.0%) | 1,506 (100.0%) |
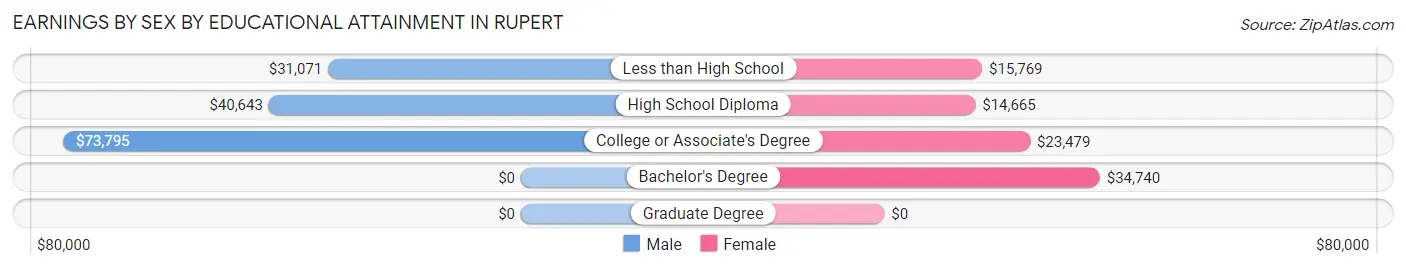
Earnings by Sex by Educational Attainment in Rupert
Average earnings in Rupert are $42,973 for men and $22,425 for women, a difference of 47.8%. Men with an educational attainment of college or associate's degree enjoy the highest average annual earnings of $73,795, while those with less than high school education earn the least with $31,071. Women with an educational attainment of bachelor's degree earn the most with the average annual earnings of $34,740, while those with high school diploma education have the smallest earnings of $14,665.
| Educational Attainment | Male Income | Female Income |
| Less than High School | $31,071 | $15,769 |
| High School Diploma | $40,643 | $14,665 |
| College or Associate's Degree | $73,795 | $23,479 |
| Bachelor's Degree | - | - |
| Graduate Degree | - | - |
| Total | $42,973 | $22,425 |
Family Income in Rupert
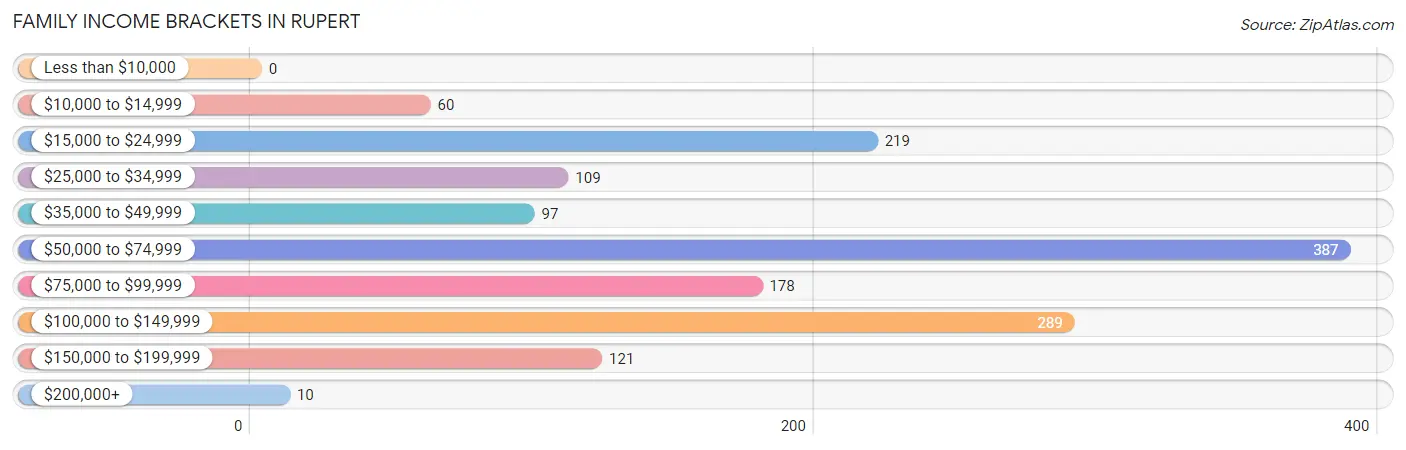
Family Income Brackets in Rupert
According to the Rupert family income data, there are 387 families falling into the $50,000 to $74,999 income range, which is the most common income bracket and makes up 26.3% of all families.
| Income Bracket | # Families | % Families |
| Less than $10,000 | 0 | 0.0% |
| $10,000 to $14,999 | 60 | 4.1% |
| $15,000 to $24,999 | 219 | 14.9% |
| $25,000 to $34,999 | 109 | 7.4% |
| $35,000 to $49,999 | 97 | 6.6% |
| $50,000 to $74,999 | 387 | 26.3% |
| $75,000 to $99,999 | 178 | 12.1% |
| $100,000 to $149,999 | 289 | 19.6% |
| $150,000 to $199,999 | 121 | 8.2% |
| $200,000+ | 10 | 0.7% |
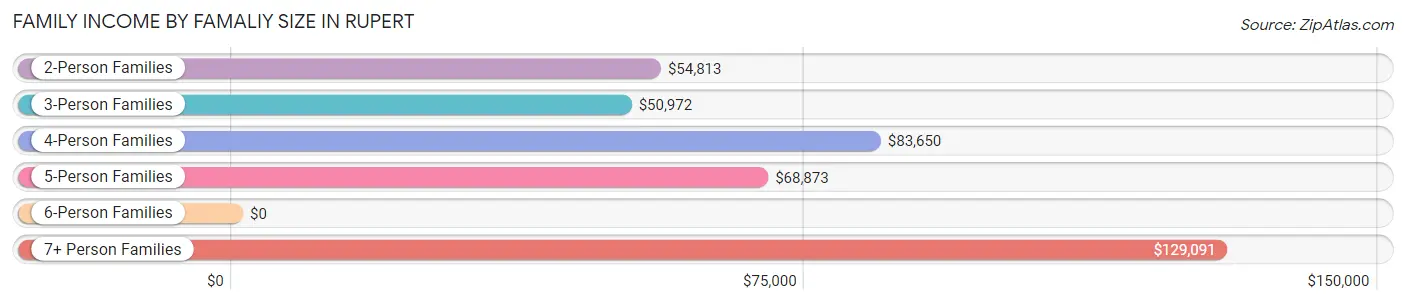
Family Income by Famaliy Size in Rupert
7+ person families (30 | 2.0%) account for the highest median family income in Rupert with $129,091 per family, while 2-person families (546 | 37.1%) have the highest median income of $27,406 per family member.
| Income Bracket | # Families | Median Income |
| 2-Person Families | 546 (37.1%) | $54,813 |
| 3-Person Families | 270 (18.3%) | $50,972 |
| 4-Person Families | 241 (16.4%) | $83,650 |
| 5-Person Families | 362 (24.6%) | $68,873 |
| 6-Person Families | 23 (1.6%) | $0 |
| 7+ Person Families | 30 (2.0%) | $129,091 |
| Total | 1,472 (100.0%) | $66,684 |
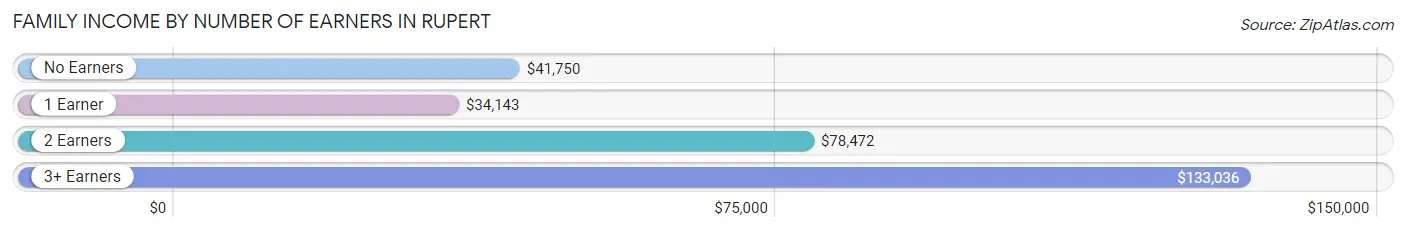
Family Income by Number of Earners in Rupert
The median family income in Rupert is $66,684, with families comprising 3+ earners (255) having the highest median family income of $133,036, while families with 1 earner (390) have the lowest median family income of $34,143, accounting for 17.3% and 26.5% of families, respectively.
| Number of Earners | # Families | Median Income |
| No Earners | 234 (15.9%) | $41,750 |
| 1 Earner | 390 (26.5%) | $34,143 |
| 2 Earners | 593 (40.3%) | $78,472 |
| 3+ Earners | 255 (17.3%) | $133,036 |
| Total | 1,472 (100.0%) | $66,684 |
Household Income in Rupert
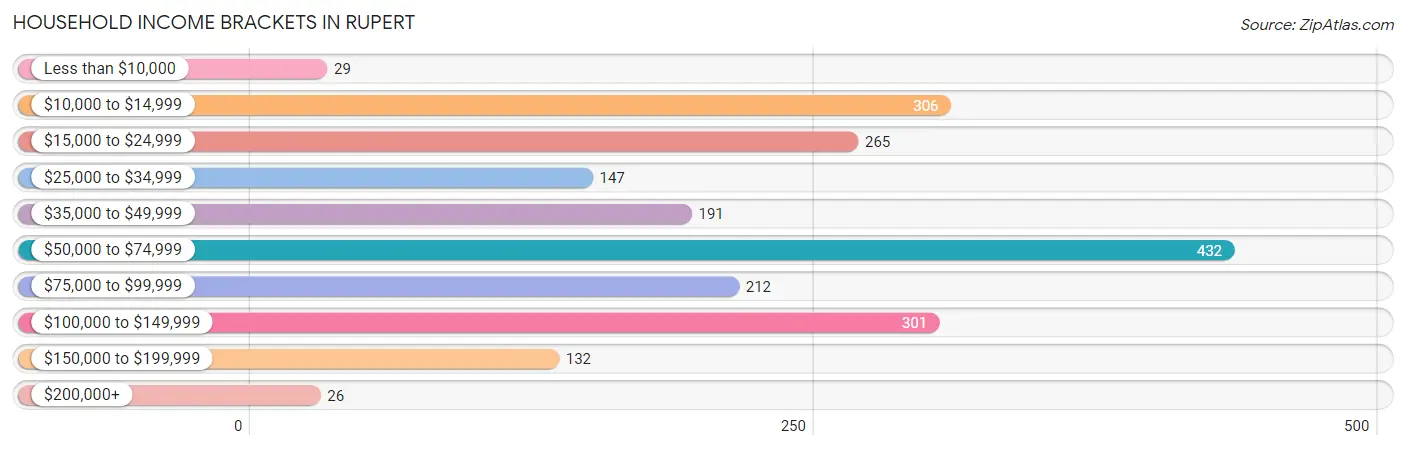
Household Income Brackets in Rupert
With 432 households falling in the category, the $50,000 to $74,999 income range is the most frequent in Rupert, accounting for 21.2% of all households. In contrast, only 26 households (1.3%) fall into the $200,000+ income bracket, making it the least populous group.
| Income Bracket | # Households | % Households |
| Less than $10,000 | 29 | 1.4% |
| $10,000 to $14,999 | 306 | 15.0% |
| $15,000 to $24,999 | 265 | 13.0% |
| $25,000 to $34,999 | 147 | 7.2% |
| $35,000 to $49,999 | 191 | 9.4% |
| $50,000 to $74,999 | 432 | 21.2% |
| $75,000 to $99,999 | 212 | 10.4% |
| $100,000 to $149,999 | 301 | 14.8% |
| $150,000 to $199,999 | 132 | 6.5% |
| $200,000+ | 26 | 1.3% |
Household Income by Householder Age in Rupert
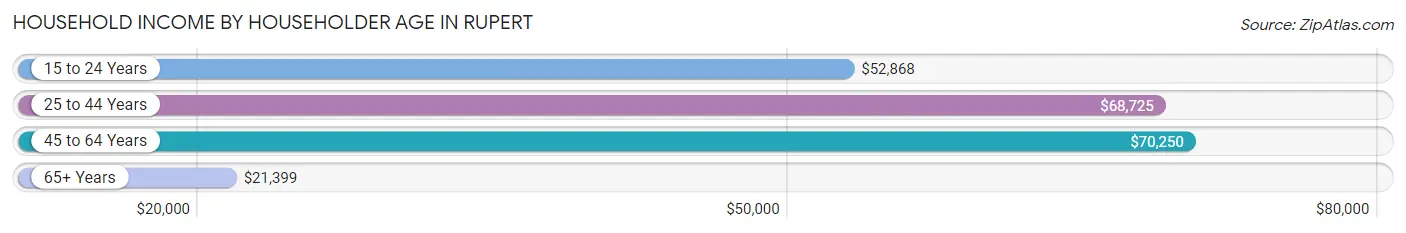
The median household income in Rupert is $53,348, with the highest median household income of $70,250 found in the 45 to 64 years age bracket for the primary householder. A total of 587 households (28.8%) fall into this category. Meanwhile, the 65+ years age bracket for the primary householder has the lowest median household income of $21,399, with 637 households (31.3%) in this group.
| Income Bracket | # Households | Median Income |
| 15 to 24 Years | 99 (4.9%) | $52,868 |
| 25 to 44 Years | 714 (35.0%) | $68,725 |
| 45 to 64 Years | 587 (28.8%) | $70,250 |
| 65+ Years | 637 (31.3%) | $21,399 |
| Total | 2,037 (100.0%) | $53,348 |
Poverty in Rupert
Income Below Poverty by Sex and Age in Rupert
With 24.2% poverty level for males and 22.7% for females among the residents of Rupert, 5 year old males and under 5 year old females are the most vulnerable to poverty, with 74 males (100.0%) and 50 females (50.0%) in their respective age groups living below the poverty level.
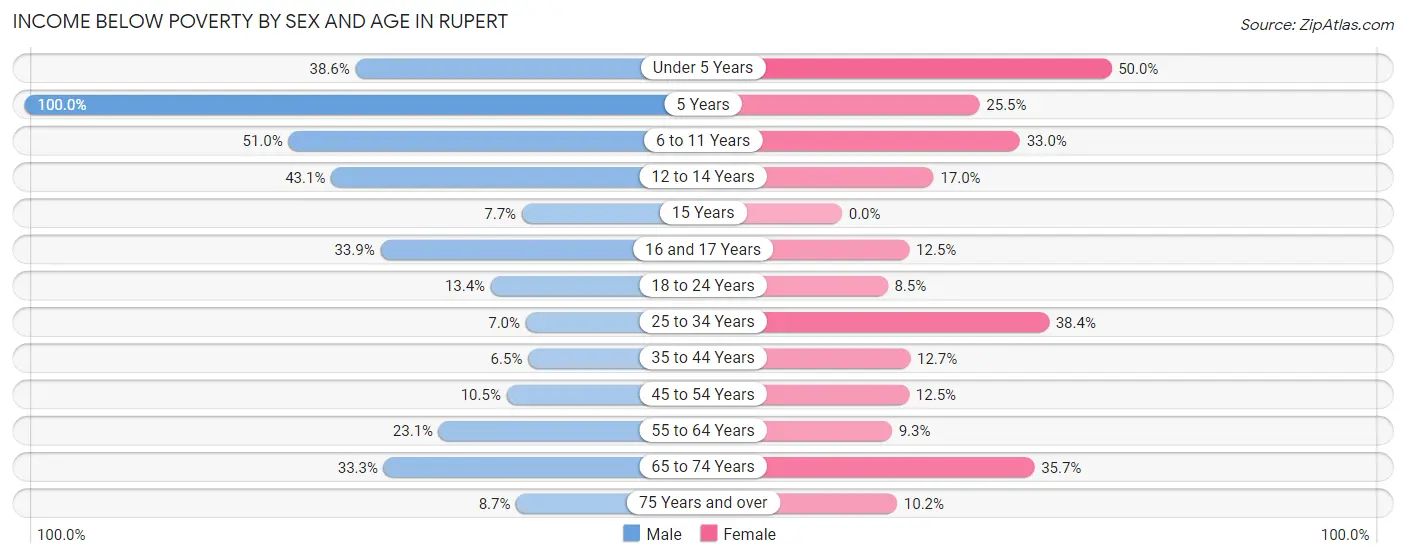
| Age Bracket | Male | Female |
| Under 5 Years | 118 (38.6%) | 50 (50.0%) |
| 5 Years | 74 (100.0%) | 12 (25.5%) |
| 6 to 11 Years | 126 (51.0%) | 106 (33.0%) |
| 12 to 14 Years | 56 (43.1%) | 33 (17.0%) |
| 15 Years | 4 (7.7%) | 0 (0.0%) |
| 16 and 17 Years | 37 (33.9%) | 6 (12.5%) |
| 18 to 24 Years | 43 (13.4%) | 24 (8.5%) |
| 25 to 34 Years | 24 (7.0%) | 189 (38.4%) |
| 35 to 44 Years | 26 (6.5%) | 48 (12.7%) |
| 45 to 54 Years | 31 (10.5%) | 40 (12.5%) |
| 55 to 64 Years | 70 (23.1%) | 23 (9.3%) |
| 65 to 74 Years | 124 (33.3%) | 105 (35.7%) |
| 75 Years and over | 11 (8.7%) | 14 (10.2%) |
| Total | 744 (24.2%) | 650 (22.7%) |
Income Above Poverty by Sex and Age in Rupert
According to the poverty statistics in Rupert, males aged 35 to 44 years and females aged 15 years are the age groups that are most secure financially, with 93.5% of males and 100.0% of females in these age groups living above the poverty line.
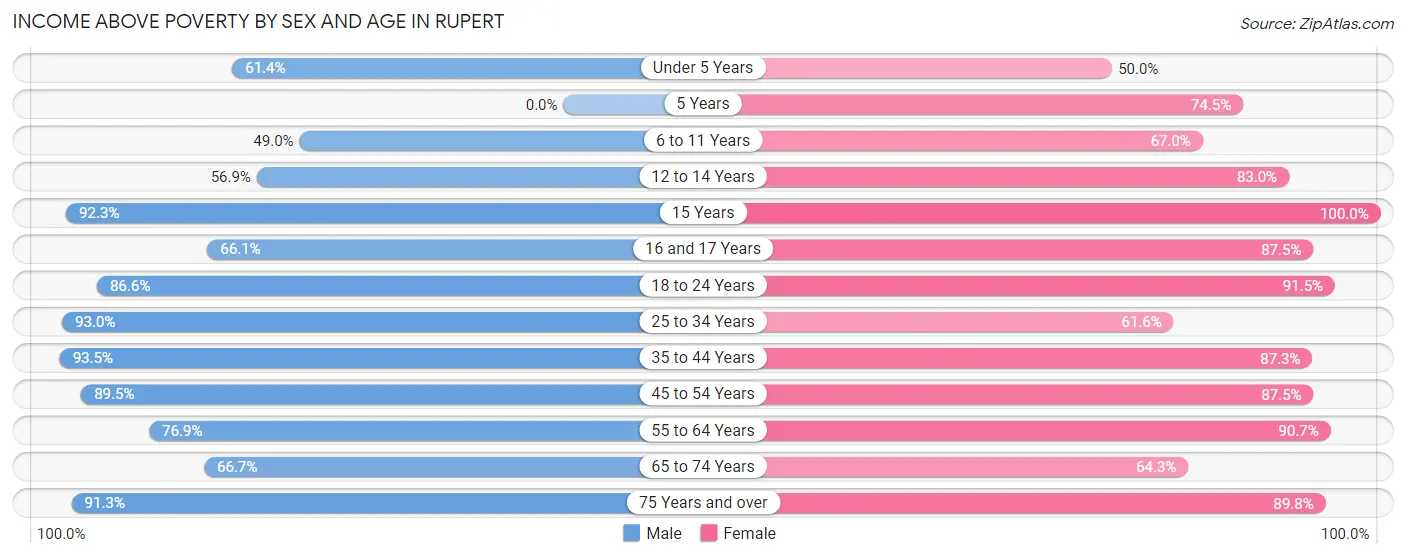
| Age Bracket | Male | Female |
| Under 5 Years | 188 (61.4%) | 50 (50.0%) |
| 5 Years | 0 (0.0%) | 35 (74.5%) |
| 6 to 11 Years | 121 (49.0%) | 215 (67.0%) |
| 12 to 14 Years | 74 (56.9%) | 161 (83.0%) |
| 15 Years | 48 (92.3%) | 6 (100.0%) |
| 16 and 17 Years | 72 (66.1%) | 42 (87.5%) |
| 18 to 24 Years | 277 (86.6%) | 259 (91.5%) |
| 25 to 34 Years | 321 (93.0%) | 303 (61.6%) |
| 35 to 44 Years | 373 (93.5%) | 331 (87.3%) |
| 45 to 54 Years | 264 (89.5%) | 281 (87.5%) |
| 55 to 64 Years | 233 (76.9%) | 225 (90.7%) |
| 65 to 74 Years | 248 (66.7%) | 189 (64.3%) |
| 75 Years and over | 115 (91.3%) | 123 (89.8%) |
| Total | 2,334 (75.8%) | 2,220 (77.3%) |
Income Below Poverty Among Married-Couple Families in Rupert
The poverty statistics for married-couple families in Rupert show that 11.6% or 125 of the total 1,075 families live below the poverty line. Families with 3 or 4 children have the highest poverty rate of 26.9%, comprising of 82 families. On the other hand, families with 5 or more children have the lowest poverty rate of 0.0%, which includes 0 families.
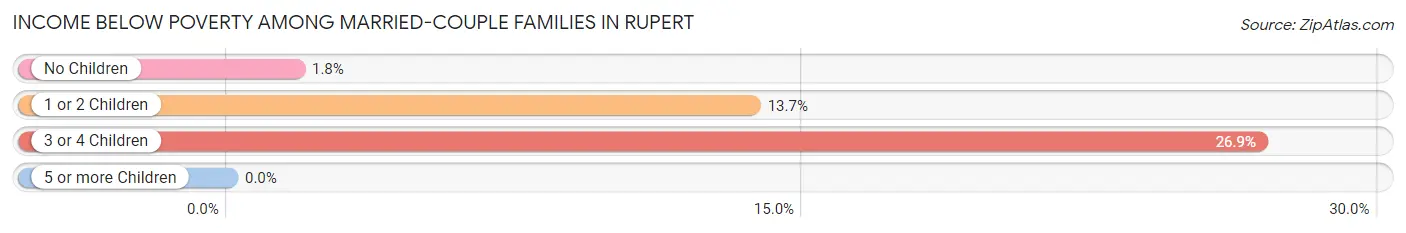
| Children | Above Poverty | Below Poverty |
| No Children | 504 (98.3%) | 9 (1.8%) |
| 1 or 2 Children | 215 (86.4%) | 34 (13.7%) |
| 3 or 4 Children | 223 (73.1%) | 82 (26.9%) |
| 5 or more Children | 8 (100.0%) | 0 (0.0%) |
| Total | 950 (88.4%) | 125 (11.6%) |
Income Below Poverty Among Single-Parent Households in Rupert
According to the poverty data in Rupert, 15.9% or 18 single-father households and 48.6% or 138 single-mother households are living below the poverty line. Among single-father households, those with 1 or 2 children have the highest poverty rate, with 18 households (22.8%) experiencing poverty. Likewise, among single-mother households, those with 1 or 2 children have the highest poverty rate, with 102 households (62.2%) falling below the poverty line.
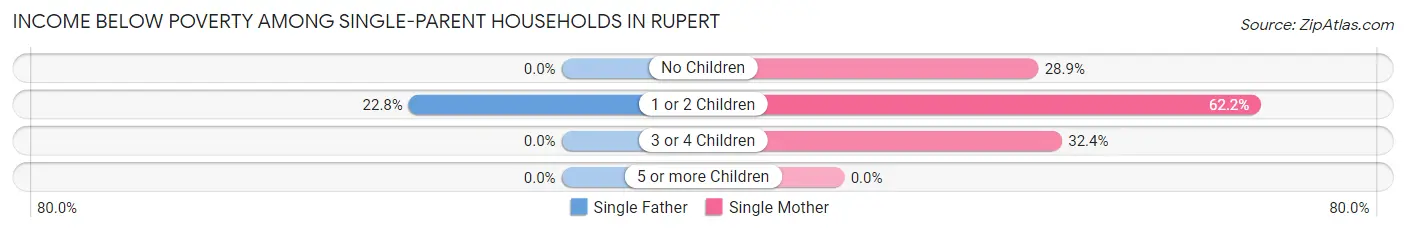
| Children | Single Father | Single Mother |
| No Children | 0 (0.0%) | 24 (28.9%) |
| 1 or 2 Children | 18 (22.8%) | 102 (62.2%) |
| 3 or 4 Children | 0 (0.0%) | 12 (32.4%) |
| 5 or more Children | 0 (0.0%) | 0 (0.0%) |
| Total | 18 (15.9%) | 138 (48.6%) |
Income Below Poverty Among Married-Couple vs Single-Parent Households in Rupert
The poverty data for Rupert shows that 125 of the married-couple family households (11.6%) and 156 of the single-parent households (39.3%) are living below the poverty level. Within the married-couple family households, those with 3 or 4 children have the highest poverty rate, with 82 households (26.9%) falling below the poverty line. Among the single-parent households, those with 1 or 2 children have the highest poverty rate, with 120 household (49.4%) living below poverty.
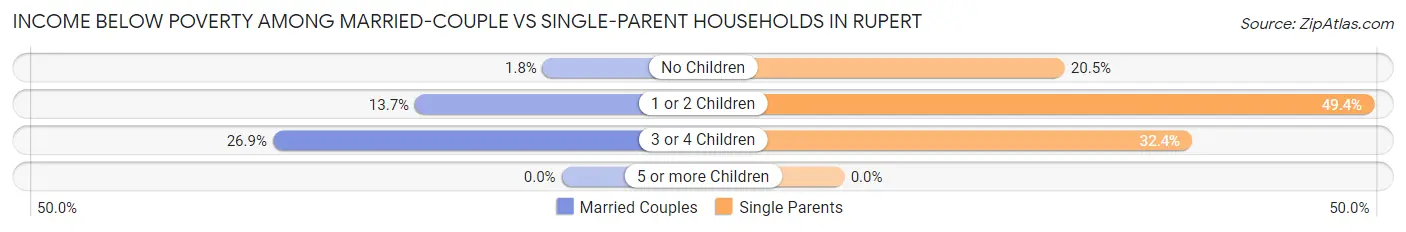
| Children | Married-Couple Families | Single-Parent Households |
| No Children | 9 (1.8%) | 24 (20.5%) |
| 1 or 2 Children | 34 (13.7%) | 120 (49.4%) |
| 3 or 4 Children | 82 (26.9%) | 12 (32.4%) |
| 5 or more Children | 0 (0.0%) | 0 (0.0%) |
| Total | 125 (11.6%) | 156 (39.3%) |
Race in Rupert
The most populous races in Rupert are White / Caucasian (4,056 | 66.9%), Hispanic or Latino (2,933 | 48.3%), and Some other Race (1,123 | 18.5%).
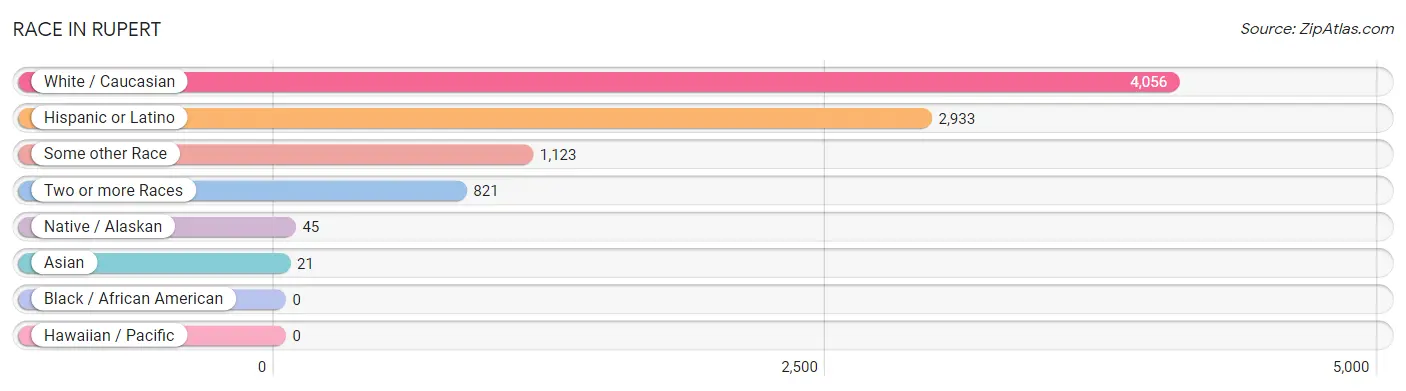
| Race | # Population | % Population |
| Asian | 21 | 0.4% |
| Black / African American | 0 | 0.0% |
| Hawaiian / Pacific | 0 | 0.0% |
| Hispanic or Latino | 2,933 | 48.3% |
| Native / Alaskan | 45 | 0.7% |
| White / Caucasian | 4,056 | 66.9% |
| Two or more Races | 821 | 13.5% |
| Some other Race | 1,123 | 18.5% |
| Total | 6,066 | 100.0% |
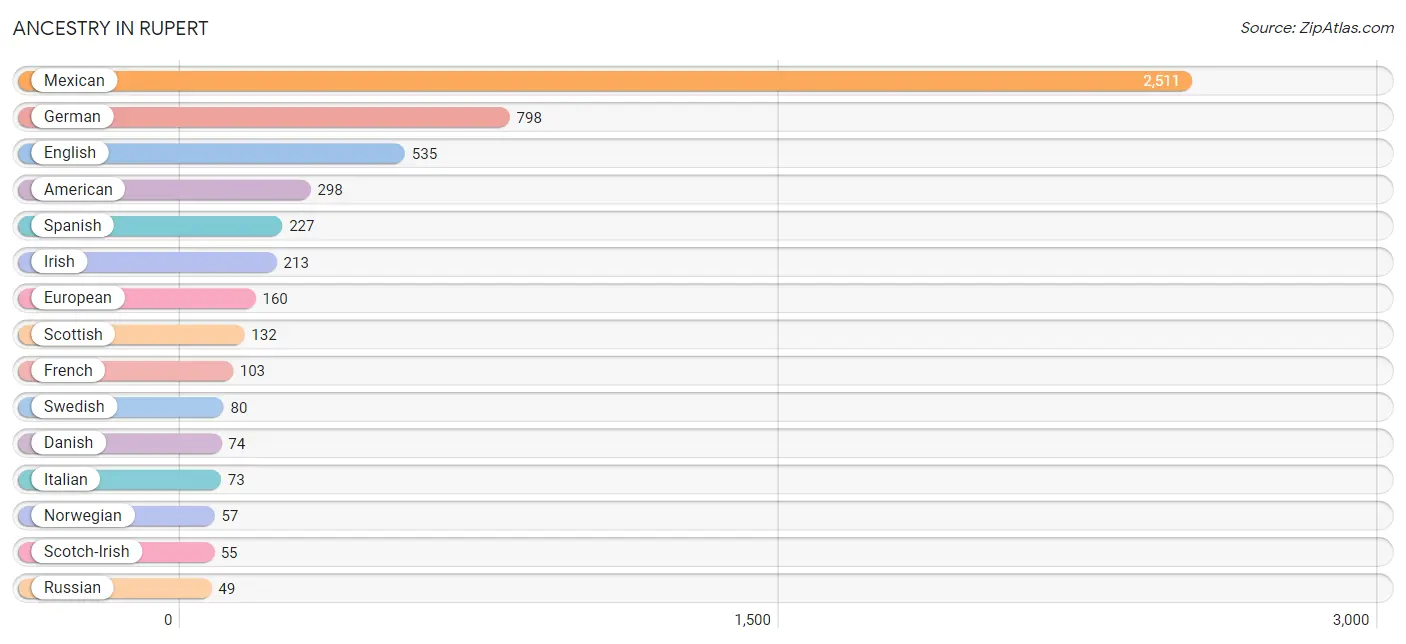
Ancestry in Rupert
The most populous ancestries reported in Rupert are Mexican (2,511 | 41.4%), German (798 | 13.2%), English (535 | 8.8%), American (298 | 4.9%), and Spanish (227 | 3.7%), together accounting for 72.0% of all Rupert residents.
| Ancestry | # Population | % Population |
| American | 298 | 4.9% |
| Basque | 46 | 0.8% |
| British | 8 | 0.1% |
| Canadian | 2 | 0.0% |
| Cherokee | 2 | 0.0% |
| Chilean | 9 | 0.2% |
| Colville | 6 | 0.1% |
| Czech | 2 | 0.0% |
| Danish | 74 | 1.2% |
| Dutch | 6 | 0.1% |
| Eastern European | 7 | 0.1% |
| English | 535 | 8.8% |
| European | 160 | 2.6% |
| French | 103 | 1.7% |
| French Canadian | 25 | 0.4% |
| German | 798 | 13.2% |
| Indonesian | 20 | 0.3% |
| Irish | 213 | 3.5% |
| Italian | 73 | 1.2% |
| Korean | 6 | 0.1% |
| Mexican | 2,511 | 41.4% |
| Navajo | 35 | 0.6% |
| Northern European | 27 | 0.4% |
| Norwegian | 57 | 0.9% |
| Russian | 49 | 0.8% |
| Scotch-Irish | 55 | 0.9% |
| Scottish | 132 | 2.2% |
| Slovak | 17 | 0.3% |
| South American | 9 | 0.2% |
| Spaniard | 12 | 0.2% |
| Spanish | 227 | 3.7% |
| Swedish | 80 | 1.3% |
| Swiss | 8 | 0.1% |
| Welsh | 27 | 0.4% |
| Yugoslavian | 6 | 0.1% | View All 35 Rows |
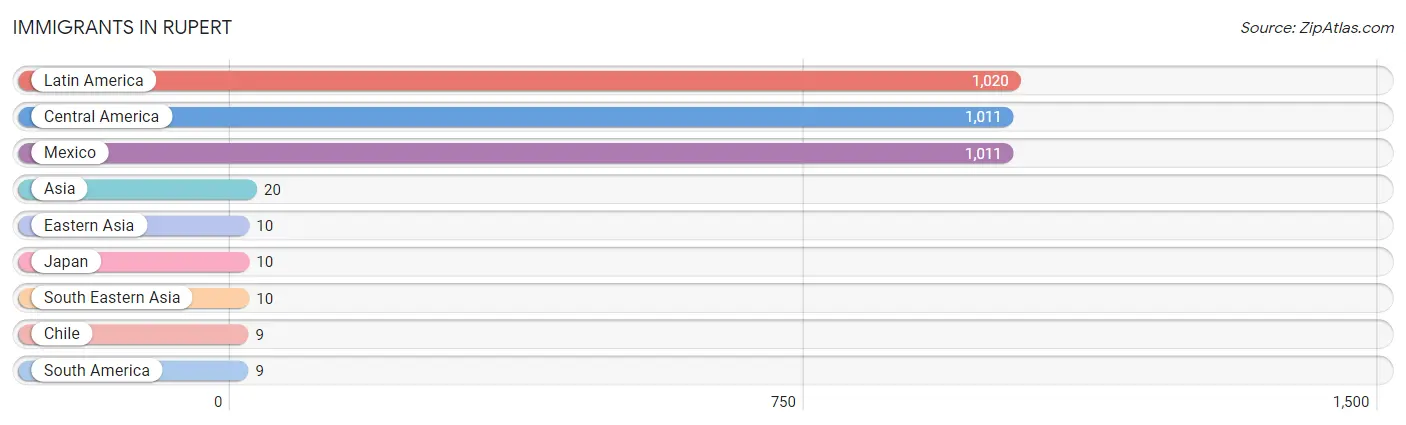
Immigrants in Rupert
The most numerous immigrant groups reported in Rupert came from Latin America (1,020 | 16.8%), Central America (1,011 | 16.7%), Mexico (1,011 | 16.7%), Asia (20 | 0.3%), and Eastern Asia (10 | 0.2%), together accounting for 50.6% of all Rupert residents.
| Immigration Origin | # Population | % Population |
| Asia | 20 | 0.3% |
| Central America | 1,011 | 16.7% |
| Chile | 9 | 0.2% |
| Eastern Asia | 10 | 0.2% |
| Japan | 10 | 0.2% |
| Latin America | 1,020 | 16.8% |
| Mexico | 1,011 | 16.7% |
| South America | 9 | 0.2% |
| South Eastern Asia | 10 | 0.2% | View All 9 Rows |
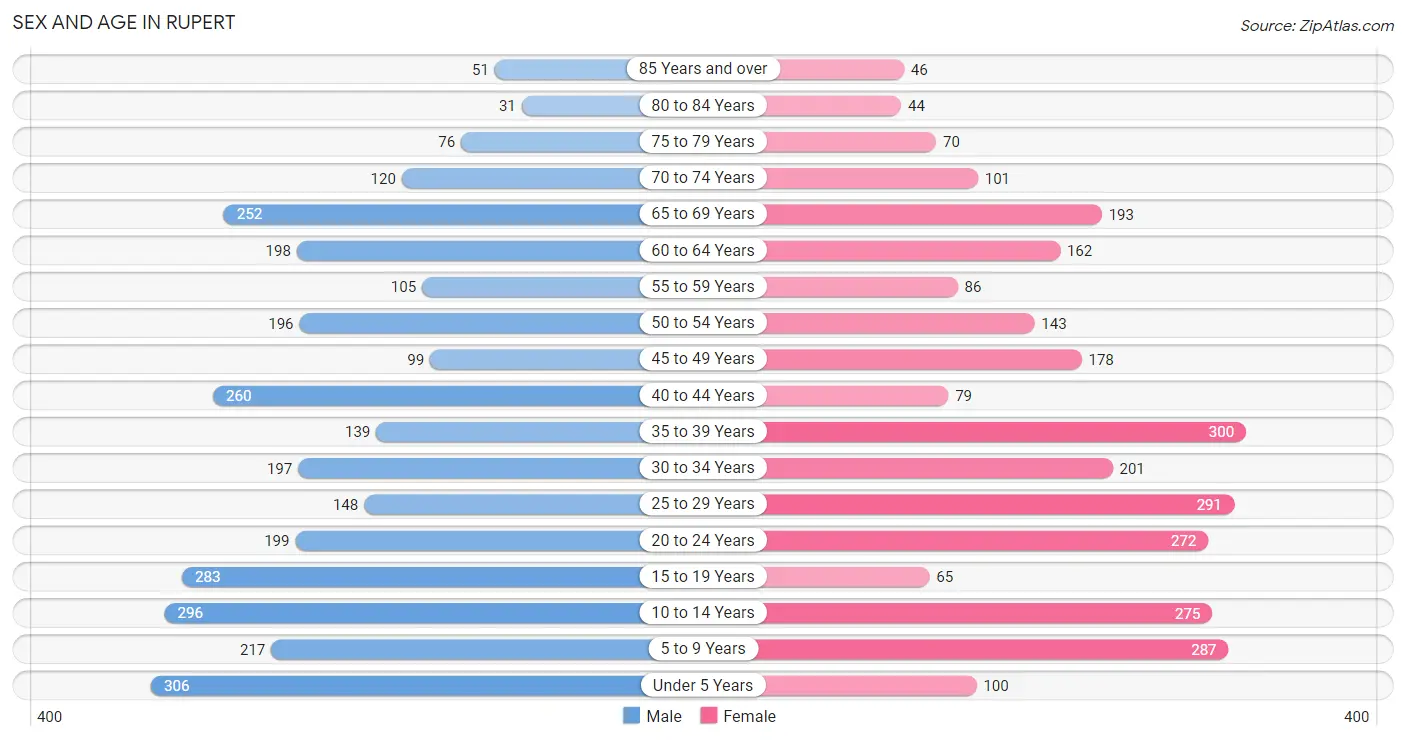
Sex and Age in Rupert
Sex and Age in Rupert
The most populous age groups in Rupert are Under 5 Years (306 | 9.6%) for men and 35 to 39 Years (300 | 10.4%) for women.
| Age Bracket | Male | Female |
| Under 5 Years | 306 (9.6%) | 100 (3.5%) |
| 5 to 9 Years | 217 (6.8%) | 287 (9.9%) |
| 10 to 14 Years | 296 (9.3%) | 275 (9.5%) |
| 15 to 19 Years | 283 (8.9%) | 65 (2.2%) |
| 20 to 24 Years | 199 (6.3%) | 272 (9.4%) |
| 25 to 29 Years | 148 (4.7%) | 291 (10.1%) |
| 30 to 34 Years | 197 (6.2%) | 201 (7.0%) |
| 35 to 39 Years | 139 (4.4%) | 300 (10.4%) |
| 40 to 44 Years | 260 (8.2%) | 79 (2.7%) |
| 45 to 49 Years | 99 (3.1%) | 178 (6.1%) |
| 50 to 54 Years | 196 (6.2%) | 143 (4.9%) |
| 55 to 59 Years | 105 (3.3%) | 86 (3.0%) |
| 60 to 64 Years | 198 (6.2%) | 162 (5.6%) |
| 65 to 69 Years | 252 (7.9%) | 193 (6.7%) |
| 70 to 74 Years | 120 (3.8%) | 101 (3.5%) |
| 75 to 79 Years | 76 (2.4%) | 70 (2.4%) |
| 80 to 84 Years | 31 (1.0%) | 44 (1.5%) |
| 85 Years and over | 51 (1.6%) | 46 (1.6%) |
| Total | 3,173 (100.0%) | 2,893 (100.0%) |
Families and Households in Rupert
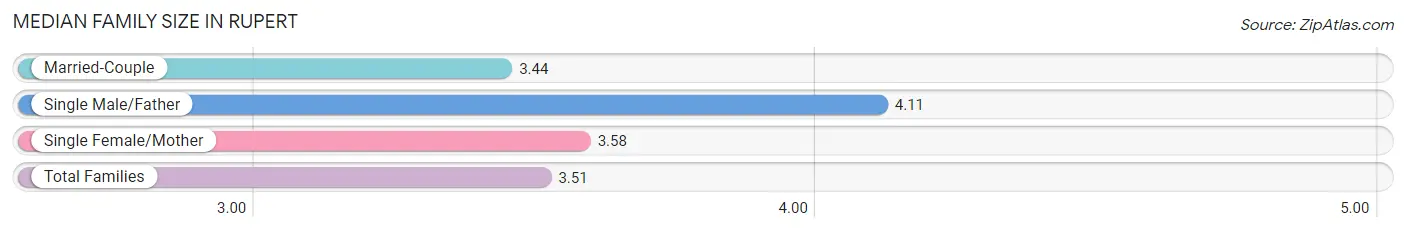
Median Family Size in Rupert
The median family size in Rupert is 3.51 persons per family, with single male/father families (113 | 7.7%) accounting for the largest median family size of 4.11 persons per family. On the other hand, married-couple families (1,075 | 73.0%) represent the smallest median family size with 3.44 persons per family.
| Family Type | # Families | Family Size |
| Married-Couple | 1,075 (73.0%) | 3.44 |
| Single Male/Father | 113 (7.7%) | 4.11 |
| Single Female/Mother | 284 (19.3%) | 3.58 |
| Total Families | 1,472 (100.0%) | 3.51 |
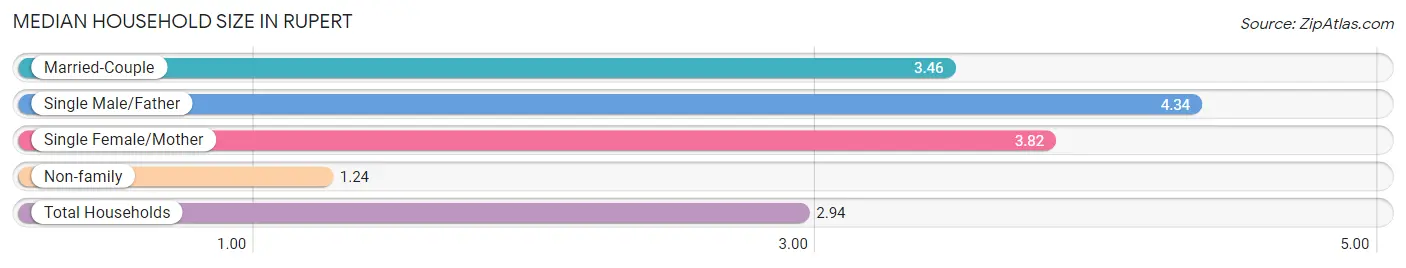
Median Household Size in Rupert
The median household size in Rupert is 2.94 persons per household, with single male/father households (113 | 5.6%) accounting for the largest median household size of 4.34 persons per household. non-family households (565 | 27.7%) represent the smallest median household size with 1.24 persons per household.
| Household Type | # Households | Household Size |
| Married-Couple | 1,075 (52.8%) | 3.46 |
| Single Male/Father | 113 (5.6%) | 4.34 |
| Single Female/Mother | 284 (13.9%) | 3.82 |
| Non-family | 565 (27.7%) | 1.24 |
| Total Households | 2,037 (100.0%) | 2.94 |
Household Size by Marriage Status in Rupert
Out of a total of 2,037 households in Rupert, 1,472 (72.3%) are family households, while 565 (27.7%) are nonfamily households. The most numerous type of family households are 2-person households, comprising 506, and the most common type of nonfamily households are 1-person households, comprising 511.
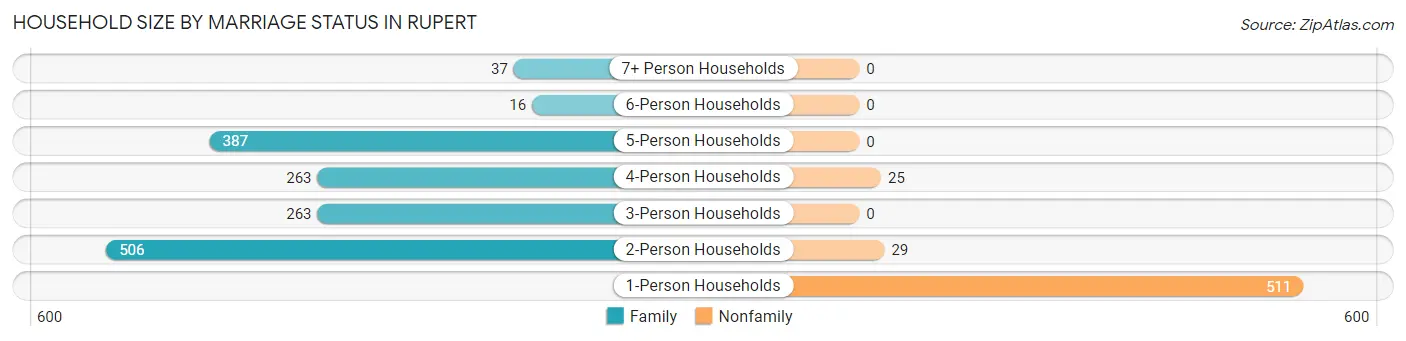
| Household Size | Family Households | Nonfamily Households |
| 1-Person Households | - | 511 (25.1%) |
| 2-Person Households | 506 (24.8%) | 29 (1.4%) |
| 3-Person Households | 263 (12.9%) | 0 (0.0%) |
| 4-Person Households | 263 (12.9%) | 25 (1.2%) |
| 5-Person Households | 387 (19.0%) | 0 (0.0%) |
| 6-Person Households | 16 (0.8%) | 0 (0.0%) |
| 7+ Person Households | 37 (1.8%) | 0 (0.0%) |
| Total | 1,472 (72.3%) | 565 (27.7%) |
Female Fertility in Rupert
Fertility by Age in Rupert
Average fertility rate in Rupert is 40.0 births per 1,000 women. Women in the age bracket of 35 to 50 years have the highest fertility rate with 58.0 births per 1,000 women. Women in the age bracket of 35 to 50 years acount for 58.9% of all women with births.
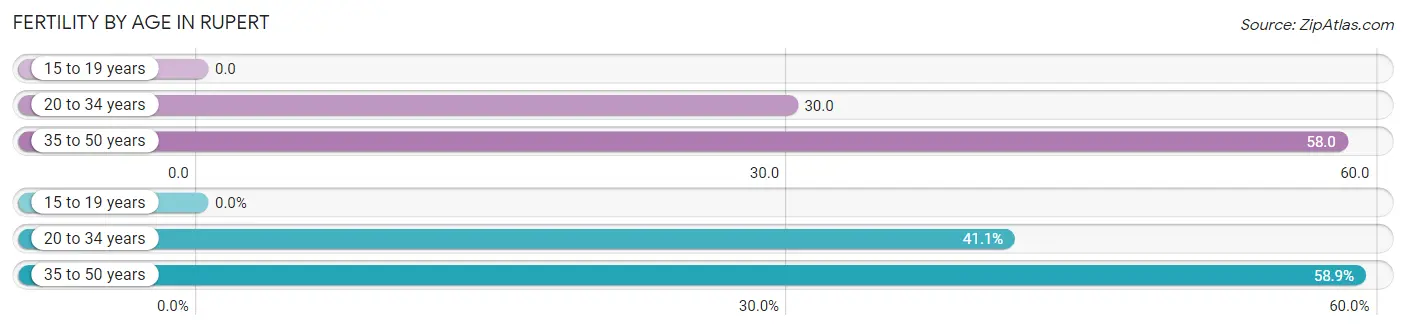
| Age Bracket | Women with Births | Births / 1,000 Women |
| 15 to 19 years | 0 (0.0%) | 0.0 |
| 20 to 34 years | 23 (41.1%) | 30.0 |
| 35 to 50 years | 33 (58.9%) | 58.0 |
| Total | 56 (100.0%) | 40.0 |
Fertility by Age by Marriage Status in Rupert
41.1% of women with births (56) in Rupert are married. The highest percentage of unmarried women with births falls into 35 to 50 years age bracket with 100.0% of them unmarried at the time of birth, while the lowest percentage of unmarried women with births belong to 20 to 34 years age bracket with 0.0% of them unmarried.
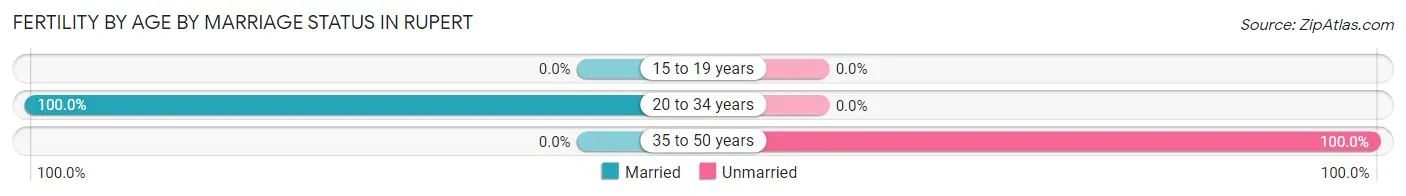
| Age Bracket | Married | Unmarried |
| 15 to 19 years | 0 (0.0%) | 0 (0.0%) |
| 20 to 34 years | 23 (100.0%) | 0 (0.0%) |
| 35 to 50 years | 0 (0.0%) | 33 (100.0%) |
| Total | 23 (41.1%) | 33 (58.9%) |
Fertility by Education in Rupert
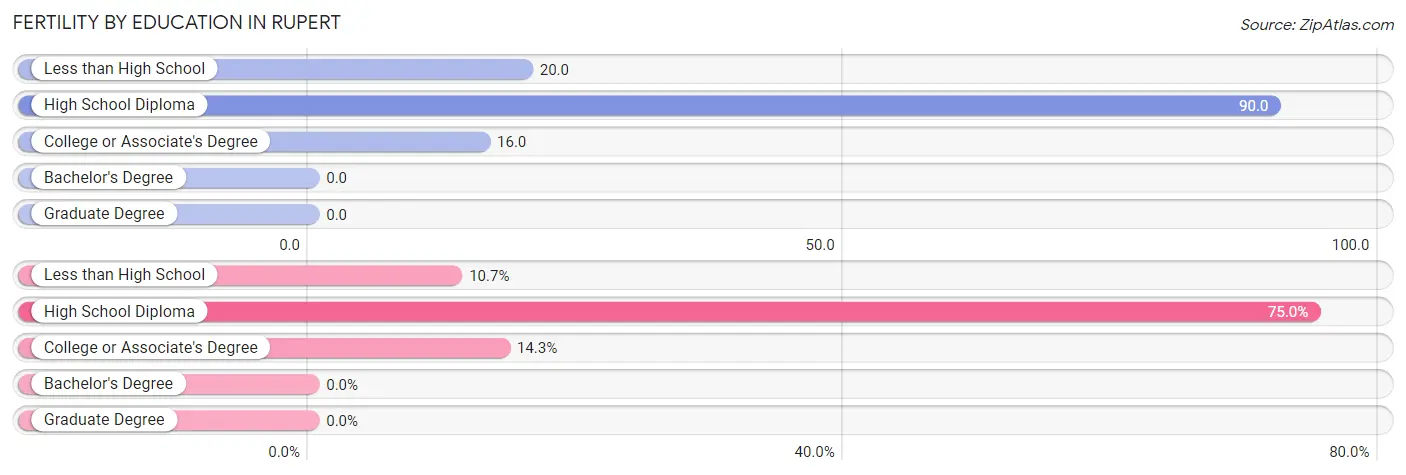
| Educational Attainment | Women with Births | Births / 1,000 Women |
| Less than High School | 6 (10.7%) | 20.0 |
| High School Diploma | 42 (75.0%) | 90.0 |
| College or Associate's Degree | 8 (14.3%) | 16.0 |
| Bachelor's Degree | 0 (0.0%) | 0.0 |
| Graduate Degree | 0 (0.0%) | 0.0 |
| Total | 56 (100.0%) | 40.0 |
Fertility by Education by Marriage Status in Rupert
58.9% of women with births in Rupert are unmarried. Women with the educational attainment of less than high school are most likely to be married with 100.0% of them married at childbirth, while women with the educational attainment of college or associate's degree are least likely to be married with 100.0% of them unmarried at childbirth.
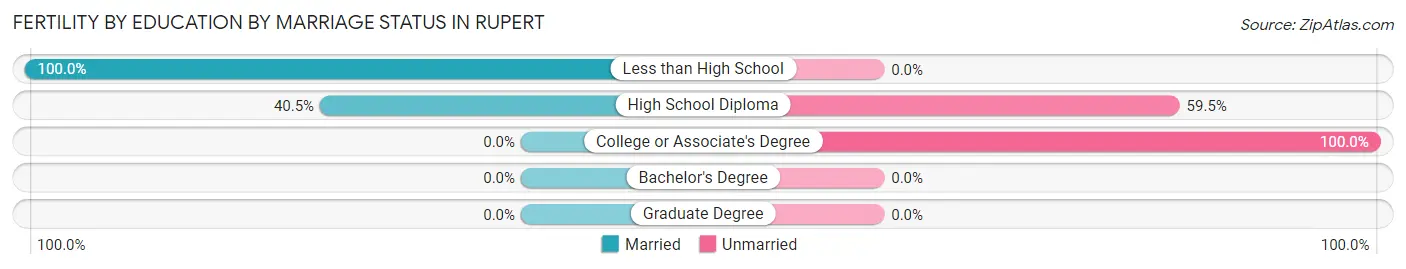
| Educational Attainment | Married | Unmarried |
| Less than High School | 6 (100.0%) | 0 (0.0%) |
| High School Diploma | 17 (40.5%) | 25 (59.5%) |
| College or Associate's Degree | 0 (0.0%) | 8 (100.0%) |
| Bachelor's Degree | 0 (0.0%) | 0 (0.0%) |
| Graduate Degree | 0 (0.0%) | 0 (0.0%) |
| Total | 23 (41.1%) | 33 (58.9%) |
Employment Characteristics in Rupert
Employment by Class of Employer in Rupert
Among the 2,829 employed individuals in Rupert, private company employees (2,136 | 75.5%), self-employed (not incorporated) (277 | 9.8%), and local government employees (274 | 9.7%) make up the most common classes of employment.
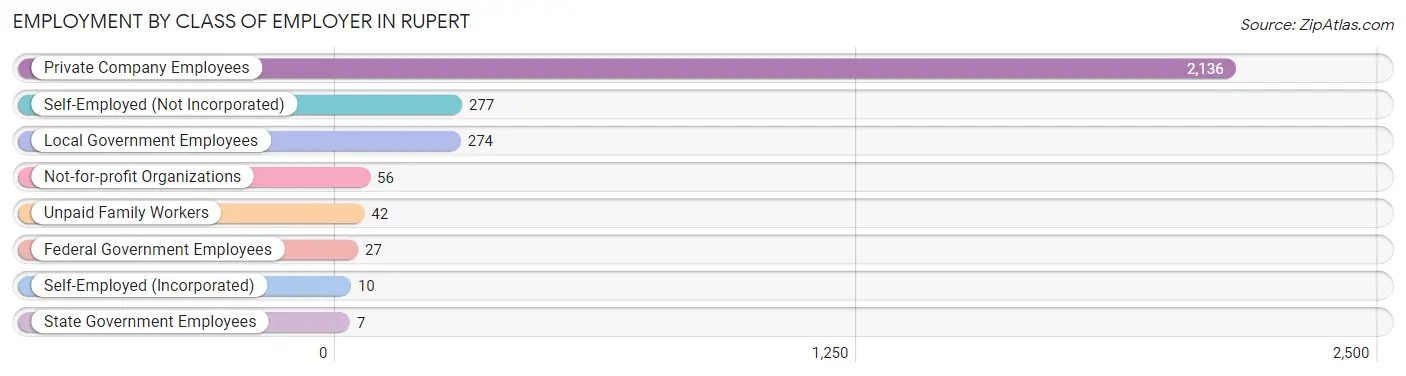
| Employer Class | # Employees | % Employees |
| Private Company Employees | 2,136 | 75.5% |
| Self-Employed (Incorporated) | 10 | 0.4% |
| Self-Employed (Not Incorporated) | 277 | 9.8% |
| Not-for-profit Organizations | 56 | 2.0% |
| Local Government Employees | 274 | 9.7% |
| State Government Employees | 7 | 0.3% |
| Federal Government Employees | 27 | 0.9% |
| Unpaid Family Workers | 42 | 1.5% |
| Total | 2,829 | 100.0% |
Employment Status by Age in Rupert
According to the labor force statistics for Rupert, out of the total population over 16 years of age (4,527), 64.8% or 2,933 individuals are in the labor force, with 2.9% or 85 of them unemployed. The age group with the highest labor force participation rate is 35 to 44 years, with 89.1% or 693 individuals in the labor force. Within the labor force, the 55 to 59 years age range has the highest percentage of unemployed individuals, with 11.3% or 19 of them being unemployed.
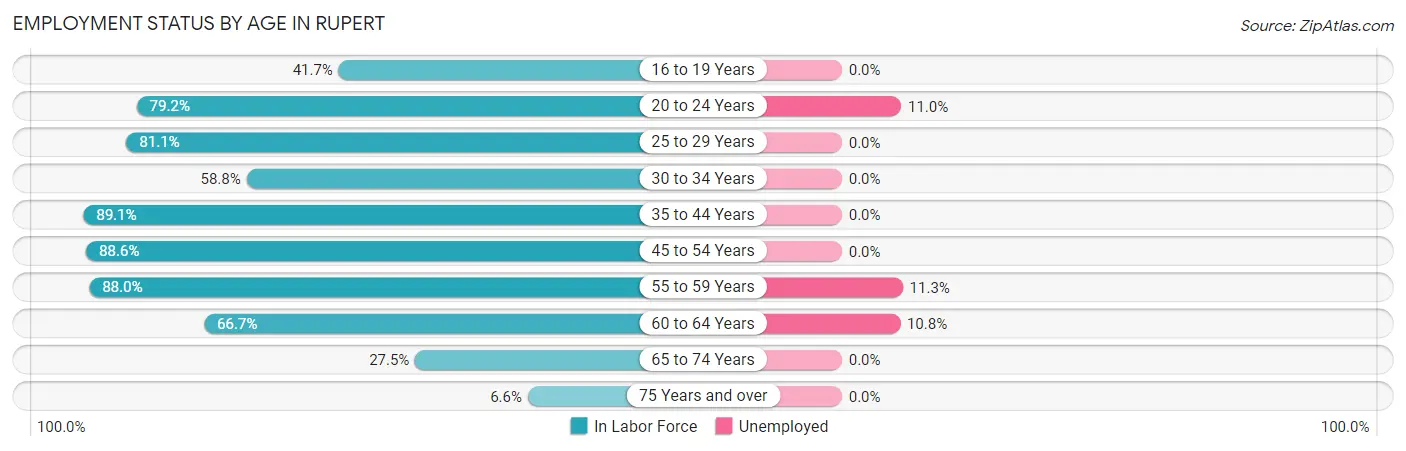
| Age Bracket | In Labor Force | Unemployed |
| 16 to 19 Years | 121 (41.7%) | 0 (0.0%) |
| 20 to 24 Years | 373 (79.2%) | 41 (11.0%) |
| 25 to 29 Years | 356 (81.1%) | 0 (0.0%) |
| 30 to 34 Years | 234 (58.8%) | 0 (0.0%) |
| 35 to 44 Years | 693 (89.1%) | 0 (0.0%) |
| 45 to 54 Years | 546 (88.6%) | 0 (0.0%) |
| 55 to 59 Years | 168 (88.0%) | 19 (11.3%) |
| 60 to 64 Years | 240 (66.7%) | 26 (10.8%) |
| 65 to 74 Years | 183 (27.5%) | 0 (0.0%) |
| 75 Years and over | 21 (6.6%) | 0 (0.0%) |
| Total | 2,933 (64.8%) | 85 (2.9%) |
Employment Status by Educational Attainment in Rupert
According to labor force statistics for Rupert, 80.4% of individuals (2,237) out of the total population between 25 and 64 years of age (2,782) are in the labor force, with 2.0% or 45 of them being unemployed. The group with the highest labor force participation rate are those with the educational attainment of college / associate degree, with 87.9% or 896 individuals in the labor force. Within the labor force, individuals with less than high school education have the highest percentage of unemployment, with 6.2% or 26 of them being unemployed.
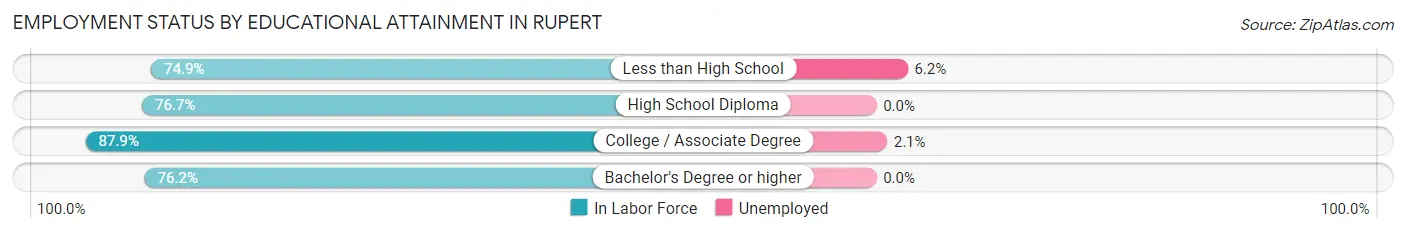
| Educational Attainment | In Labor Force | Unemployed |
| Less than High School | 418 (74.9%) | 35 (6.2%) |
| High School Diploma | 705 (76.7%) | 0 (0.0%) |
| College / Associate Degree | 896 (87.9%) | 21 (2.1%) |
| Bachelor's Degree or higher | 218 (76.2%) | 0 (0.0%) |
| Total | 2,237 (80.4%) | 56 (2.0%) |
Employment Occupations by Sex in Rupert
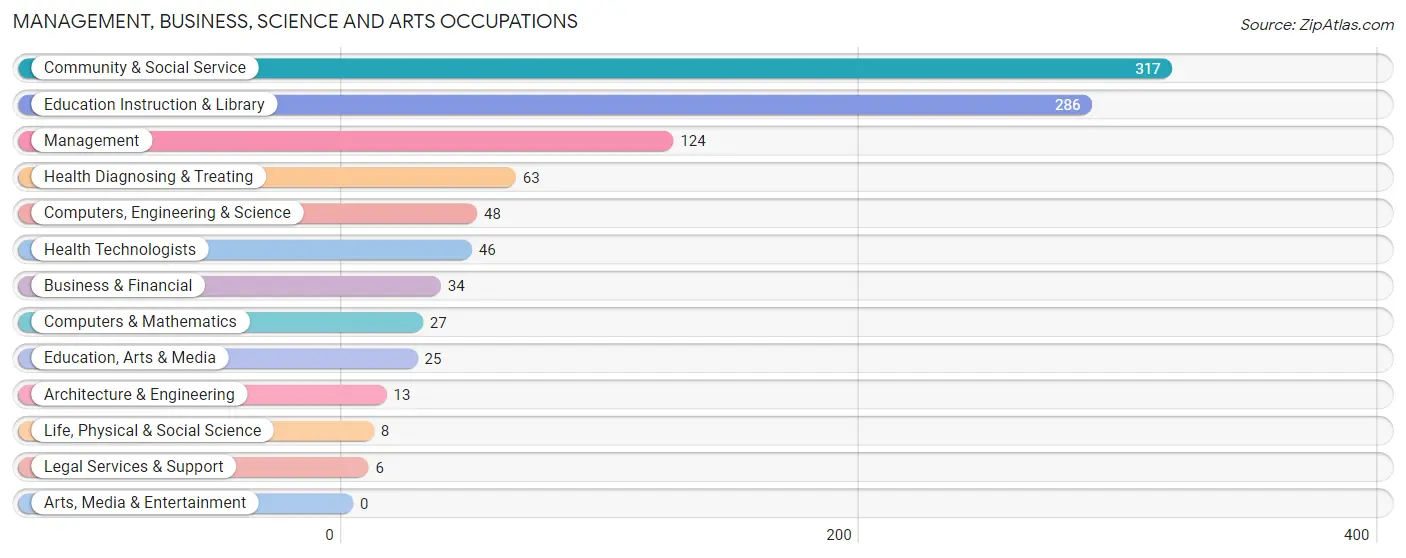
Management, Business, Science and Arts Occupations
The most common Management, Business, Science and Arts occupations in Rupert are Community & Social Service (317 | 11.1%), Education Instruction & Library (286 | 10.0%), Management (124 | 4.3%), Health Diagnosing & Treating (63 | 2.2%), and Computers, Engineering & Science (48 | 1.7%).
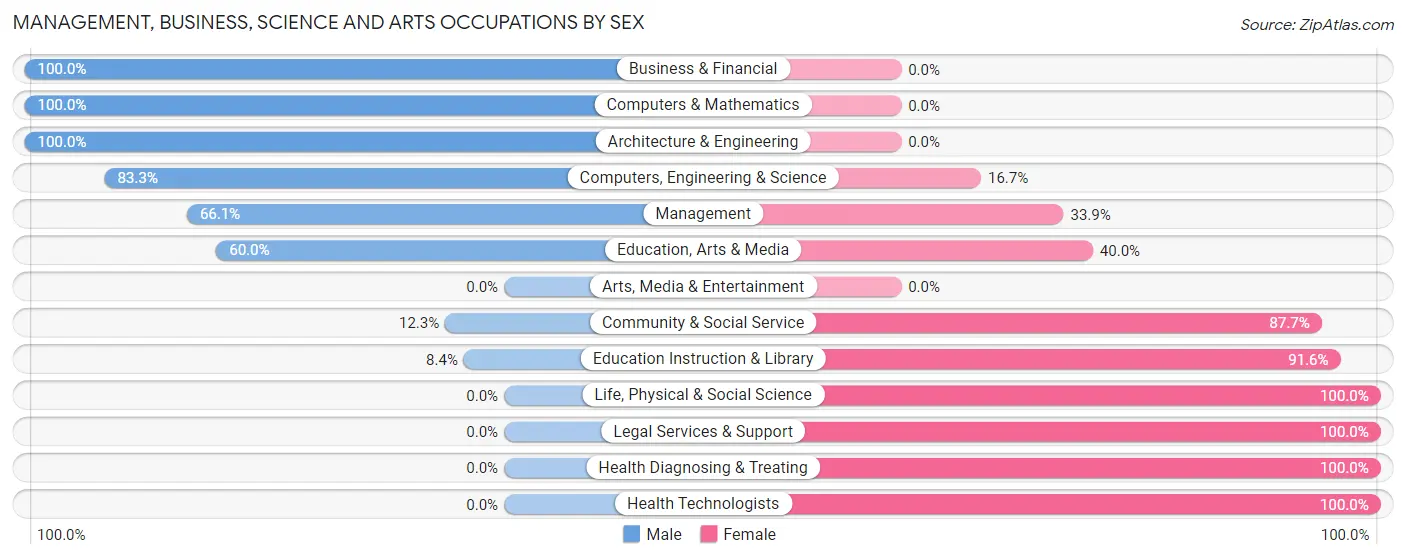
Management, Business, Science and Arts Occupations by Sex
Within the Management, Business, Science and Arts occupations in Rupert, the most male-oriented occupations are Business & Financial (100.0%), Computers & Mathematics (100.0%), and Architecture & Engineering (100.0%), while the most female-oriented occupations are Life, Physical & Social Science (100.0%), Legal Services & Support (100.0%), and Health Diagnosing & Treating (100.0%).
| Occupation | Male | Female |
| Management | 82 (66.1%) | 42 (33.9%) |
| Business & Financial | 34 (100.0%) | 0 (0.0%) |
| Computers, Engineering & Science | 40 (83.3%) | 8 (16.7%) |
| Computers & Mathematics | 27 (100.0%) | 0 (0.0%) |
| Architecture & Engineering | 13 (100.0%) | 0 (0.0%) |
| Life, Physical & Social Science | 0 (0.0%) | 8 (100.0%) |
| Community & Social Service | 39 (12.3%) | 278 (87.7%) |
| Education, Arts & Media | 15 (60.0%) | 10 (40.0%) |
| Legal Services & Support | 0 (0.0%) | 6 (100.0%) |
| Education Instruction & Library | 24 (8.4%) | 262 (91.6%) |
| Arts, Media & Entertainment | 0 (0.0%) | 0 (0.0%) |
| Health Diagnosing & Treating | 0 (0.0%) | 63 (100.0%) |
| Health Technologists | 0 (0.0%) | 46 (100.0%) |
| Total (Category) | 195 (33.3%) | 391 (66.7%) |
| Total (Overall) | 1,460 (51.2%) | 1,389 (48.7%) |
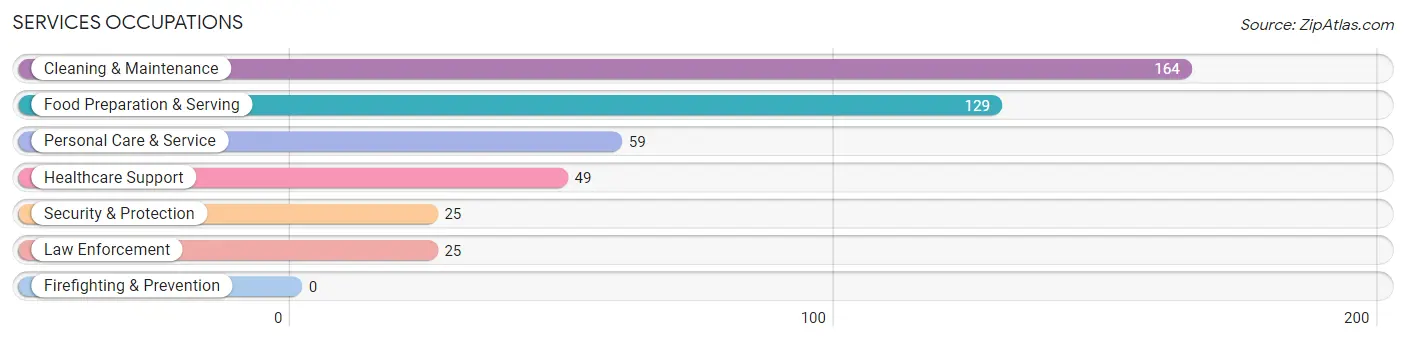
Services Occupations
The most common Services occupations in Rupert are Cleaning & Maintenance (164 | 5.8%), Food Preparation & Serving (129 | 4.5%), Personal Care & Service (59 | 2.1%), Healthcare Support (49 | 1.7%), and Security & Protection (25 | 0.9%).
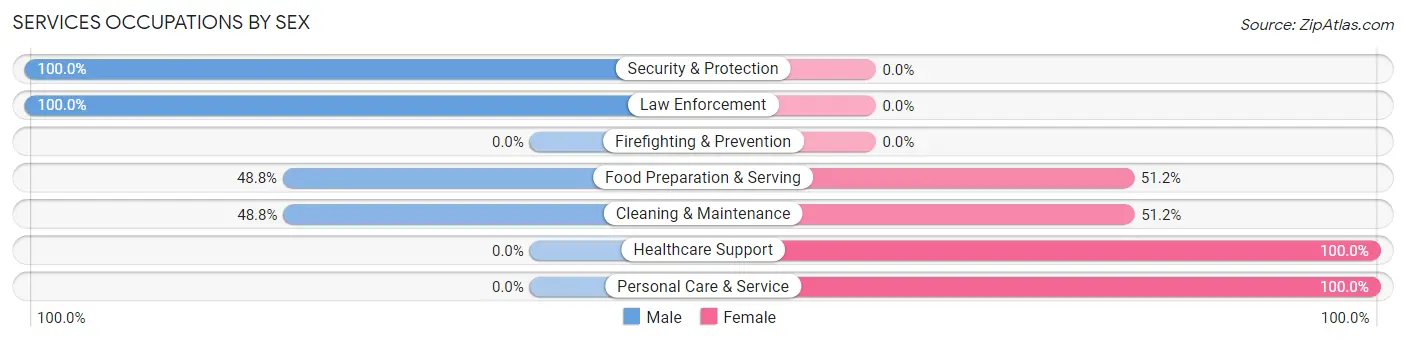
Services Occupations by Sex
Within the Services occupations in Rupert, the most male-oriented occupations are Security & Protection (100.0%), Law Enforcement (100.0%), and Food Preparation & Serving (48.8%), while the most female-oriented occupations are Healthcare Support (100.0%), Personal Care & Service (100.0%), and Cleaning & Maintenance (51.2%).
| Occupation | Male | Female |
| Healthcare Support | 0 (0.0%) | 49 (100.0%) |
| Security & Protection | 25 (100.0%) | 0 (0.0%) |
| Firefighting & Prevention | 0 (0.0%) | 0 (0.0%) |
| Law Enforcement | 25 (100.0%) | 0 (0.0%) |
| Food Preparation & Serving | 63 (48.8%) | 66 (51.2%) |
| Cleaning & Maintenance | 80 (48.8%) | 84 (51.2%) |
| Personal Care & Service | 0 (0.0%) | 59 (100.0%) |
| Total (Category) | 168 (39.4%) | 258 (60.6%) |
| Total (Overall) | 1,460 (51.2%) | 1,389 (48.7%) |
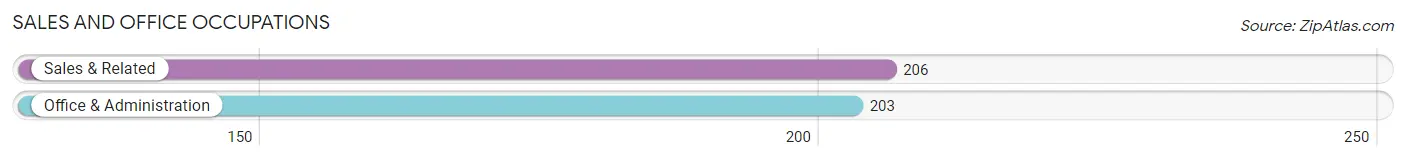
Sales and Office Occupations
The most common Sales and Office occupations in Rupert are Sales & Related (206 | 7.2%), and Office & Administration (203 | 7.1%).
Sales and Office Occupations by Sex
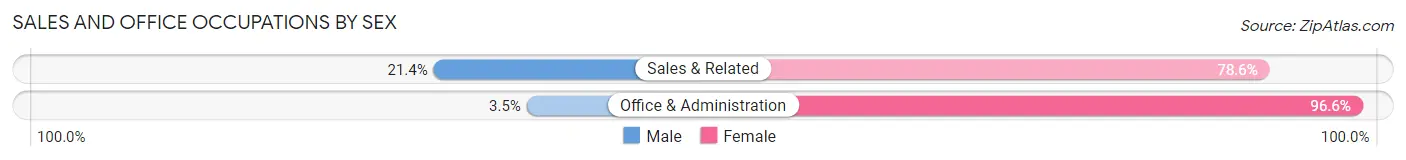
| Occupation | Male | Female |
| Sales & Related | 44 (21.4%) | 162 (78.6%) |
| Office & Administration | 7 (3.5%) | 196 (96.6%) |
| Total (Category) | 51 (12.5%) | 358 (87.5%) |
| Total (Overall) | 1,460 (51.2%) | 1,389 (48.7%) |
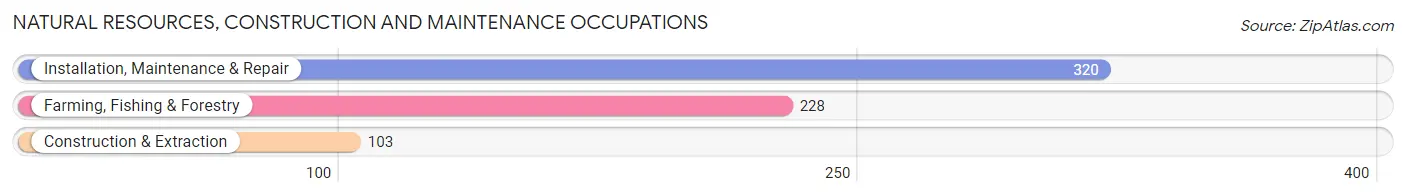
Natural Resources, Construction and Maintenance Occupations
The most common Natural Resources, Construction and Maintenance occupations in Rupert are Installation, Maintenance & Repair (320 | 11.2%), Farming, Fishing & Forestry (228 | 8.0%), and Construction & Extraction (103 | 3.6%).
Natural Resources, Construction and Maintenance Occupations by Sex
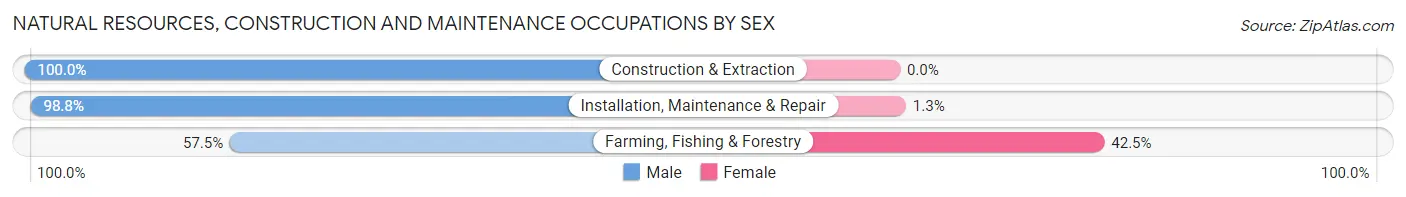
| Occupation | Male | Female |
| Farming, Fishing & Forestry | 131 (57.5%) | 97 (42.5%) |
| Construction & Extraction | 103 (100.0%) | 0 (0.0%) |
| Installation, Maintenance & Repair | 316 (98.8%) | 4 (1.3%) |
| Total (Category) | 550 (84.5%) | 101 (15.5%) |
| Total (Overall) | 1,460 (51.2%) | 1,389 (48.7%) |
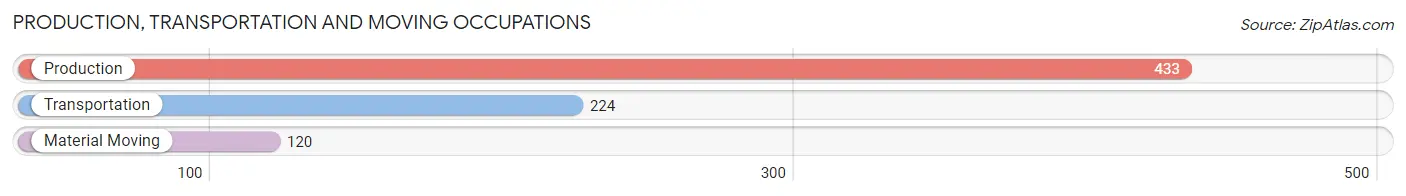
Production, Transportation and Moving Occupations
The most common Production, Transportation and Moving occupations in Rupert are Production (433 | 15.2%), Transportation (224 | 7.9%), and Material Moving (120 | 4.2%).
Production, Transportation and Moving Occupations by Sex
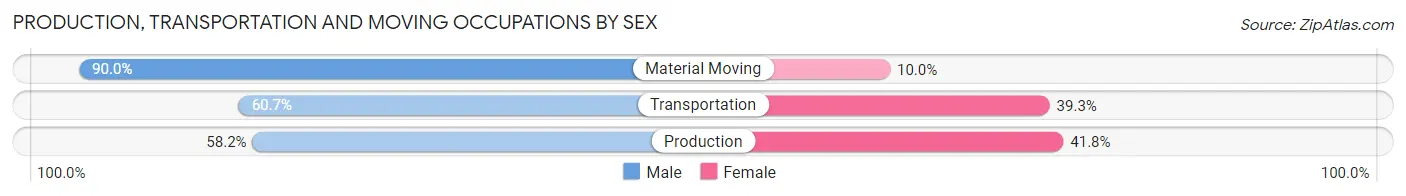
| Occupation | Male | Female |
| Production | 252 (58.2%) | 181 (41.8%) |
| Transportation | 136 (60.7%) | 88 (39.3%) |
| Material Moving | 108 (90.0%) | 12 (10.0%) |
| Total (Category) | 496 (63.8%) | 281 (36.2%) |
| Total (Overall) | 1,460 (51.2%) | 1,389 (48.7%) |
Employment Industries by Sex in Rupert
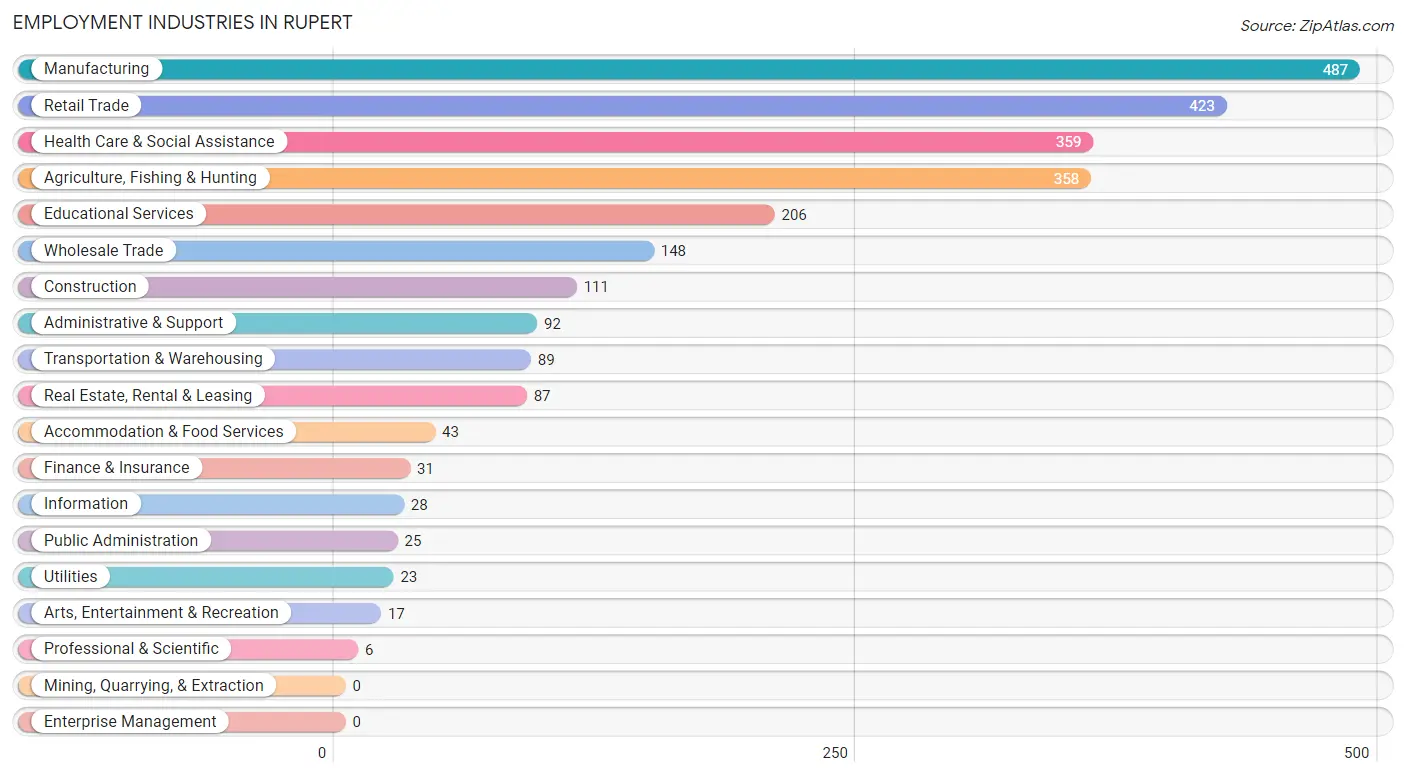
Employment Industries in Rupert
The major employment industries in Rupert include Manufacturing (487 | 17.1%), Retail Trade (423 | 14.8%), Health Care & Social Assistance (359 | 12.6%), Agriculture, Fishing & Hunting (358 | 12.6%), and Educational Services (206 | 7.2%).
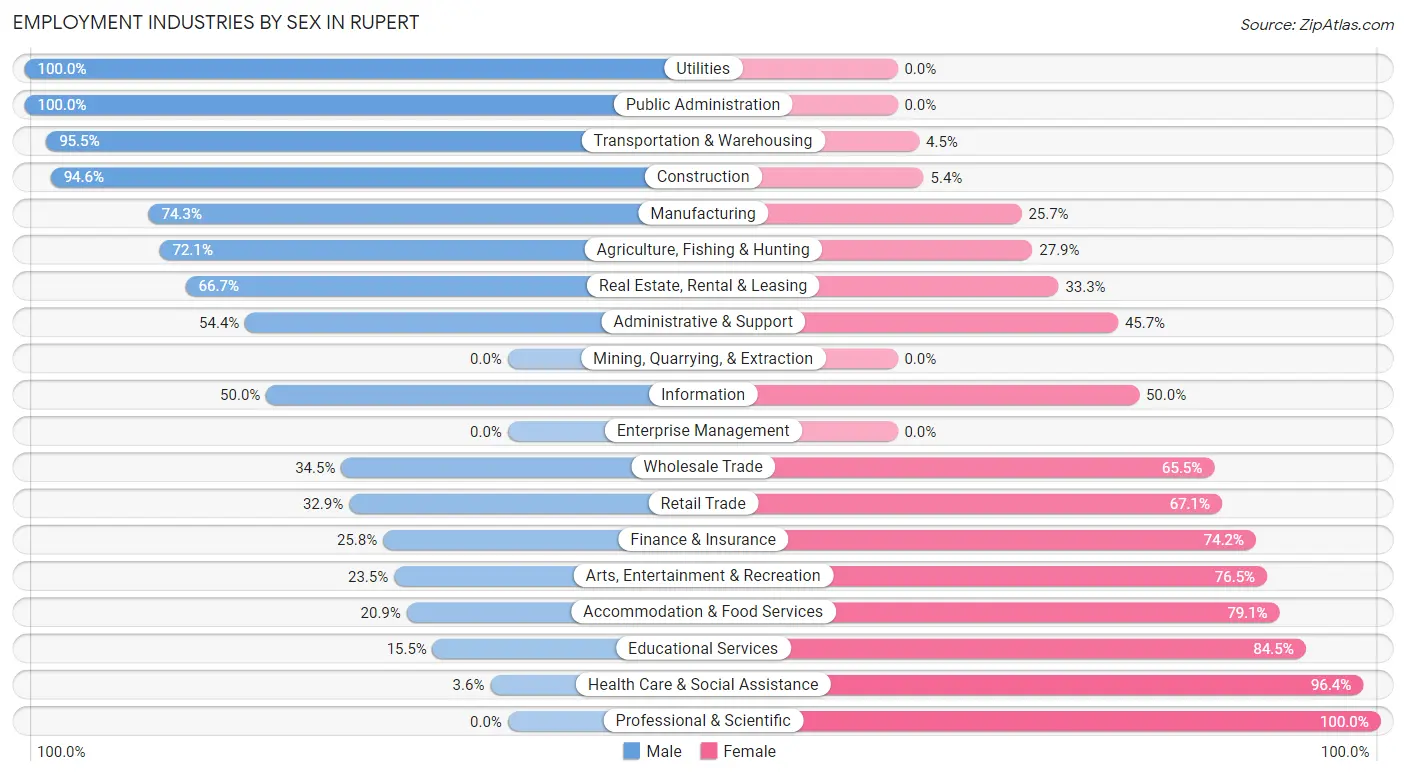
Employment Industries by Sex in Rupert
The Rupert industries that see more men than women are Utilities (100.0%), Public Administration (100.0%), and Transportation & Warehousing (95.5%), whereas the industries that tend to have a higher number of women are Professional & Scientific (100.0%), Health Care & Social Assistance (96.4%), and Educational Services (84.5%).
| Industry | Male | Female |
| Agriculture, Fishing & Hunting | 258 (72.1%) | 100 (27.9%) |
| Mining, Quarrying, & Extraction | 0 (0.0%) | 0 (0.0%) |
| Construction | 105 (94.6%) | 6 (5.4%) |
| Manufacturing | 362 (74.3%) | 125 (25.7%) |
| Wholesale Trade | 51 (34.5%) | 97 (65.5%) |
| Retail Trade | 139 (32.9%) | 284 (67.1%) |
| Transportation & Warehousing | 85 (95.5%) | 4 (4.5%) |
| Utilities | 23 (100.0%) | 0 (0.0%) |
| Information | 14 (50.0%) | 14 (50.0%) |
| Finance & Insurance | 8 (25.8%) | 23 (74.2%) |
| Real Estate, Rental & Leasing | 58 (66.7%) | 29 (33.3%) |
| Professional & Scientific | 0 (0.0%) | 6 (100.0%) |
| Enterprise Management | 0 (0.0%) | 0 (0.0%) |
| Administrative & Support | 50 (54.3%) | 42 (45.7%) |
| Educational Services | 32 (15.5%) | 174 (84.5%) |
| Health Care & Social Assistance | 13 (3.6%) | 346 (96.4%) |
| Arts, Entertainment & Recreation | 4 (23.5%) | 13 (76.5%) |
| Accommodation & Food Services | 9 (20.9%) | 34 (79.1%) |
| Public Administration | 25 (100.0%) | 0 (0.0%) |
| Total | 1,460 (51.2%) | 1,389 (48.7%) |
Education in Rupert
School Enrollment in Rupert
The most common levels of schooling among the 1,597 students in Rupert are middle school (510 | 31.9%), elementary school (377 | 23.6%), and high school (313 | 19.6%).
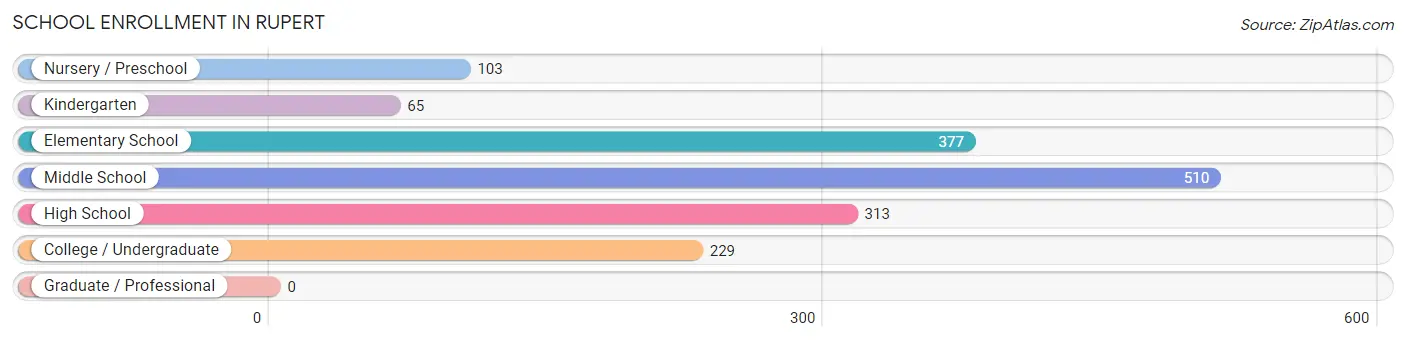
| School Level | # Students | % Students |
| Nursery / Preschool | 103 | 6.5% |
| Kindergarten | 65 | 4.1% |
| Elementary School | 377 | 23.6% |
| Middle School | 510 | 31.9% |
| High School | 313 | 19.6% |
| College / Undergraduate | 229 | 14.3% |
| Graduate / Professional | 0 | 0.0% |
| Total | 1,597 | 100.0% |
School Enrollment by Age by Funding Source in Rupert
Out of a total of 1,597 students who are enrolled in schools in Rupert, 85 (5.3%) attend a private institution, while the remaining 1,512 (94.7%) are enrolled in public schools. The age group of 5 to 9 year old has the highest likelihood of being enrolled in private schools, with 65 (13.3% in the age bracket) enrolled. Conversely, the age group of 3 to 4 year olds has the lowest likelihood of being enrolled in a private school, with 40 (100.0% in the age bracket) attending a public institution.
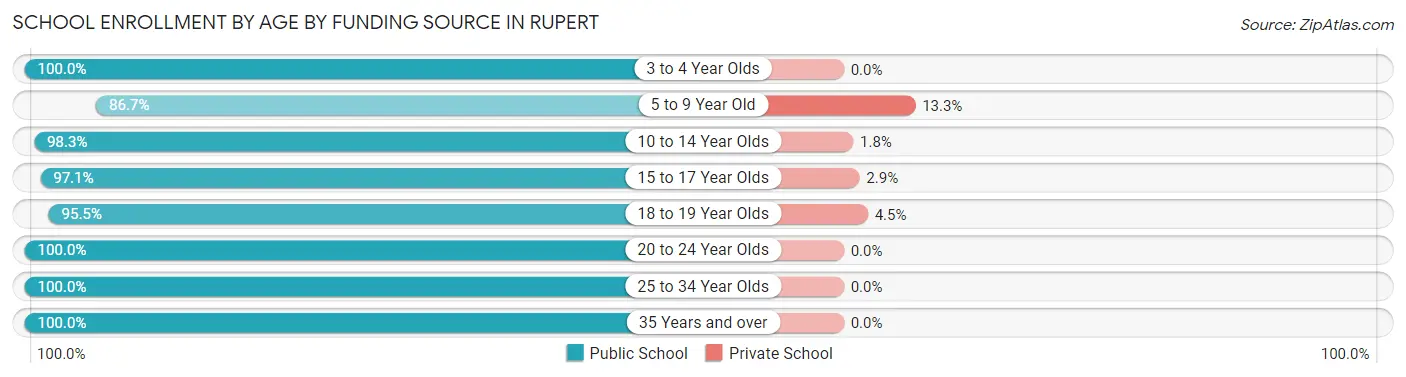
| Age Bracket | Public School | Private School |
| 3 to 4 Year Olds | 40 (100.0%) | 0 (0.0%) |
| 5 to 9 Year Old | 423 (86.7%) | 65 (13.3%) |
| 10 to 14 Year Olds | 561 (98.3%) | 10 (1.8%) |
| 15 to 17 Year Olds | 199 (97.1%) | 6 (2.9%) |
| 18 to 19 Year Olds | 64 (95.5%) | 3 (4.5%) |
| 20 to 24 Year Olds | 77 (100.0%) | 0 (0.0%) |
| 25 to 34 Year Olds | 124 (100.0%) | 0 (0.0%) |
| 35 Years and over | 25 (100.0%) | 0 (0.0%) |
| Total | 1,512 (94.7%) | 85 (5.3%) |
Educational Attainment by Field of Study in Rupert
Education (102 | 26.0%), psychology (54 | 13.8%), business (48 | 12.2%), physical & health sciences (36 | 9.2%), and liberal arts & history (31 | 7.9%) are the most common fields of study among 392 individuals in Rupert who have obtained a bachelor's degree or higher.
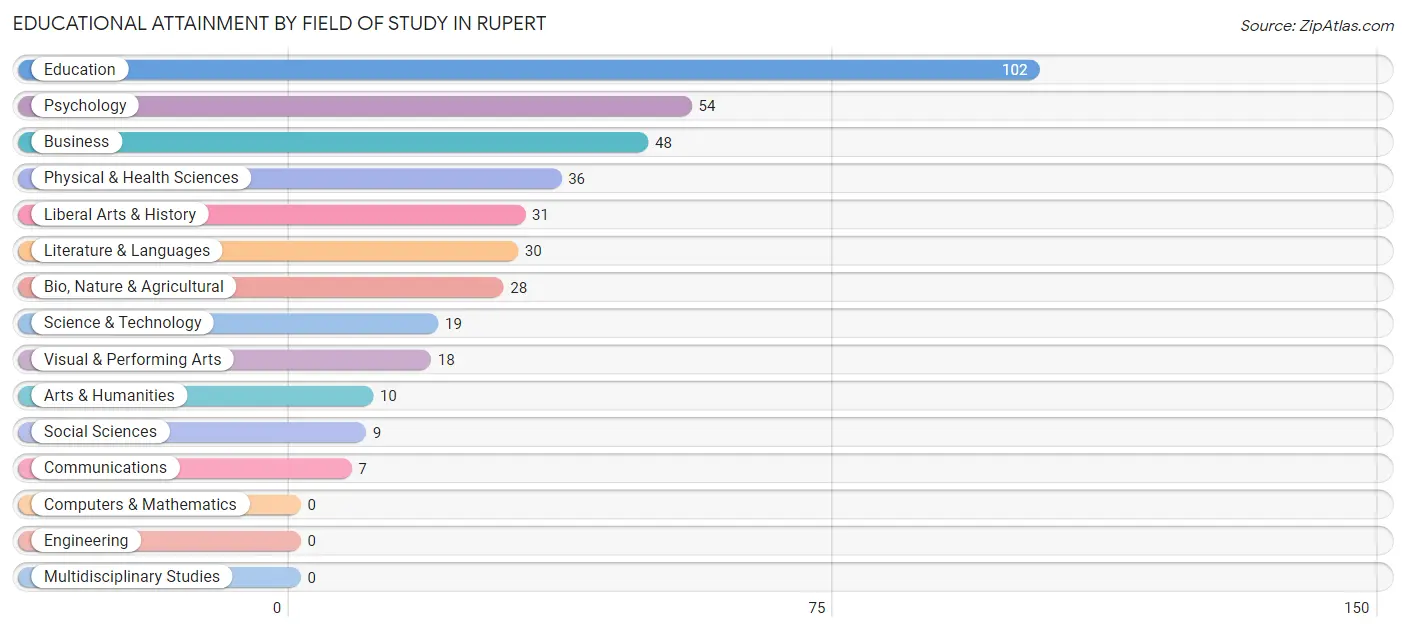
| Field of Study | # Graduates | % Graduates |
| Computers & Mathematics | 0 | 0.0% |
| Bio, Nature & Agricultural | 28 | 7.1% |
| Physical & Health Sciences | 36 | 9.2% |
| Psychology | 54 | 13.8% |
| Social Sciences | 9 | 2.3% |
| Engineering | 0 | 0.0% |
| Multidisciplinary Studies | 0 | 0.0% |
| Science & Technology | 19 | 4.9% |
| Business | 48 | 12.2% |
| Education | 102 | 26.0% |
| Literature & Languages | 30 | 7.6% |
| Liberal Arts & History | 31 | 7.9% |
| Visual & Performing Arts | 18 | 4.6% |
| Communications | 7 | 1.8% |
| Arts & Humanities | 10 | 2.5% |
| Total | 392 | 100.0% |
Transportation & Commute in Rupert
Vehicle Availability by Sex in Rupert
The most prevalent vehicle ownership categories in Rupert are males with 2 vehicles (557, accounting for 38.4%) and females with 2 vehicles (564, making up 40.7%).
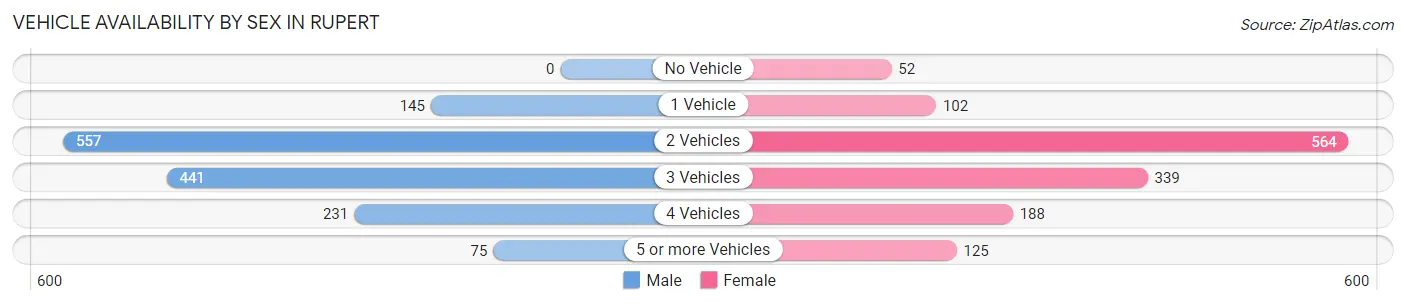
| Vehicles Available | Male | Female |
| No Vehicle | 0 (0.0%) | 52 (3.8%) |
| 1 Vehicle | 145 (10.0%) | 102 (7.4%) |
| 2 Vehicles | 557 (38.4%) | 564 (41.2%) |
| 3 Vehicles | 441 (30.4%) | 339 (24.7%) |
| 4 Vehicles | 231 (15.9%) | 188 (13.7%) |
| 5 or more Vehicles | 75 (5.2%) | 125 (9.1%) |
| Total | 1,449 (100.0%) | 1,370 (100.0%) |
Commute Time in Rupert
The most frequently occuring commute durations in Rupert are 5 to 9 minutes (652 commuters, 24.2%), 15 to 19 minutes (526 commuters, 19.6%), and 20 to 24 minutes (519 commuters, 19.3%).
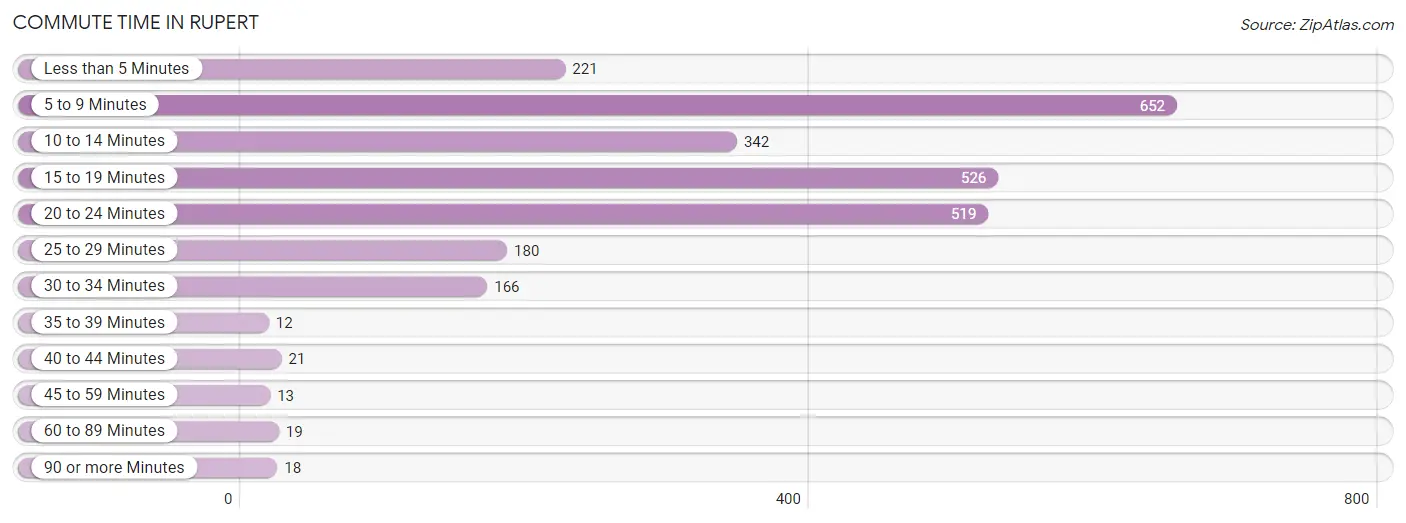
| Commute Time | # Commuters | % Commuters |
| Less than 5 Minutes | 221 | 8.2% |
| 5 to 9 Minutes | 652 | 24.2% |
| 10 to 14 Minutes | 342 | 12.7% |
| 15 to 19 Minutes | 526 | 19.6% |
| 20 to 24 Minutes | 519 | 19.3% |
| 25 to 29 Minutes | 180 | 6.7% |
| 30 to 34 Minutes | 166 | 6.2% |
| 35 to 39 Minutes | 12 | 0.4% |
| 40 to 44 Minutes | 21 | 0.8% |
| 45 to 59 Minutes | 13 | 0.5% |
| 60 to 89 Minutes | 19 | 0.7% |
| 90 or more Minutes | 18 | 0.7% |
Commute Time by Sex in Rupert
The most common commute times in Rupert are 5 to 9 minutes (412 commuters, 29.7%) for males and 15 to 19 minutes (356 commuters, 27.3%) for females.
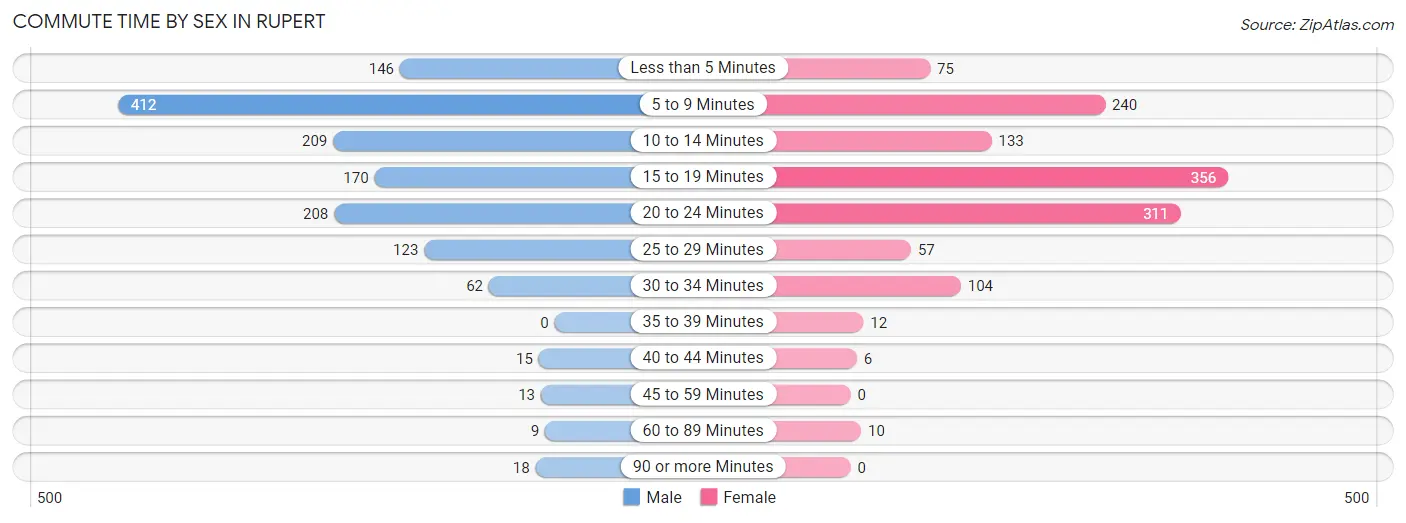
| Commute Time | Male | Female |
| Less than 5 Minutes | 146 (10.5%) | 75 (5.8%) |
| 5 to 9 Minutes | 412 (29.7%) | 240 (18.4%) |
| 10 to 14 Minutes | 209 (15.1%) | 133 (10.2%) |
| 15 to 19 Minutes | 170 (12.3%) | 356 (27.3%) |
| 20 to 24 Minutes | 208 (15.0%) | 311 (23.8%) |
| 25 to 29 Minutes | 123 (8.9%) | 57 (4.4%) |
| 30 to 34 Minutes | 62 (4.5%) | 104 (8.0%) |
| 35 to 39 Minutes | 0 (0.0%) | 12 (0.9%) |
| 40 to 44 Minutes | 15 (1.1%) | 6 (0.5%) |
| 45 to 59 Minutes | 13 (0.9%) | 0 (0.0%) |
| 60 to 89 Minutes | 9 (0.6%) | 10 (0.8%) |
| 90 or more Minutes | 18 (1.3%) | 0 (0.0%) |
Time of Departure to Work by Sex in Rupert
The most frequent times of departure to work in Rupert are 7:30 AM to 7:59 AM (230, 16.6%) for males and 7:30 AM to 7:59 AM (333, 25.5%) for females.
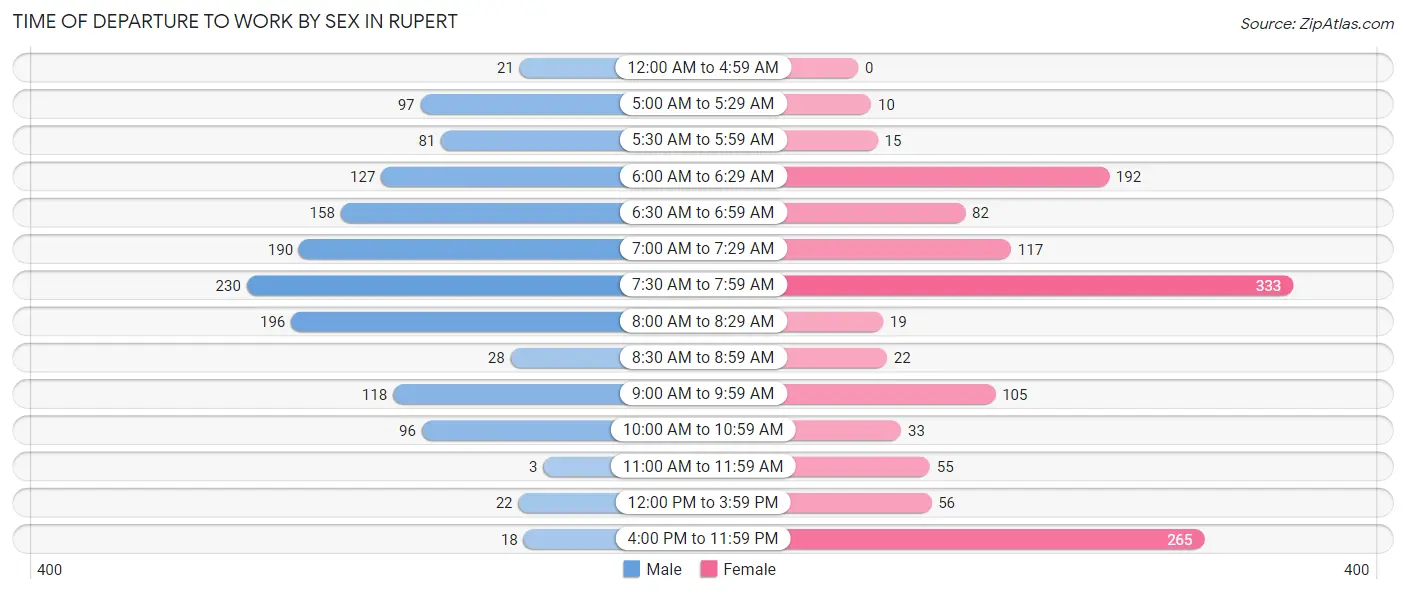
| Time of Departure | Male | Female |
| 12:00 AM to 4:59 AM | 21 (1.5%) | 0 (0.0%) |
| 5:00 AM to 5:29 AM | 97 (7.0%) | 10 (0.8%) |
| 5:30 AM to 5:59 AM | 81 (5.9%) | 15 (1.1%) |
| 6:00 AM to 6:29 AM | 127 (9.2%) | 192 (14.7%) |
| 6:30 AM to 6:59 AM | 158 (11.4%) | 82 (6.3%) |
| 7:00 AM to 7:29 AM | 190 (13.7%) | 117 (9.0%) |
| 7:30 AM to 7:59 AM | 230 (16.6%) | 333 (25.5%) |
| 8:00 AM to 8:29 AM | 196 (14.1%) | 19 (1.5%) |
| 8:30 AM to 8:59 AM | 28 (2.0%) | 22 (1.7%) |
| 9:00 AM to 9:59 AM | 118 (8.5%) | 105 (8.1%) |
| 10:00 AM to 10:59 AM | 96 (6.9%) | 33 (2.5%) |
| 11:00 AM to 11:59 AM | 3 (0.2%) | 55 (4.2%) |
| 12:00 PM to 3:59 PM | 22 (1.6%) | 56 (4.3%) |
| 4:00 PM to 11:59 PM | 18 (1.3%) | 265 (20.3%) |
| Total | 1,385 (100.0%) | 1,304 (100.0%) |
Housing Occupancy in Rupert
Occupancy by Ownership in Rupert
Of the total 2,037 dwellings in Rupert, owner-occupied units account for 1,467 (72.0%), while renter-occupied units make up 570 (28.0%).
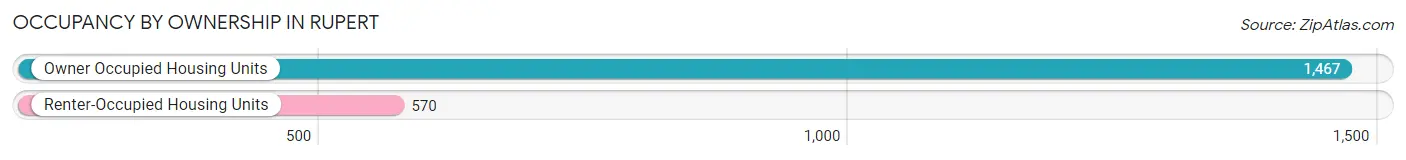
| Occupancy | # Housing Units | % Housing Units |
| Owner Occupied Housing Units | 1,467 | 72.0% |
| Renter-Occupied Housing Units | 570 | 28.0% |
| Total Occupied Housing Units | 2,037 | 100.0% |
Occupancy by Household Size in Rupert
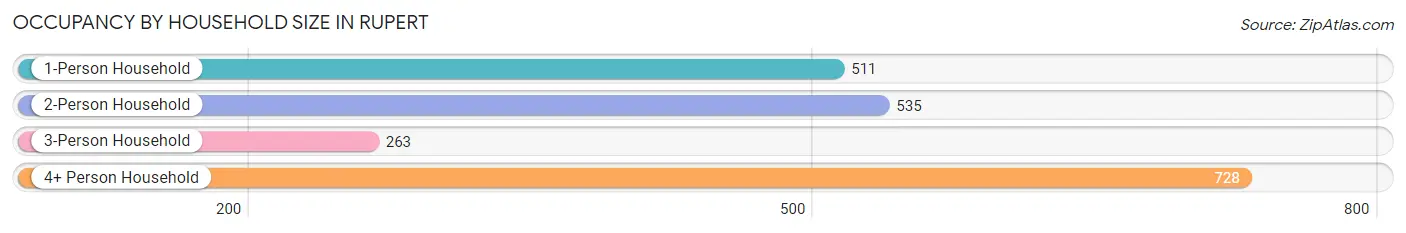
| Household Size | # Housing Units | % Housing Units |
| 1-Person Household | 511 | 25.1% |
| 2-Person Household | 535 | 26.3% |
| 3-Person Household | 263 | 12.9% |
| 4+ Person Household | 728 | 35.7% |
| Total Housing Units | 2,037 | 100.0% |
Occupancy by Ownership by Household Size in Rupert
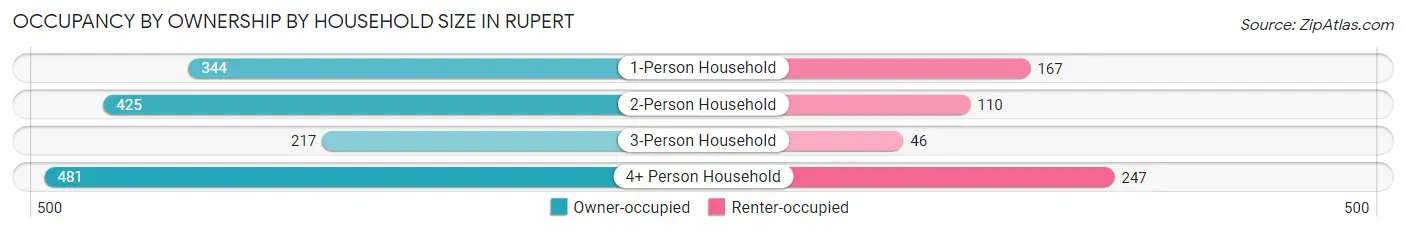
| Household Size | Owner-occupied | Renter-occupied |
| 1-Person Household | 344 (67.3%) | 167 (32.7%) |
| 2-Person Household | 425 (79.4%) | 110 (20.6%) |
| 3-Person Household | 217 (82.5%) | 46 (17.5%) |
| 4+ Person Household | 481 (66.1%) | 247 (33.9%) |
| Total Housing Units | 1,467 (72.0%) | 570 (28.0%) |
Occupancy by Educational Attainment in Rupert
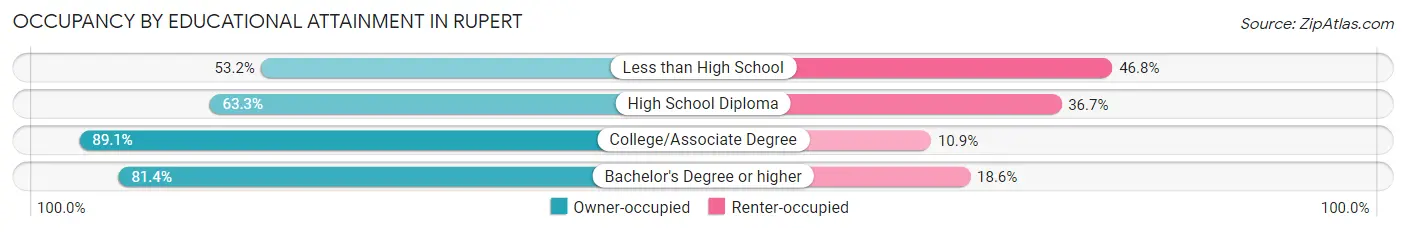
| Household Size | Owner-occupied | Renter-occupied |
| Less than High School | 183 (53.2%) | 161 (46.8%) |
| High School Diploma | 516 (63.3%) | 299 (36.7%) |
| College/Associate Degree | 615 (89.1%) | 75 (10.9%) |
| Bachelor's Degree or higher | 153 (81.4%) | 35 (18.6%) |
Occupancy by Age of Householder in Rupert
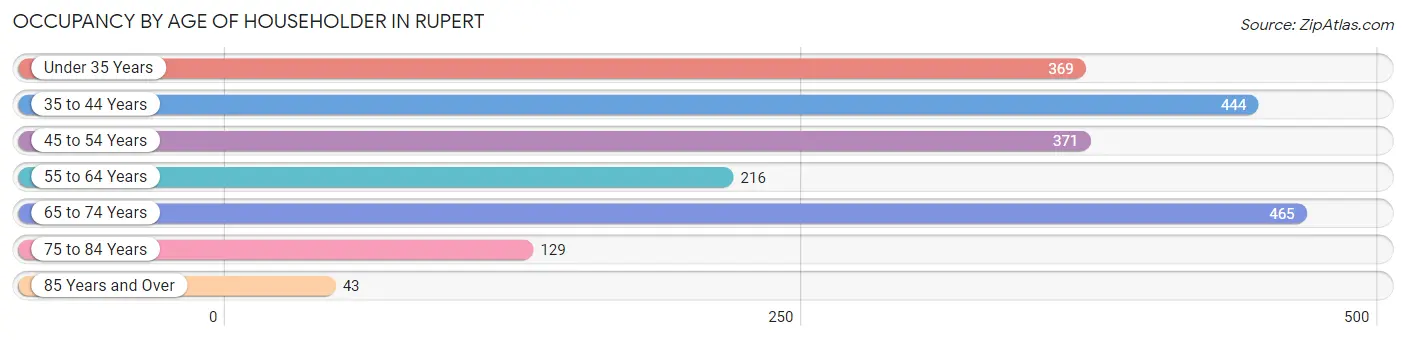
| Age Bracket | # Households | % Households |
| Under 35 Years | 369 | 18.1% |
| 35 to 44 Years | 444 | 21.8% |
| 45 to 54 Years | 371 | 18.2% |
| 55 to 64 Years | 216 | 10.6% |
| 65 to 74 Years | 465 | 22.8% |
| 75 to 84 Years | 129 | 6.3% |
| 85 Years and Over | 43 | 2.1% |
| Total | 2,037 | 100.0% |
Housing Finances in Rupert
Median Income by Occupancy in Rupert
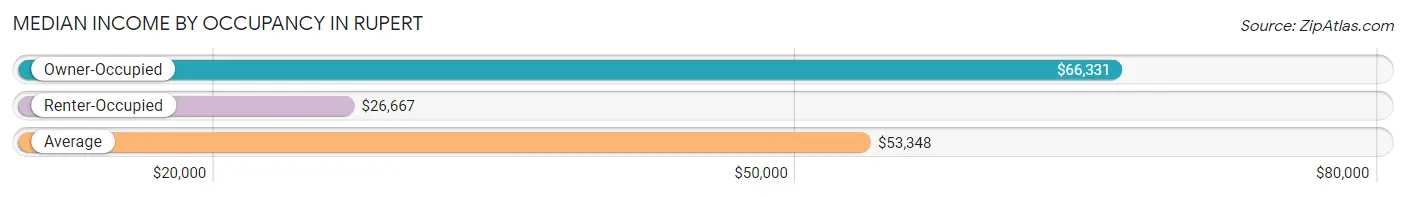
| Occupancy Type | # Households | Median Income |
| Owner-Occupied | 1,467 (72.0%) | $66,331 |
| Renter-Occupied | 570 (28.0%) | $26,667 |
| Average | 2,037 (100.0%) | $53,348 |
Occupancy by Householder Income Bracket in Rupert
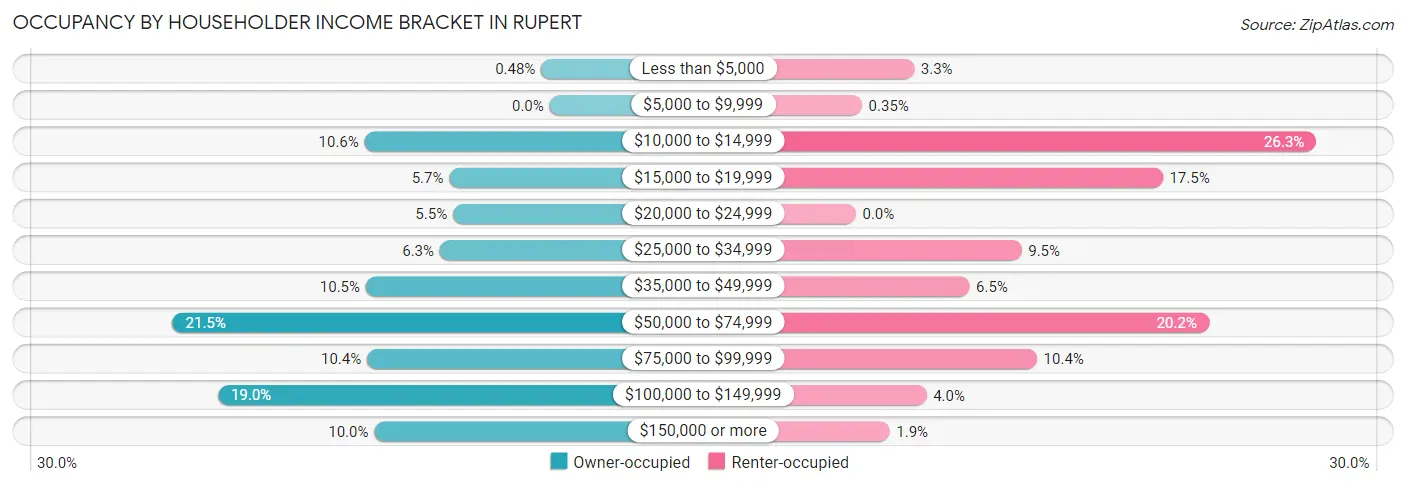
| Income Bracket | Owner-occupied | Renter-occupied |
| Less than $5,000 | 7 (0.5%) | 19 (3.3%) |
| $5,000 to $9,999 | 0 (0.0%) | 2 (0.4%) |
| $10,000 to $14,999 | 155 (10.6%) | 150 (26.3%) |
| $15,000 to $19,999 | 84 (5.7%) | 100 (17.5%) |
| $20,000 to $24,999 | 81 (5.5%) | 0 (0.0%) |
| $25,000 to $34,999 | 92 (6.3%) | 54 (9.5%) |
| $35,000 to $49,999 | 154 (10.5%) | 37 (6.5%) |
| $50,000 to $74,999 | 316 (21.5%) | 115 (20.2%) |
| $75,000 to $99,999 | 153 (10.4%) | 59 (10.3%) |
| $100,000 to $149,999 | 278 (19.0%) | 23 (4.0%) |
| $150,000 or more | 147 (10.0%) | 11 (1.9%) |
| Total | 1,467 (100.0%) | 570 (100.0%) |
Monthly Housing Cost Tiers in Rupert
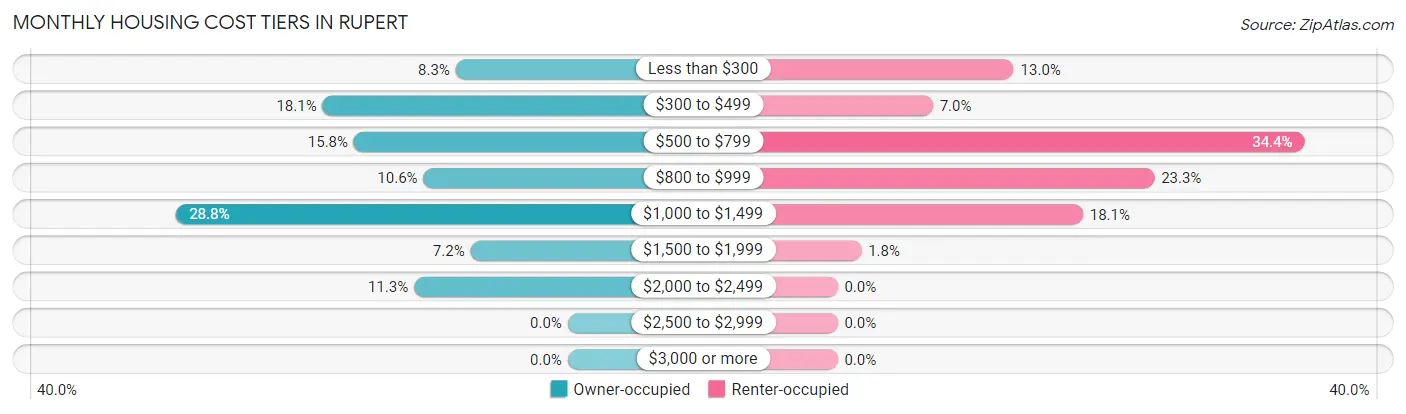
| Monthly Cost | Owner-occupied | Renter-occupied |
| Less than $300 | 121 (8.3%) | 74 (13.0%) |
| $300 to $499 | 265 (18.1%) | 40 (7.0%) |
| $500 to $799 | 231 (15.8%) | 196 (34.4%) |
| $800 to $999 | 156 (10.6%) | 133 (23.3%) |
| $1,000 to $1,499 | 423 (28.8%) | 103 (18.1%) |
| $1,500 to $1,999 | 105 (7.2%) | 10 (1.8%) |
| $2,000 to $2,499 | 166 (11.3%) | 0 (0.0%) |
| $2,500 to $2,999 | 0 (0.0%) | 0 (0.0%) |
| $3,000 or more | 0 (0.0%) | 0 (0.0%) |
| Total | 1,467 (100.0%) | 570 (100.0%) |
Physical Housing Characteristics in Rupert
Housing Structures in Rupert
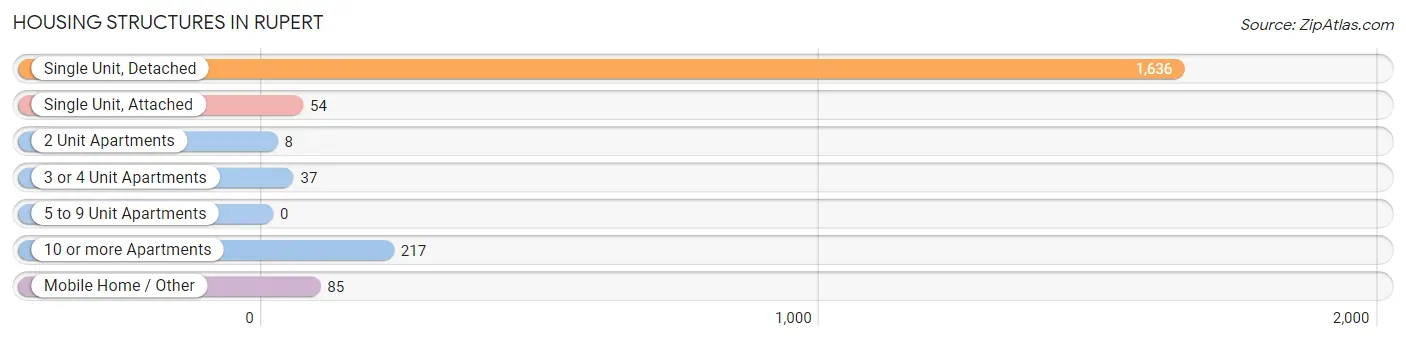
| Structure Type | # Housing Units | % Housing Units |
| Single Unit, Detached | 1,636 | 80.3% |
| Single Unit, Attached | 54 | 2.6% |
| 2 Unit Apartments | 8 | 0.4% |
| 3 or 4 Unit Apartments | 37 | 1.8% |
| 5 to 9 Unit Apartments | 0 | 0.0% |
| 10 or more Apartments | 217 | 10.6% |
| Mobile Home / Other | 85 | 4.2% |
| Total | 2,037 | 100.0% |
Housing Structures by Occupancy in Rupert
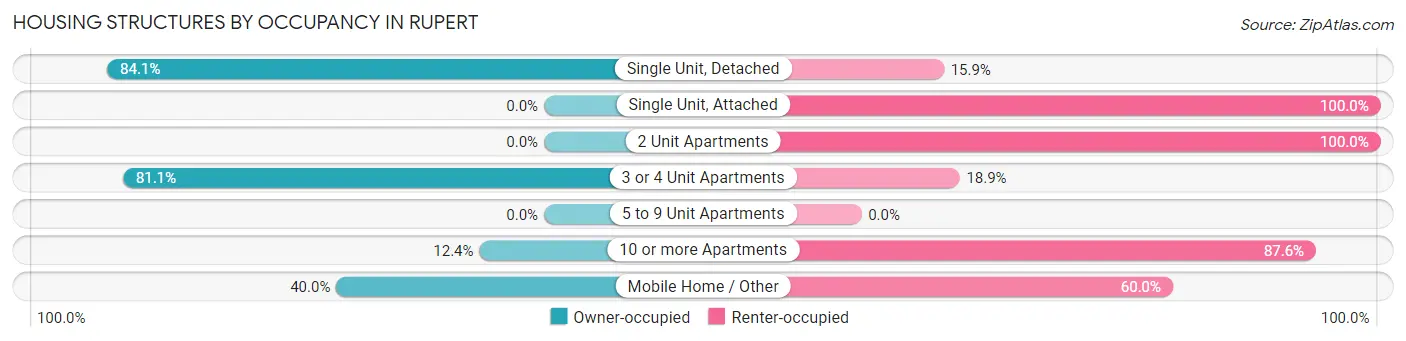
| Structure Type | Owner-occupied | Renter-occupied |
| Single Unit, Detached | 1,376 (84.1%) | 260 (15.9%) |
| Single Unit, Attached | 0 (0.0%) | 54 (100.0%) |
| 2 Unit Apartments | 0 (0.0%) | 8 (100.0%) |
| 3 or 4 Unit Apartments | 30 (81.1%) | 7 (18.9%) |
| 5 to 9 Unit Apartments | 0 (0.0%) | 0 (0.0%) |
| 10 or more Apartments | 27 (12.4%) | 190 (87.6%) |
| Mobile Home / Other | 34 (40.0%) | 51 (60.0%) |
| Total | 1,467 (72.0%) | 570 (28.0%) |
Housing Structures by Number of Rooms in Rupert
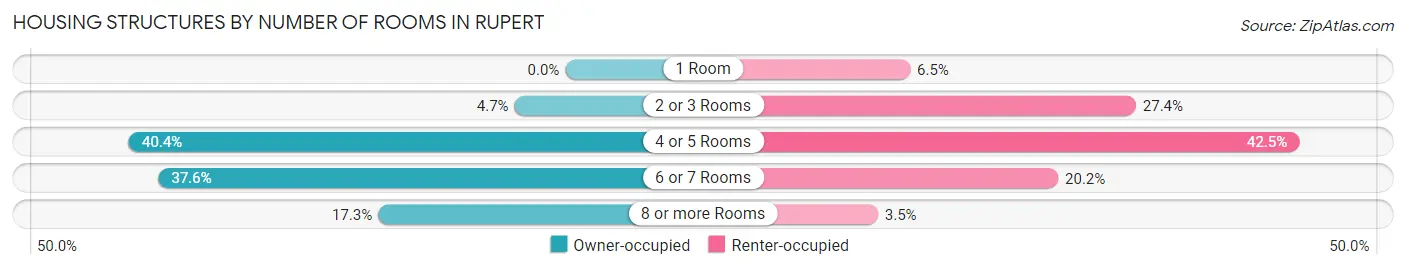
| Number of Rooms | Owner-occupied | Renter-occupied |
| 1 Room | 0 (0.0%) | 37 (6.5%) |
| 2 or 3 Rooms | 69 (4.7%) | 156 (27.4%) |
| 4 or 5 Rooms | 592 (40.4%) | 242 (42.5%) |
| 6 or 7 Rooms | 552 (37.6%) | 115 (20.2%) |
| 8 or more Rooms | 254 (17.3%) | 20 (3.5%) |
| Total | 1,467 (100.0%) | 570 (100.0%) |
Housing Structure by Heating Type in Rupert
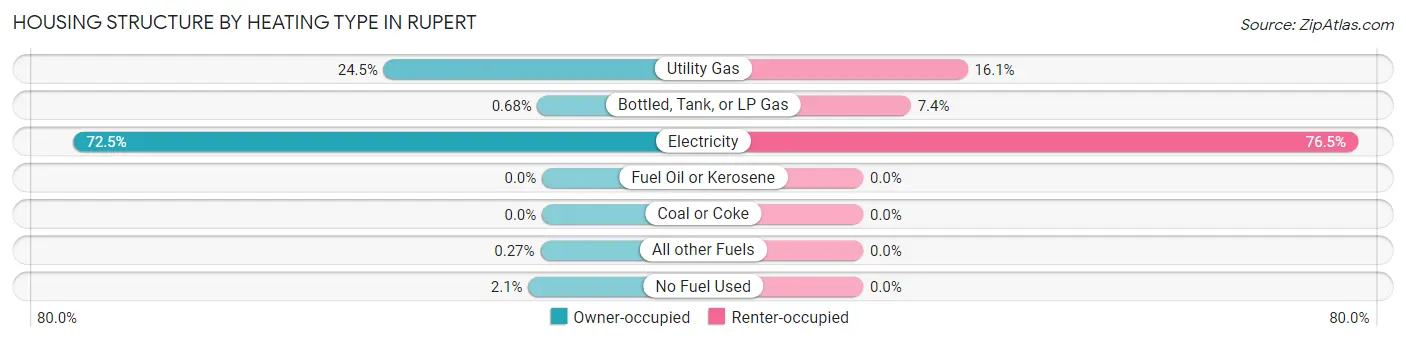
| Heating Type | Owner-occupied | Renter-occupied |
| Utility Gas | 359 (24.5%) | 92 (16.1%) |
| Bottled, Tank, or LP Gas | 10 (0.7%) | 42 (7.4%) |
| Electricity | 1,063 (72.5%) | 436 (76.5%) |
| Fuel Oil or Kerosene | 0 (0.0%) | 0 (0.0%) |
| Coal or Coke | 0 (0.0%) | 0 (0.0%) |
| All other Fuels | 4 (0.3%) | 0 (0.0%) |
| No Fuel Used | 31 (2.1%) | 0 (0.0%) |
| Total | 1,467 (100.0%) | 570 (100.0%) |
Household Vehicle Usage in Rupert
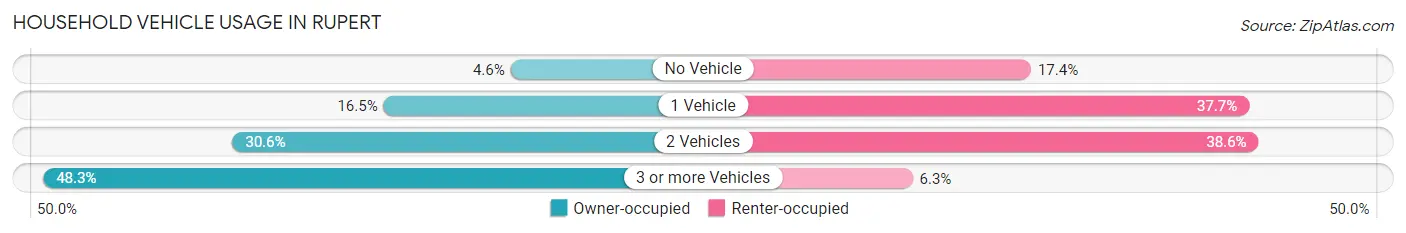
| Vehicles per Household | Owner-occupied | Renter-occupied |
| No Vehicle | 68 (4.6%) | 99 (17.4%) |
| 1 Vehicle | 242 (16.5%) | 215 (37.7%) |
| 2 Vehicles | 449 (30.6%) | 220 (38.6%) |
| 3 or more Vehicles | 708 (48.3%) | 36 (6.3%) |
| Total | 1,467 (100.0%) | 570 (100.0%) |
Real Estate & Mortgages in Rupert
Real Estate and Mortgage Overview in Rupert
| Characteristic | Without Mortgage | With Mortgage |
| Housing Units | 539 | 928 |
| Median Property Value | $156,600 | $157,700 |
| Median Household Income | $42,019 | $121 |
| Monthly Housing Costs | $384 | $0 |
| Real Estate Taxes | $792 | $11 |
Property Value by Mortgage Status in Rupert
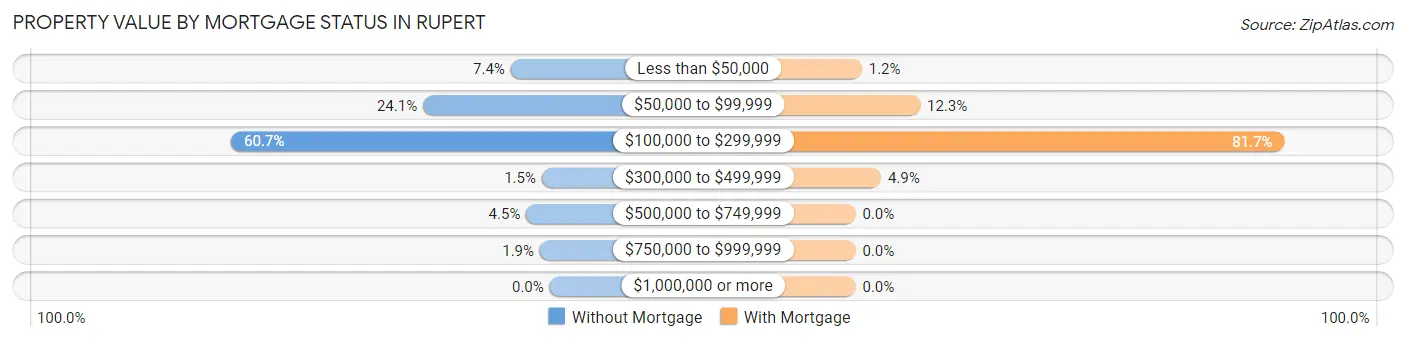
| Property Value | Without Mortgage | With Mortgage |
| Less than $50,000 | 40 (7.4%) | 11 (1.2%) |
| $50,000 to $99,999 | 130 (24.1%) | 114 (12.3%) |
| $100,000 to $299,999 | 327 (60.7%) | 758 (81.7%) |
| $300,000 to $499,999 | 8 (1.5%) | 45 (4.9%) |
| $500,000 to $749,999 | 24 (4.4%) | 0 (0.0%) |
| $750,000 to $999,999 | 10 (1.9%) | 0 (0.0%) |
| $1,000,000 or more | 0 (0.0%) | 0 (0.0%) |
| Total | 539 (100.0%) | 928 (100.0%) |
Household Income by Mortgage Status in Rupert
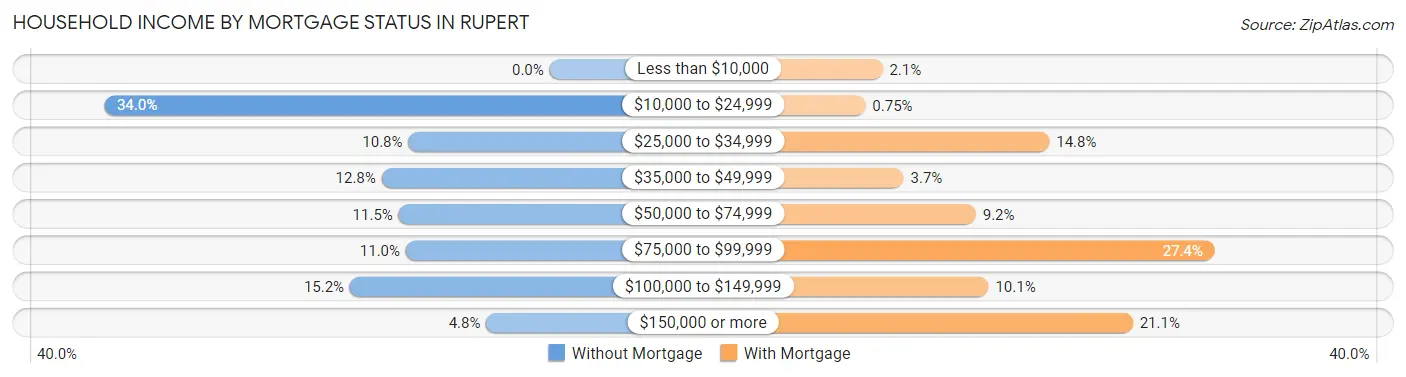
| Household Income | Without Mortgage | With Mortgage |
| Less than $10,000 | 0 (0.0%) | 19 (2.1%) |
| $10,000 to $24,999 | 183 (34.0%) | 7 (0.7%) |
| $25,000 to $34,999 | 58 (10.8%) | 137 (14.8%) |
| $35,000 to $49,999 | 69 (12.8%) | 34 (3.7%) |
| $50,000 to $74,999 | 62 (11.5%) | 85 (9.2%) |
| $75,000 to $99,999 | 59 (11.0%) | 254 (27.4%) |
| $100,000 to $149,999 | 82 (15.2%) | 94 (10.1%) |
| $150,000 or more | 26 (4.8%) | 196 (21.1%) |
| Total | 539 (100.0%) | 928 (100.0%) |
Property Value to Household Income Ratio in Rupert
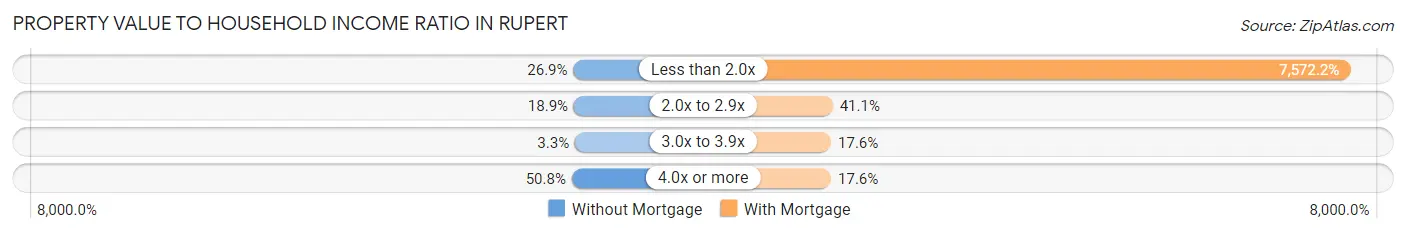
| Value-to-Income Ratio | Without Mortgage | With Mortgage |
| Less than 2.0x | 145 (26.9%) | 70,270 (7,572.2%) |
| 2.0x to 2.9x | 102 (18.9%) | 381 (41.1%) |
| 3.0x to 3.9x | 18 (3.3%) | 163 (17.6%) |
| 4.0x or more | 274 (50.8%) | 163 (17.6%) |
| Total | 539 (100.0%) | 928 (100.0%) |
Real Estate Taxes by Mortgage Status in Rupert
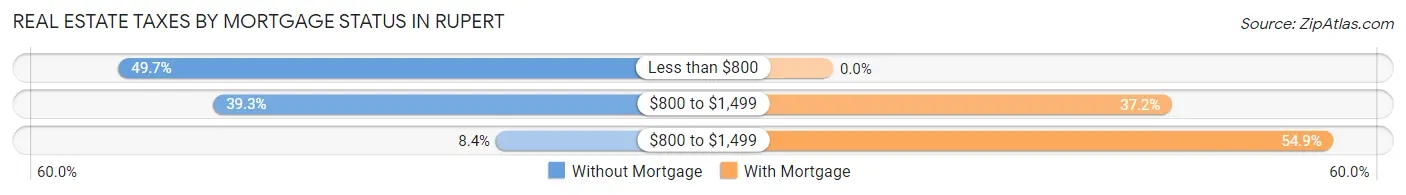
| Property Taxes | Without Mortgage | With Mortgage |
| Less than $800 | 268 (49.7%) | 0 (0.0%) |
| $800 to $1,499 | 212 (39.3%) | 345 (37.2%) |
| $800 to $1,499 | 45 (8.4%) | 509 (54.8%) |
| Total | 539 (100.0%) | 928 (100.0%) |
Health & Disability in Rupert
Health Insurance Coverage by Age in Rupert
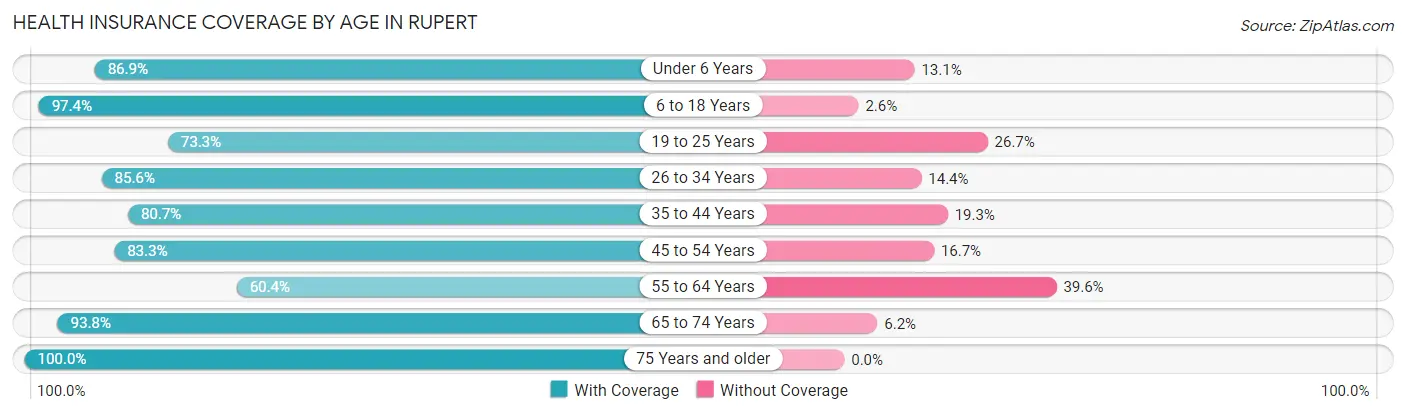
| Age Bracket | With Coverage | Without Coverage |
| Under 6 Years | 458 (86.9%) | 69 (13.1%) |
| 6 to 18 Years | 1,219 (97.4%) | 33 (2.6%) |
| 19 to 25 Years | 510 (73.3%) | 186 (26.7%) |
| 26 to 34 Years | 566 (85.6%) | 95 (14.4%) |
| 35 to 44 Years | 628 (80.7%) | 150 (19.3%) |
| 45 to 54 Years | 513 (83.3%) | 103 (16.7%) |
| 55 to 64 Years | 333 (60.4%) | 218 (39.6%) |
| 65 to 74 Years | 625 (93.8%) | 41 (6.2%) |
| 75 Years and older | 263 (100.0%) | 0 (0.0%) |
| Total | 5,115 (85.1%) | 895 (14.9%) |
Health Insurance Coverage by Citizenship Status in Rupert
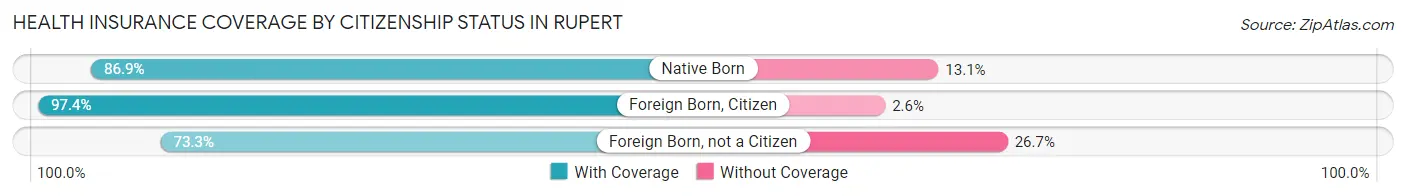
| Citizenship Status | With Coverage | Without Coverage |
| Native Born | 458 (86.9%) | 69 (13.1%) |
| Foreign Born, Citizen | 1,219 (97.4%) | 33 (2.6%) |
| Foreign Born, not a Citizen | 510 (73.3%) | 186 (26.7%) |
Health Insurance Coverage by Household Income in Rupert
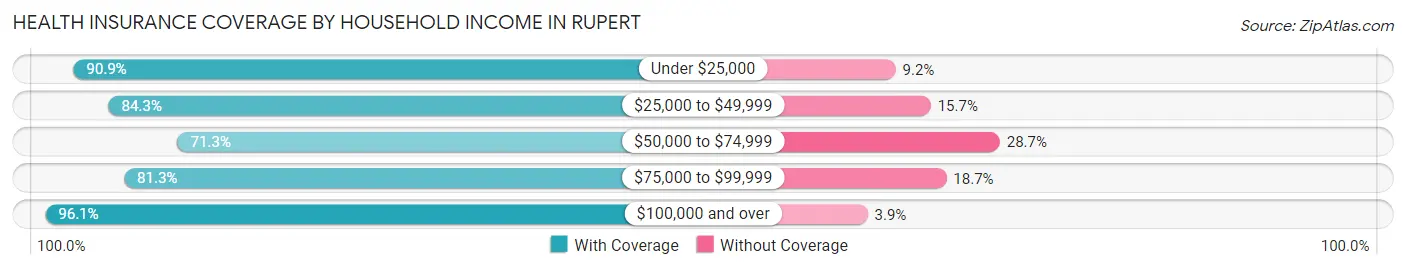
| Household Income | With Coverage | Without Coverage |
| Under $25,000 | 1,043 (90.8%) | 105 (9.1%) |
| $25,000 to $49,999 | 718 (84.3%) | 134 (15.7%) |
| $50,000 to $74,999 | 1,092 (71.3%) | 439 (28.7%) |
| $75,000 to $99,999 | 645 (81.3%) | 148 (18.7%) |
| $100,000 and over | 1,606 (96.1%) | 65 (3.9%) |
Public vs Private Health Insurance Coverage by Age in Rupert
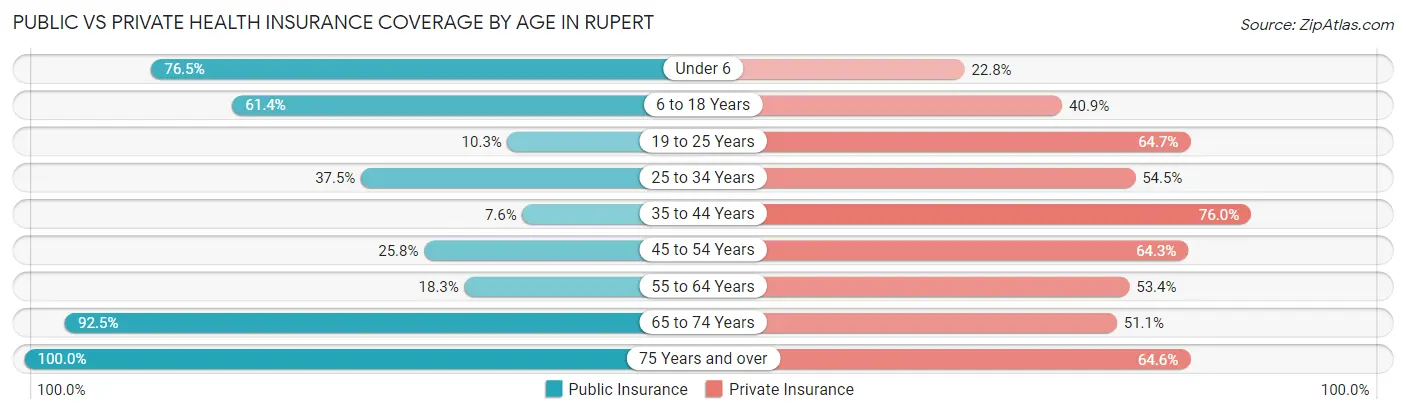
| Age Bracket | Public Insurance | Private Insurance |
| Under 6 | 403 (76.5%) | 120 (22.8%) |
| 6 to 18 Years | 769 (61.4%) | 512 (40.9%) |
| 19 to 25 Years | 72 (10.3%) | 450 (64.7%) |
| 25 to 34 Years | 248 (37.5%) | 360 (54.5%) |
| 35 to 44 Years | 59 (7.6%) | 591 (76.0%) |
| 45 to 54 Years | 159 (25.8%) | 396 (64.3%) |
| 55 to 64 Years | 101 (18.3%) | 294 (53.4%) |
| 65 to 74 Years | 616 (92.5%) | 340 (51.0%) |
| 75 Years and over | 263 (100.0%) | 170 (64.6%) |
| Total | 2,690 (44.8%) | 3,233 (53.8%) |
Disability Status by Sex by Age in Rupert
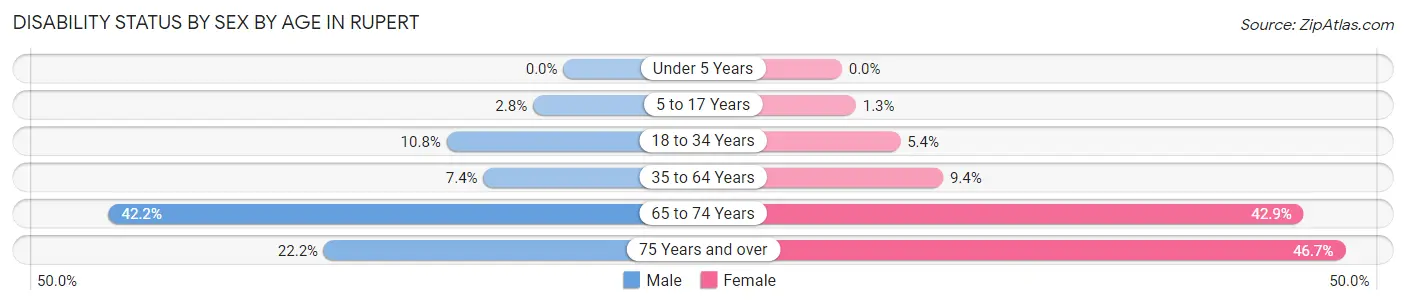
| Age Bracket | Male | Female |
| Under 5 Years | 0 (0.0%) | 0 (0.0%) |
| 5 to 17 Years | 19 (2.8%) | 8 (1.3%) |
| 18 to 34 Years | 72 (10.8%) | 42 (5.4%) |
| 35 to 64 Years | 74 (7.4%) | 89 (9.4%) |
| 65 to 74 Years | 157 (42.2%) | 126 (42.9%) |
| 75 Years and over | 28 (22.2%) | 64 (46.7%) |
Disability Class by Sex by Age in Rupert
Disability Class: Hearing Difficulty
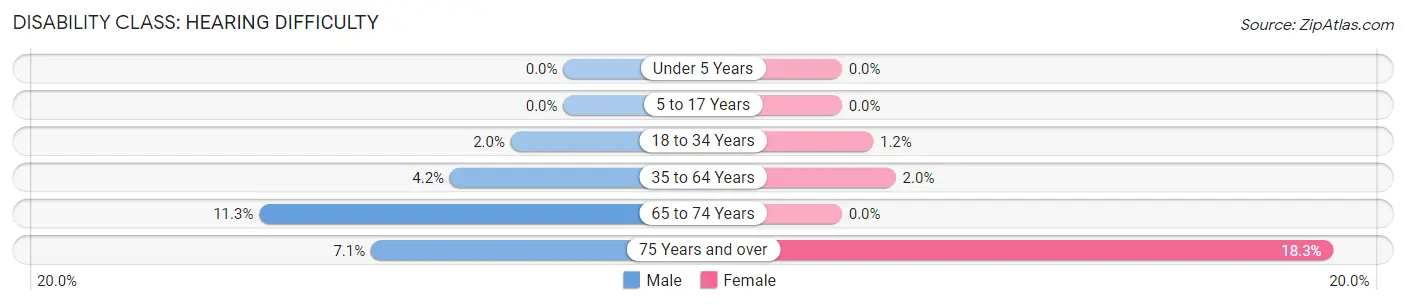
| Age Bracket | Male | Female |
| Under 5 Years | 0 (0.0%) | 0 (0.0%) |
| 5 to 17 Years | 0 (0.0%) | 0 (0.0%) |
| 18 to 34 Years | 13 (1.9%) | 9 (1.2%) |
| 35 to 64 Years | 42 (4.2%) | 19 (2.0%) |
| 65 to 74 Years | 42 (11.3%) | 0 (0.0%) |
| 75 Years and over | 9 (7.1%) | 25 (18.2%) |
Disability Class: Vision Difficulty
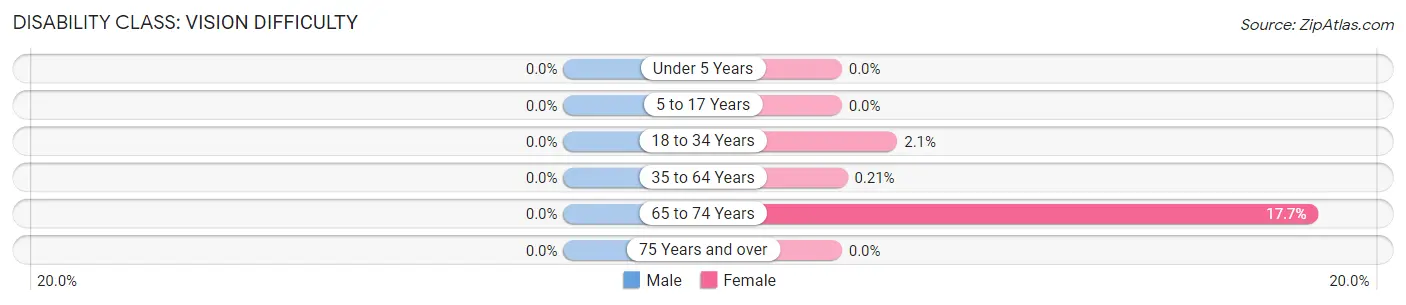
| Age Bracket | Male | Female |
| Under 5 Years | 0 (0.0%) | 0 (0.0%) |
| 5 to 17 Years | 0 (0.0%) | 0 (0.0%) |
| 18 to 34 Years | 0 (0.0%) | 16 (2.1%) |
| 35 to 64 Years | 0 (0.0%) | 2 (0.2%) |
| 65 to 74 Years | 0 (0.0%) | 52 (17.7%) |
| 75 Years and over | 0 (0.0%) | 0 (0.0%) |
Disability Class: Cognitive Difficulty
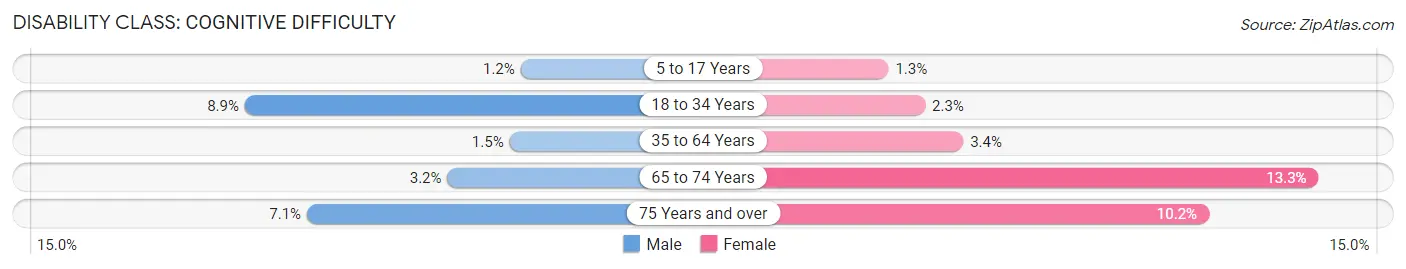
| Age Bracket | Male | Female |
| 5 to 17 Years | 8 (1.2%) | 8 (1.3%) |
| 18 to 34 Years | 59 (8.9%) | 18 (2.3%) |
| 35 to 64 Years | 15 (1.5%) | 32 (3.4%) |
| 65 to 74 Years | 12 (3.2%) | 39 (13.3%) |
| 75 Years and over | 9 (7.1%) | 14 (10.2%) |
Disability Class: Ambulatory Difficulty
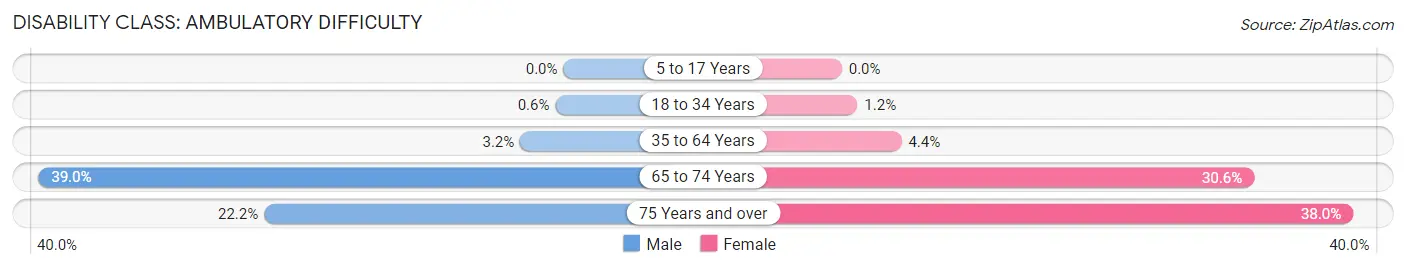
| Age Bracket | Male | Female |
| 5 to 17 Years | 0 (0.0%) | 0 (0.0%) |
| 18 to 34 Years | 4 (0.6%) | 9 (1.2%) |
| 35 to 64 Years | 32 (3.2%) | 42 (4.4%) |
| 65 to 74 Years | 145 (39.0%) | 90 (30.6%) |
| 75 Years and over | 28 (22.2%) | 52 (38.0%) |
Disability Class: Self-Care Difficulty
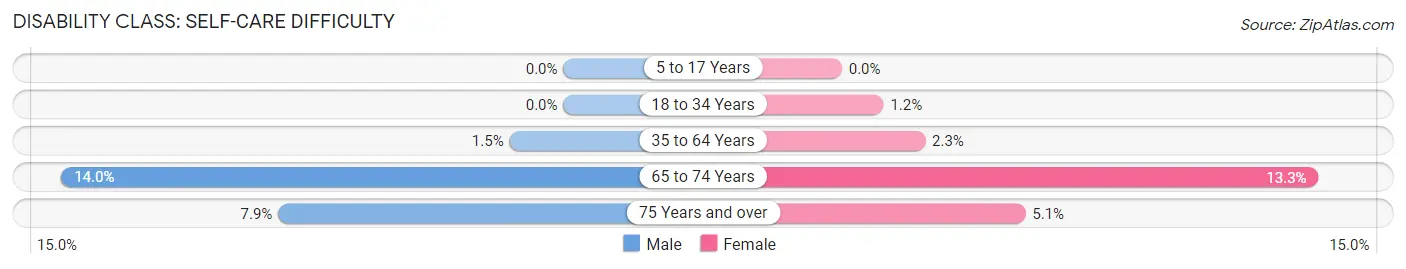
| Age Bracket | Male | Female |
| 5 to 17 Years | 0 (0.0%) | 0 (0.0%) |
| 18 to 34 Years | 0 (0.0%) | 9 (1.2%) |
| 35 to 64 Years | 15 (1.5%) | 22 (2.3%) |
| 65 to 74 Years | 52 (14.0%) | 39 (13.3%) |
| 75 Years and over | 10 (7.9%) | 7 (5.1%) |
Technology Access in Rupert
Computing Device Access in Rupert
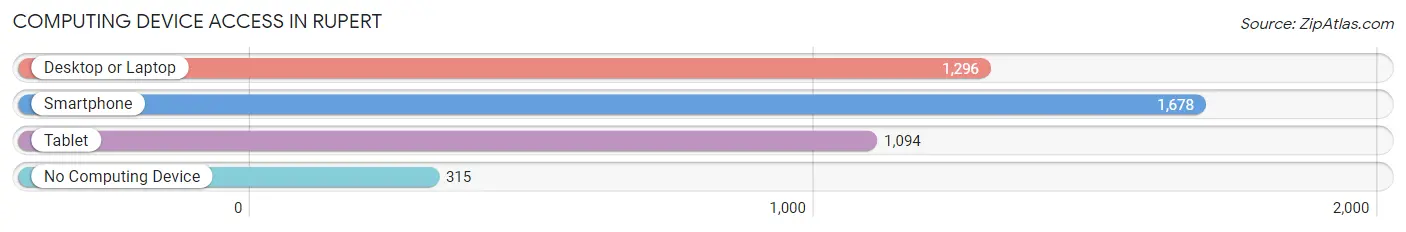
| Device Type | # Households | % Households |
| Desktop or Laptop | 1,296 | 63.6% |
| Smartphone | 1,678 | 82.4% |
| Tablet | 1,094 | 53.7% |
| No Computing Device | 315 | 15.5% |
| Total | 2,037 | 100.0% |
Internet Access in Rupert
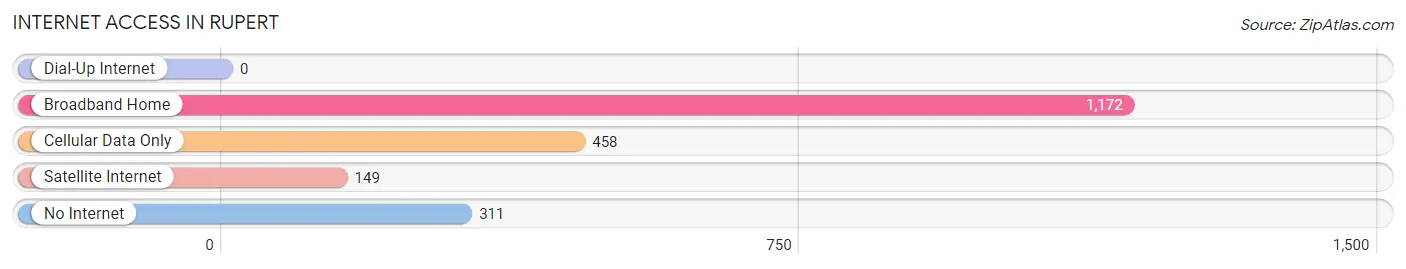
| Internet Type | # Households | % Households |
| Dial-Up Internet | 0 | 0.0% |
| Broadband Home | 1,172 | 57.5% |
| Cellular Data Only | 458 | 22.5% |
| Satellite Internet | 149 | 7.3% |
| No Internet | 311 | 15.3% |
| Total | 2,037 | 100.0% |
Rupert Summary
Rupert, Idaho is a small city located in the southeastern corner of the state, near the Utah border. It is the county seat of Minidoka County and is part of the Twin Falls Metropolitan Statistical Area. The city was founded in 1905 and has a population of 5,717 as of the 2010 census.
History
Rupert was founded in 1905 by the Oregon Short Line Railroad. The city was named after a railroad official, Rupert N. Richardson. The city was incorporated in 1907 and was the first city in Minidoka County.
Rupert was a major agricultural center in the early 20th century, with many farmers growing sugar beets, potatoes, and other crops. The city was also home to a large sugar beet processing plant, which was built in 1906 and operated until the late 1970s.
Geography
Rupert is located in the southeastern corner of Idaho, near the Utah border. It is situated in the Snake River Plain, a large area of flat land that stretches across southern Idaho. The city is located at an elevation of 4,092 feet (1,248 m).
The city is located in Minidoka County, which is bordered by Cassia County to the north, Twin Falls County to the east, and Lincoln County to the south. The city is located about 30 miles (48 km) west of Twin Falls, the largest city in the area.
Economy
Rupert’s economy is largely based on agriculture. The city is home to several large farms that grow potatoes, sugar beets, and other crops. The city is also home to several food processing plants, including a potato processing plant and a sugar beet processing plant.
The city is also home to several manufacturing companies, including a plastics manufacturer and a metal fabrication company. The city is also home to several retail stores, including a Walmart Supercenter.
Demographics
As of the 2010 census, Rupert had a population of 5,717. The racial makeup of the city was 87.3% White, 0.7% African American, 0.7% Native American, 0.3% Asian, 0.1% Pacific Islander, 8.7% from other races, and 2.1% from two or more races. Hispanic or Latino of any race were 16.2% of the population.
The median income for a household in the city was $35,938, and the median income for a family was $41,944. The per capita income for the city was $17,845. About 14.2% of families and 17.3% of the population were below the poverty line, including 22.3% of those under age 18 and 8.2% of those age 65 or over.
Common Questions
What is Per Capita Income in Rupert?
Per Capita income in Rupert is $23,321.
What is the Median Family Income in Rupert?
Median Family Income in Rupert is $66,684.
What is the Median Household income in Rupert?
Median Household Income in Rupert is $53,348.
What is Income or Wage Gap in Rupert?
Income or Wage Gap in Rupert is 49.4%.
Women in Rupert earn 50.6 cents for every dollar earned by a man.
What is Inequality or Gini Index in Rupert?
Inequality or Gini Index in Rupert is 0.42.
What is the Total Population of Rupert?
Total Population of Rupert is 6,066.
What is the Total Male Population of Rupert?
Total Male Population of Rupert is 3,173.
What is the Total Female Population of Rupert?
Total Female Population of Rupert is 2,893.
What is the Ratio of Males per 100 Females in Rupert?
There are 109.68 Males per 100 Females in Rupert.
What is the Ratio of Females per 100 Males in Rupert?
There are 91.18 Females per 100 Males in Rupert.
What is the Median Population Age in Rupert?
Median Population Age in Rupert is 34.1 Years.
What is the Average Family Size in Rupert
Average Family Size in Rupert is 3.5 People.
What is the Average Household Size in Rupert
Average Household Size in Rupert is 2.9 People.
How Large is the Labor Force in Rupert?
There are 2,933 People in the Labor Forcein in Rupert.
What is the Percentage of People in the Labor Force in Rupert?
64.8% of People are in the Labor Force in Rupert.
What is the Unemployment Rate in Rupert?
Unemployment Rate in Rupert is 2.9%.