Kootenai, ID Map & Demographics
Kootenai Map
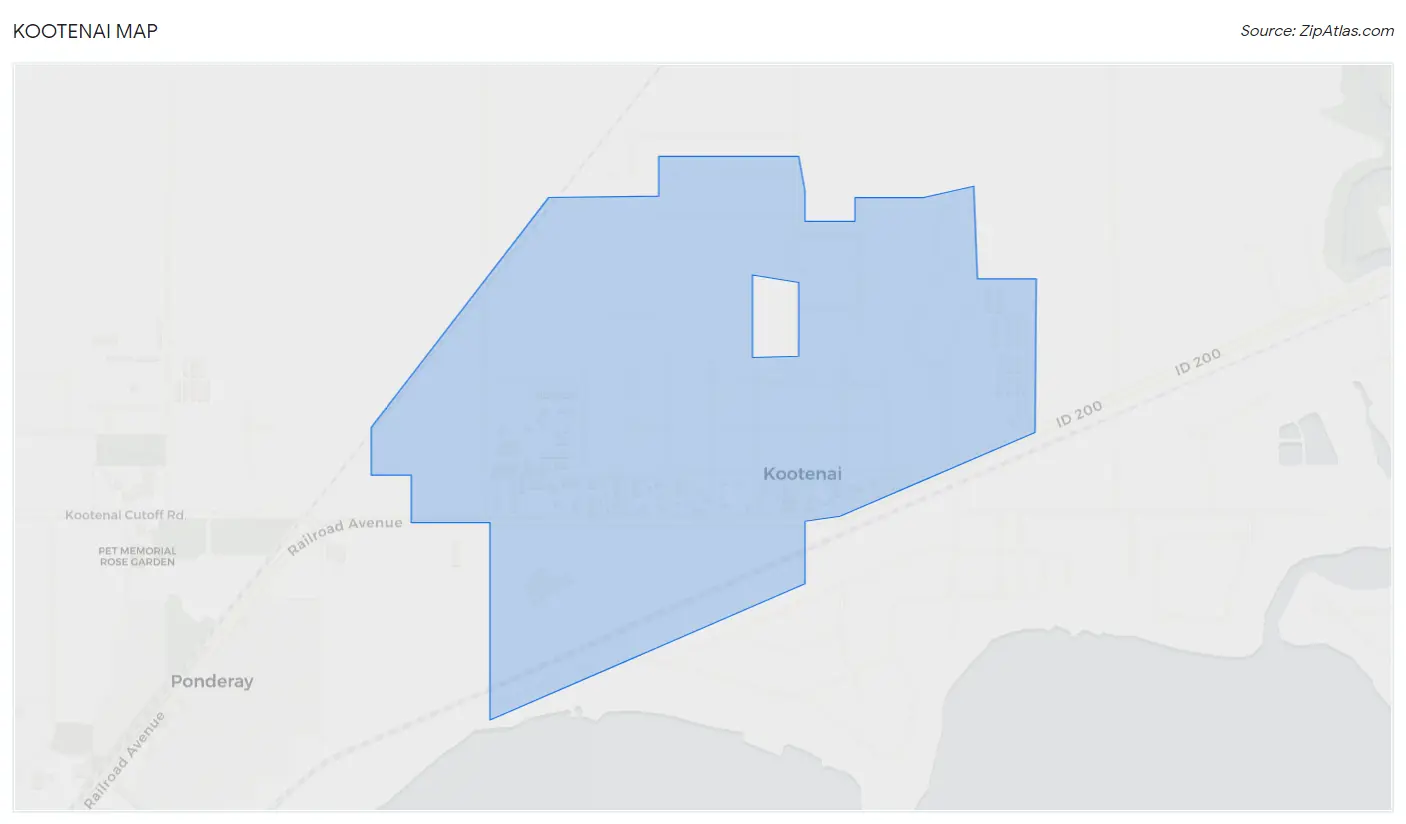
Kootenai Overview
$30,101
PER CAPITA INCOME
$76,667
AVG FAMILY INCOME
$68,750
AVG HOUSEHOLD INCOME
32.0%
WAGE / INCOME GAP [ % ]
68.0¢/ $1
WAGE / INCOME GAP [ $ ]
0.35
INEQUALITY / GINI INDEX
1,152
TOTAL POPULATION
555
MALE POPULATION
597
FEMALE POPULATION
92.96
MALES / 100 FEMALES
107.57
FEMALES / 100 MALES
36.4
MEDIAN AGE
3.1
AVG FAMILY SIZE
2.6
AVG HOUSEHOLD SIZE
618
LABOR FORCE [ PEOPLE ]
67.8%
PERCENT IN LABOR FORCE
4.7%
UNEMPLOYMENT RATE
Kootenai Zip Codes
Kootenai Area Codes
Income in Kootenai
Income Overview in Kootenai
Per Capita Income in Kootenai is $30,101, while median incomes of families and households are $76,667 and $68,750 respectively.
| Characteristic | Number | Measure |
| Per Capita Income | 1,152 | $30,101 |
| Median Family Income | 268 | $76,667 |
| Mean Family Income | 268 | $77,910 |
| Median Household Income | 422 | $68,750 |
| Mean Household Income | 422 | $77,687 |
| Income Deficit | 268 | $0 |
| Wage / Income Gap (%) | 1,152 | 32.01% |
| Wage / Income Gap ($) | 1,152 | 67.99¢ per $1 |
| Gini / Inequality Index | 1,152 | 0.35 |
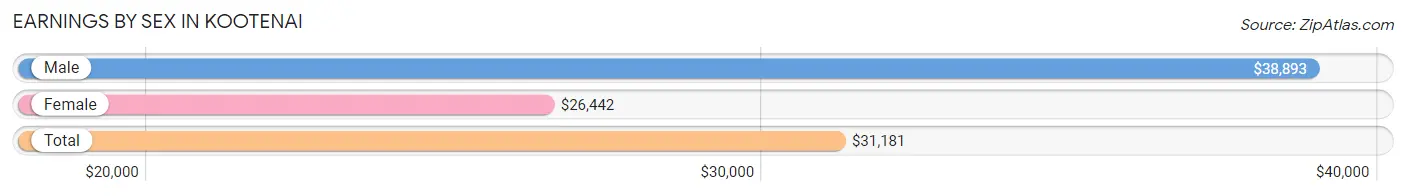
Earnings by Sex in Kootenai
Average Earnings in Kootenai are $31,181, $38,893 for men and $26,442 for women, a difference of 32.0%.
| Sex | Number | Average Earnings |
| Male | 307 (47.4%) | $38,893 |
| Female | 340 (52.5%) | $26,442 |
| Total | 647 (100.0%) | $31,181 |
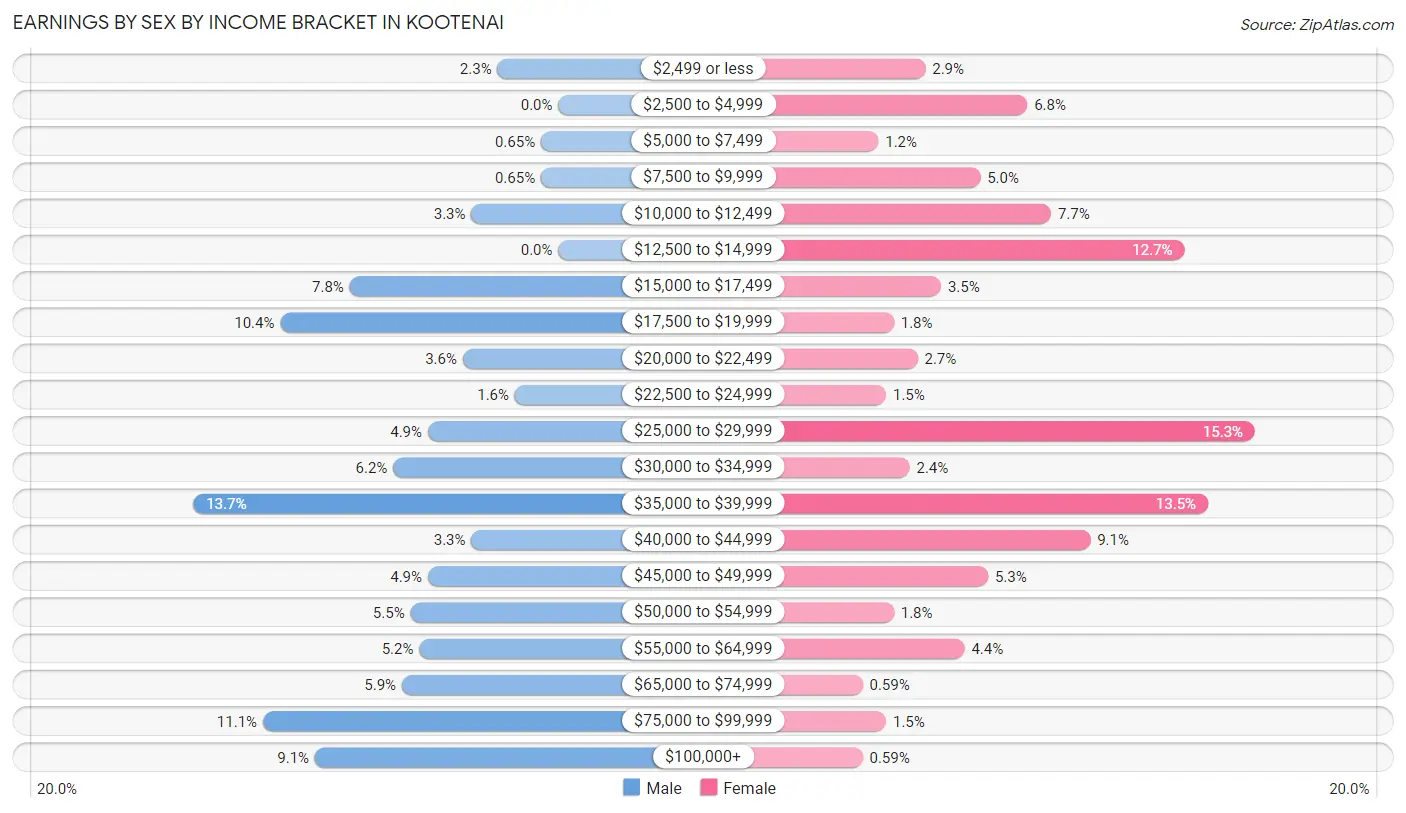
Earnings by Sex by Income Bracket in Kootenai
The most common earnings brackets in Kootenai are $35,000 to $39,999 for men (42 | 13.7%) and $25,000 to $29,999 for women (52 | 15.3%).
| Income | Male | Female |
| $2,499 or less | 7 (2.3%) | 10 (2.9%) |
| $2,500 to $4,999 | 0 (0.0%) | 23 (6.8%) |
| $5,000 to $7,499 | 2 (0.6%) | 4 (1.2%) |
| $7,500 to $9,999 | 2 (0.6%) | 17 (5.0%) |
| $10,000 to $12,499 | 10 (3.3%) | 26 (7.6%) |
| $12,500 to $14,999 | 0 (0.0%) | 43 (12.7%) |
| $15,000 to $17,499 | 24 (7.8%) | 12 (3.5%) |
| $17,500 to $19,999 | 32 (10.4%) | 6 (1.8%) |
| $20,000 to $22,499 | 11 (3.6%) | 9 (2.6%) |
| $22,500 to $24,999 | 5 (1.6%) | 5 (1.5%) |
| $25,000 to $29,999 | 15 (4.9%) | 52 (15.3%) |
| $30,000 to $34,999 | 19 (6.2%) | 8 (2.4%) |
| $35,000 to $39,999 | 42 (13.7%) | 46 (13.5%) |
| $40,000 to $44,999 | 10 (3.3%) | 31 (9.1%) |
| $45,000 to $49,999 | 15 (4.9%) | 18 (5.3%) |
| $50,000 to $54,999 | 17 (5.5%) | 6 (1.8%) |
| $55,000 to $64,999 | 16 (5.2%) | 15 (4.4%) |
| $65,000 to $74,999 | 18 (5.9%) | 2 (0.6%) |
| $75,000 to $99,999 | 34 (11.1%) | 5 (1.5%) |
| $100,000+ | 28 (9.1%) | 2 (0.6%) |
| Total | 307 (100.0%) | 340 (100.0%) |
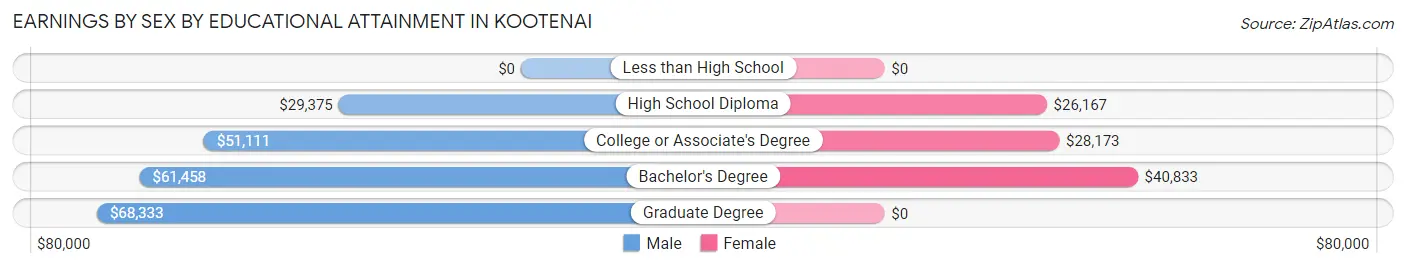
Earnings by Sex by Educational Attainment in Kootenai
Average earnings in Kootenai are $39,429 for men and $27,788 for women, a difference of 29.5%. Men with an educational attainment of graduate degree enjoy the highest average annual earnings of $68,333, while those with high school diploma education earn the least with $29,375. Women with an educational attainment of bachelor's degree earn the most with the average annual earnings of $40,833, while those with high school diploma education have the smallest earnings of $26,167.
| Educational Attainment | Male Income | Female Income |
| Less than High School | - | - |
| High School Diploma | $29,375 | $26,167 |
| College or Associate's Degree | $51,111 | $28,173 |
| Bachelor's Degree | $61,458 | $40,833 |
| Graduate Degree | $68,333 | $0 |
| Total | $39,429 | $27,788 |
Family Income in Kootenai
Family Income Brackets in Kootenai
According to the Kootenai family income data, there are 87 families falling into the $75,000 to $99,999 income range, which is the most common income bracket and makes up 32.5% of all families. Conversely, the $15,000 to $24,999 income bracket is the least frequent group with only 3 families (1.1%) belonging to this category.
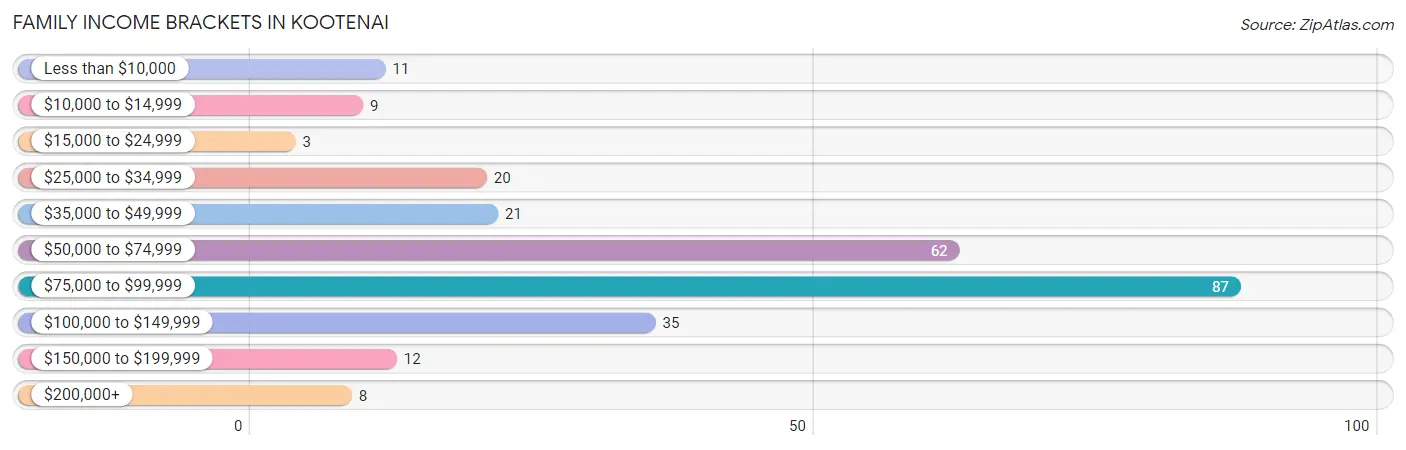
| Income Bracket | # Families | % Families |
| Less than $10,000 | 11 | 4.1% |
| $10,000 to $14,999 | 9 | 3.4% |
| $15,000 to $24,999 | 3 | 1.1% |
| $25,000 to $34,999 | 20 | 7.5% |
| $35,000 to $49,999 | 21 | 7.8% |
| $50,000 to $74,999 | 62 | 23.1% |
| $75,000 to $99,999 | 87 | 32.5% |
| $100,000 to $149,999 | 35 | 13.1% |
| $150,000 to $199,999 | 12 | 4.5% |
| $200,000+ | 8 | 3.0% |
Family Income by Famaliy Size in Kootenai
4-person families (44 | 16.4%) account for the highest median family income in Kootenai with $77,917 per family, while 2-person families (158 | 59.0%) have the highest median income of $38,125 per family member.
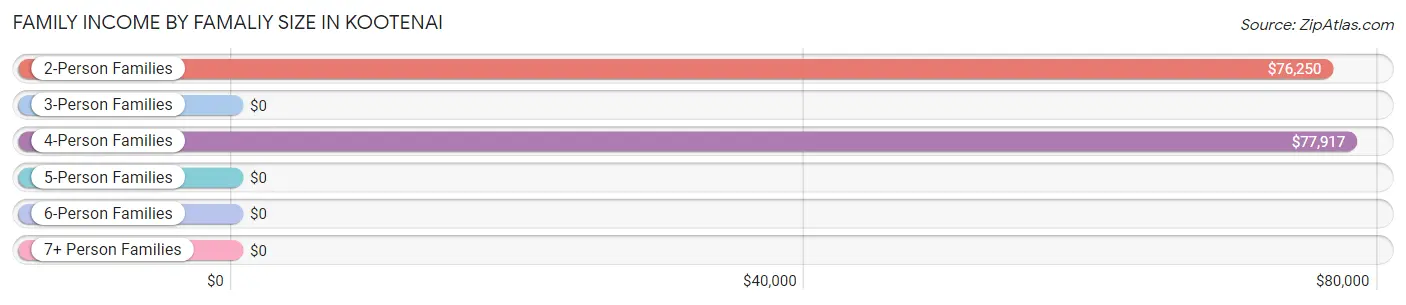
| Income Bracket | # Families | Median Income |
| 2-Person Families | 158 (59.0%) | $76,250 |
| 3-Person Families | 35 (13.1%) | $0 |
| 4-Person Families | 44 (16.4%) | $77,917 |
| 5-Person Families | 14 (5.2%) | $0 |
| 6-Person Families | 11 (4.1%) | $0 |
| 7+ Person Families | 6 (2.2%) | $0 |
| Total | 268 (100.0%) | $76,667 |
Family Income by Number of Earners in Kootenai
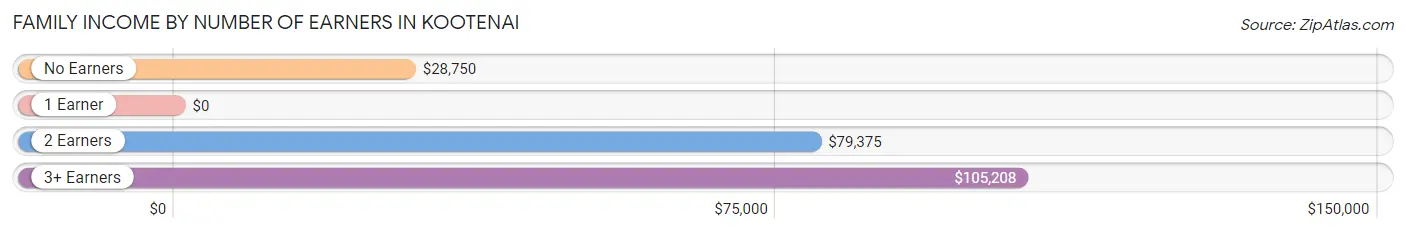
| Number of Earners | # Families | Median Income |
| No Earners | 38 (14.2%) | $28,750 |
| 1 Earner | 65 (24.2%) | $0 |
| 2 Earners | 144 (53.7%) | $79,375 |
| 3+ Earners | 21 (7.8%) | $105,208 |
| Total | 268 (100.0%) | $76,667 |
Household Income in Kootenai
Household Income Brackets in Kootenai
With 87 households falling in the category, the $50,000 to $74,999 income range is the most frequent in Kootenai, accounting for 20.6% of all households. In contrast, only 10 households (2.4%) fall into the less than $10,000 income bracket, making it the least populous group.
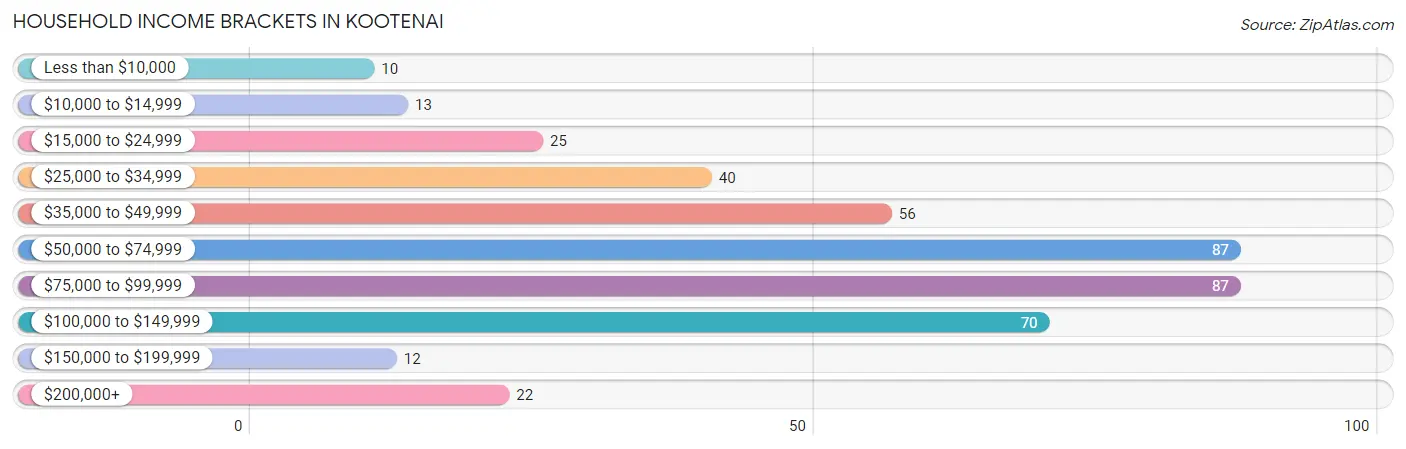
| Income Bracket | # Households | % Households |
| Less than $10,000 | 10 | 2.4% |
| $10,000 to $14,999 | 13 | 3.1% |
| $15,000 to $24,999 | 25 | 5.9% |
| $25,000 to $34,999 | 40 | 9.5% |
| $35,000 to $49,999 | 56 | 13.3% |
| $50,000 to $74,999 | 87 | 20.6% |
| $75,000 to $99,999 | 87 | 20.6% |
| $100,000 to $149,999 | 70 | 16.6% |
| $150,000 to $199,999 | 12 | 2.8% |
| $200,000+ | 22 | 5.2% |
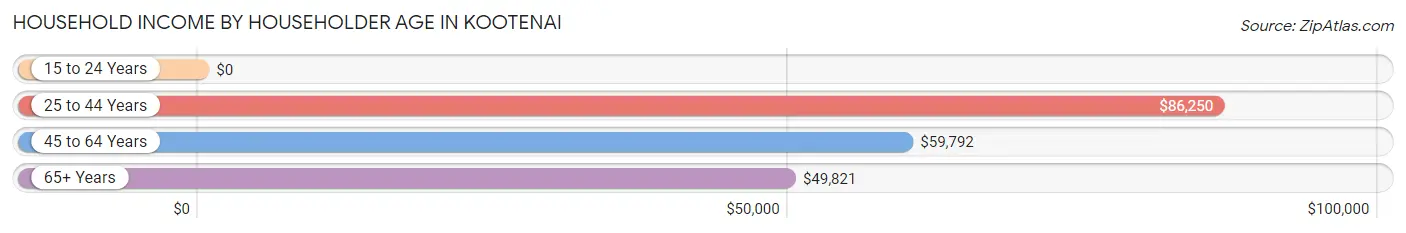
Household Income by Householder Age in Kootenai
The median household income in Kootenai is $68,750, with the highest median household income of $86,250 found in the 25 to 44 years age bracket for the primary householder. A total of 155 households (36.7%) fall into this category.
| Income Bracket | # Households | Median Income |
| 15 to 24 Years | 0 (0.0%) | $0 |
| 25 to 44 Years | 155 (36.7%) | $86,250 |
| 45 to 64 Years | 126 (29.9%) | $59,792 |
| 65+ Years | 141 (33.4%) | $49,821 |
| Total | 422 (100.0%) | $68,750 |
Poverty in Kootenai
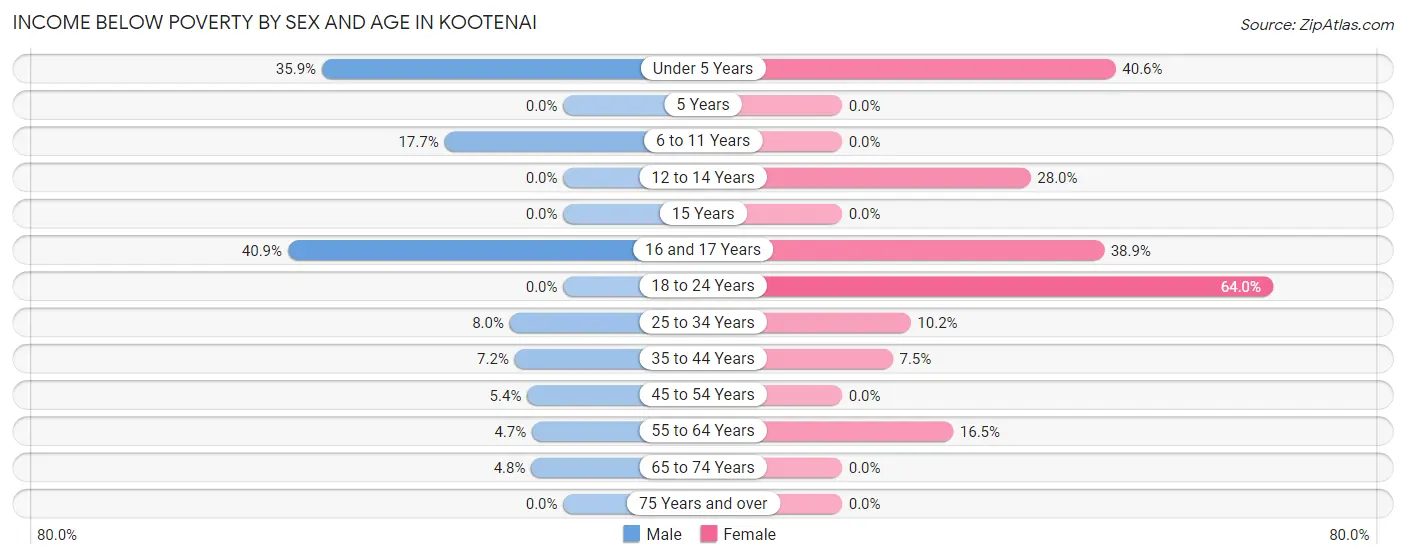
Income Below Poverty by Sex and Age in Kootenai
With 10.2% poverty level for males and 14.1% for females among the residents of Kootenai, 16 and 17 year old males and 18 to 24 year old females are the most vulnerable to poverty, with 9 males (40.9%) and 16 females (64.0%) in their respective age groups living below the poverty level.
| Age Bracket | Male | Female |
| Under 5 Years | 19 (35.8%) | 13 (40.6%) |
| 5 Years | 0 (0.0%) | 0 (0.0%) |
| 6 to 11 Years | 6 (17.6%) | 0 (0.0%) |
| 12 to 14 Years | 0 (0.0%) | 7 (28.0%) |
| 15 Years | 0 (0.0%) | 0 (0.0%) |
| 16 and 17 Years | 9 (40.9%) | 14 (38.9%) |
| 18 to 24 Years | 0 (0.0%) | 16 (64.0%) |
| 25 to 34 Years | 7 (8.0%) | 11 (10.2%) |
| 35 to 44 Years | 7 (7.2%) | 7 (7.5%) |
| 45 to 54 Years | 3 (5.4%) | 0 (0.0%) |
| 55 to 64 Years | 2 (4.6%) | 16 (16.5%) |
| 65 to 74 Years | 2 (4.8%) | 0 (0.0%) |
| 75 Years and over | 0 (0.0%) | 0 (0.0%) |
| Total | 55 (10.2%) | 84 (14.1%) |
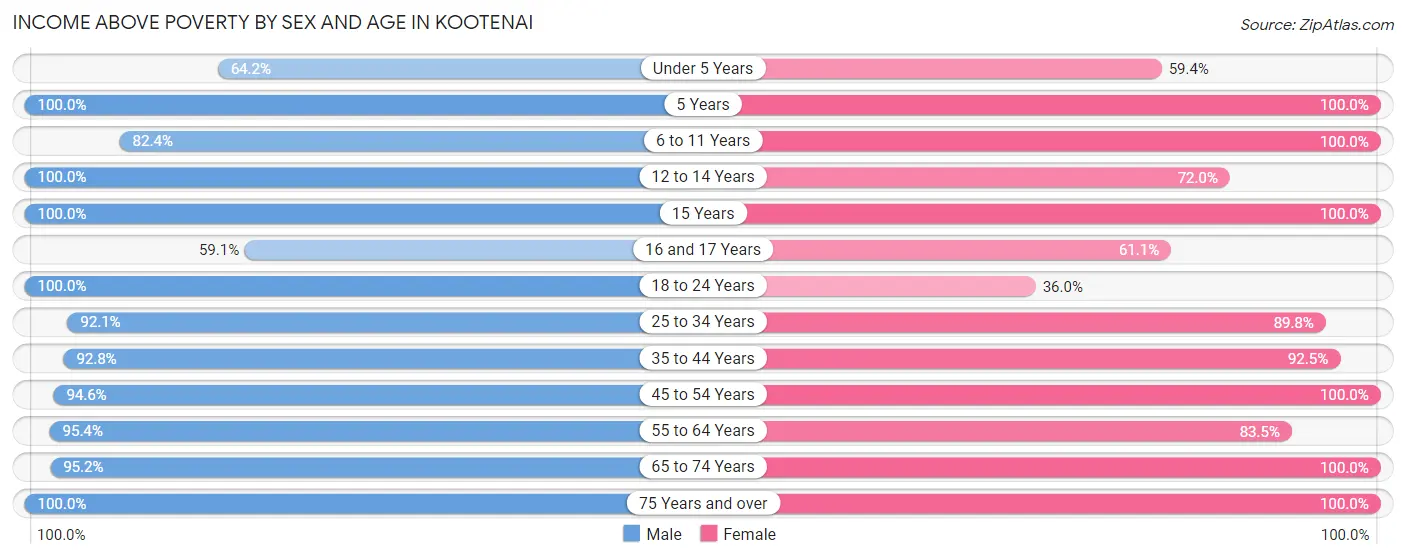
Income Above Poverty by Sex and Age in Kootenai
According to the poverty statistics in Kootenai, males aged 5 years and females aged 5 years are the age groups that are most secure financially, with 100.0% of males and 100.0% of females in these age groups living above the poverty line.
| Age Bracket | Male | Female |
| Under 5 Years | 34 (64.1%) | 19 (59.4%) |
| 5 Years | 2 (100.0%) | 17 (100.0%) |
| 6 to 11 Years | 28 (82.4%) | 48 (100.0%) |
| 12 to 14 Years | 8 (100.0%) | 18 (72.0%) |
| 15 Years | 6 (100.0%) | 2 (100.0%) |
| 16 and 17 Years | 13 (59.1%) | 22 (61.1%) |
| 18 to 24 Years | 24 (100.0%) | 9 (36.0%) |
| 25 to 34 Years | 81 (92.0%) | 97 (89.8%) |
| 35 to 44 Years | 90 (92.8%) | 86 (92.5%) |
| 45 to 54 Years | 53 (94.6%) | 36 (100.0%) |
| 55 to 64 Years | 41 (95.4%) | 81 (83.5%) |
| 65 to 74 Years | 40 (95.2%) | 38 (100.0%) |
| 75 Years and over | 64 (100.0%) | 37 (100.0%) |
| Total | 484 (89.8%) | 510 (85.9%) |
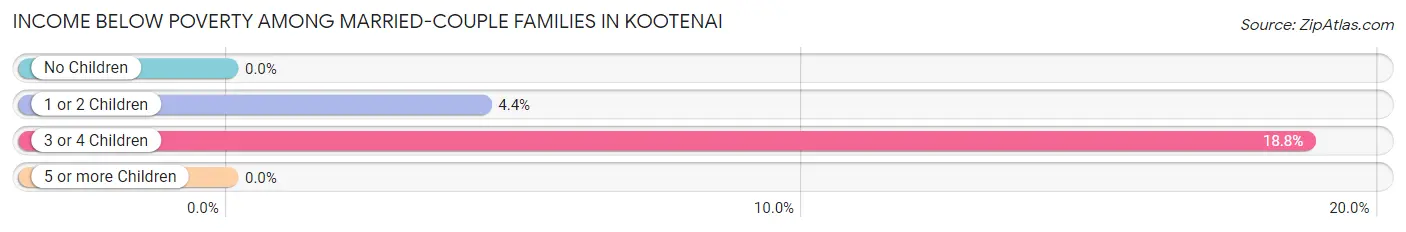
Income Below Poverty Among Married-Couple Families in Kootenai
The poverty statistics for married-couple families in Kootenai show that 3.1% or 6 of the total 193 families live below the poverty line. Families with 3 or 4 children have the highest poverty rate of 18.8%, comprising of 3 families. On the other hand, families with no children have the lowest poverty rate of 0.0%, which includes 0 families.
| Children | Above Poverty | Below Poverty |
| No Children | 109 (100.0%) | 0 (0.0%) |
| 1 or 2 Children | 65 (95.6%) | 3 (4.4%) |
| 3 or 4 Children | 13 (81.2%) | 3 (18.8%) |
| 5 or more Children | 0 (0.0%) | 0 (0.0%) |
| Total | 187 (96.9%) | 6 (3.1%) |
Income Below Poverty Among Single-Parent Households in Kootenai
According to the poverty data in Kootenai, 17.6% or 3 single-father households and 19.0% or 11 single-mother households are living below the poverty line. Among single-father households, those with 1 or 2 children have the highest poverty rate, with 3 households (21.4%) experiencing poverty. Likewise, among single-mother households, those with 1 or 2 children have the highest poverty rate, with 11 households (32.4%) falling below the poverty line.
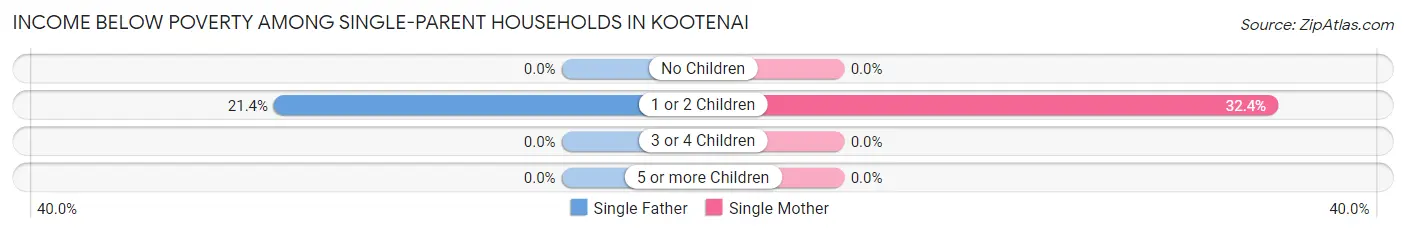
| Children | Single Father | Single Mother |
| No Children | 0 (0.0%) | 0 (0.0%) |
| 1 or 2 Children | 3 (21.4%) | 11 (32.4%) |
| 3 or 4 Children | 0 (0.0%) | 0 (0.0%) |
| 5 or more Children | 0 (0.0%) | 0 (0.0%) |
| Total | 3 (17.6%) | 11 (19.0%) |
Income Below Poverty Among Married-Couple vs Single-Parent Households in Kootenai
The poverty data for Kootenai shows that 6 of the married-couple family households (3.1%) and 14 of the single-parent households (18.7%) are living below the poverty level. Within the married-couple family households, those with 3 or 4 children have the highest poverty rate, with 3 households (18.8%) falling below the poverty line. Among the single-parent households, those with 1 or 2 children have the highest poverty rate, with 14 household (29.2%) living below poverty.
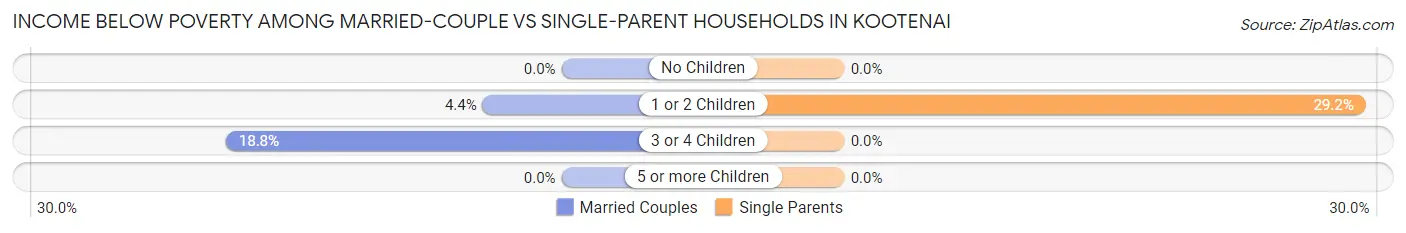
| Children | Married-Couple Families | Single-Parent Households |
| No Children | 0 (0.0%) | 0 (0.0%) |
| 1 or 2 Children | 3 (4.4%) | 14 (29.2%) |
| 3 or 4 Children | 3 (18.8%) | 0 (0.0%) |
| 5 or more Children | 0 (0.0%) | 0 (0.0%) |
| Total | 6 (3.1%) | 14 (18.7%) |
Race in Kootenai
The most populous races in Kootenai are White / Caucasian (1,082 | 93.9%), Two or more Races (61 | 5.3%), and Hispanic or Latino (55 | 4.8%).
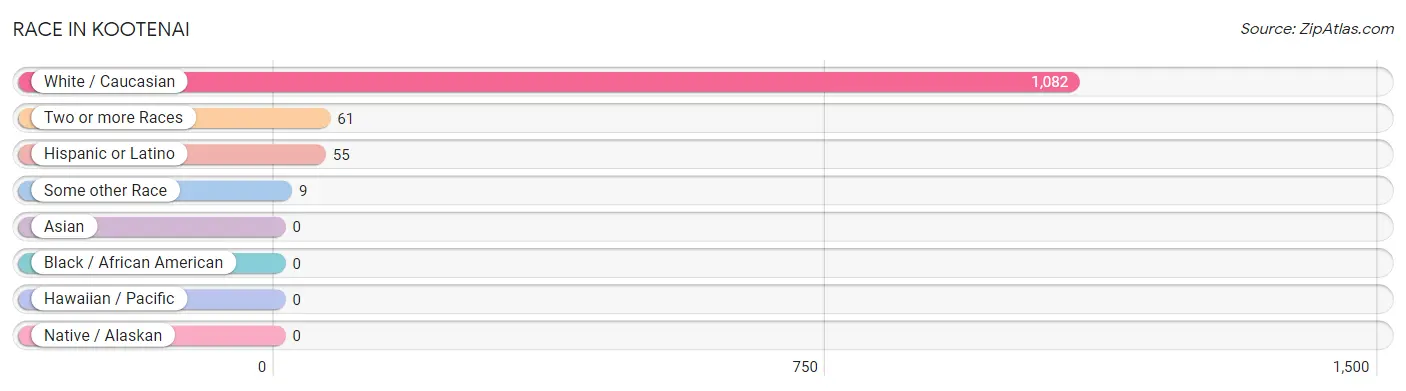
| Race | # Population | % Population |
| Asian | 0 | 0.0% |
| Black / African American | 0 | 0.0% |
| Hawaiian / Pacific | 0 | 0.0% |
| Hispanic or Latino | 55 | 4.8% |
| Native / Alaskan | 0 | 0.0% |
| White / Caucasian | 1,082 | 93.9% |
| Two or more Races | 61 | 5.3% |
| Some other Race | 9 | 0.8% |
| Total | 1,152 | 100.0% |
Ancestry in Kootenai
The most populous ancestries reported in Kootenai are German (165 | 14.3%), American (156 | 13.5%), English (104 | 9.0%), Irish (69 | 6.0%), and Dutch (61 | 5.3%), together accounting for 48.2% of all Kootenai residents.
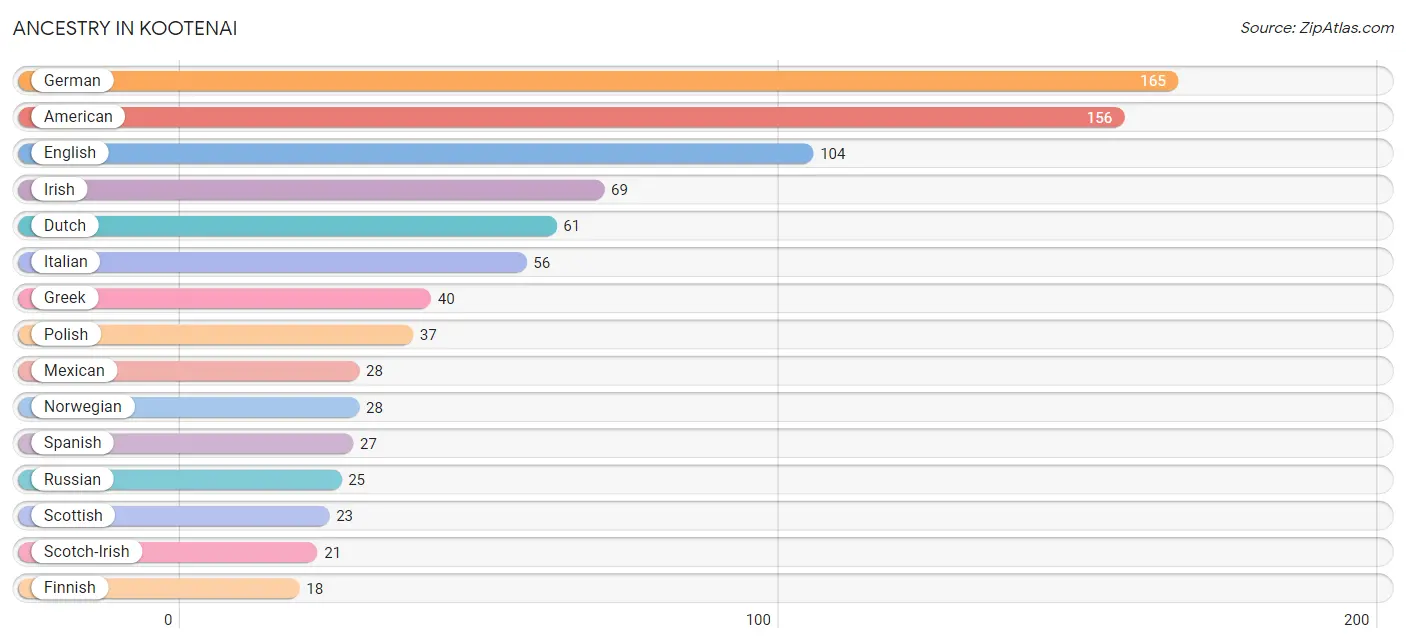
| Ancestry | # Population | % Population |
| African | 2 | 0.2% |
| American | 156 | 13.5% |
| Arab | 2 | 0.2% |
| Cherokee | 5 | 0.4% |
| Choctaw | 9 | 0.8% |
| Dutch | 61 | 5.3% |
| Egyptian | 2 | 0.2% |
| English | 104 | 9.0% |
| European | 13 | 1.1% |
| Finnish | 18 | 1.6% |
| French | 14 | 1.2% |
| French Canadian | 6 | 0.5% |
| German | 165 | 14.3% |
| Greek | 40 | 3.5% |
| Irish | 69 | 6.0% |
| Italian | 56 | 4.9% |
| Mexican | 28 | 2.4% |
| Norwegian | 28 | 2.4% |
| Polish | 37 | 3.2% |
| Russian | 25 | 2.2% |
| Scotch-Irish | 21 | 1.8% |
| Scottish | 23 | 2.0% |
| Spanish | 27 | 2.3% |
| Subsaharan African | 2 | 0.2% |
| Swedish | 18 | 1.6% |
| Ukrainian | 15 | 1.3% |
| Welsh | 8 | 0.7% | View All 27 Rows |
Immigrants in Kootenai
The most numerous immigrant groups reported in Kootenai came from Canada (11 | 0.9%), Central America (9 | 0.8%), Latin America (9 | 0.8%), Mexico (9 | 0.8%), and Africa (2 | 0.2%), together accounting for 3.5% of all Kootenai residents.
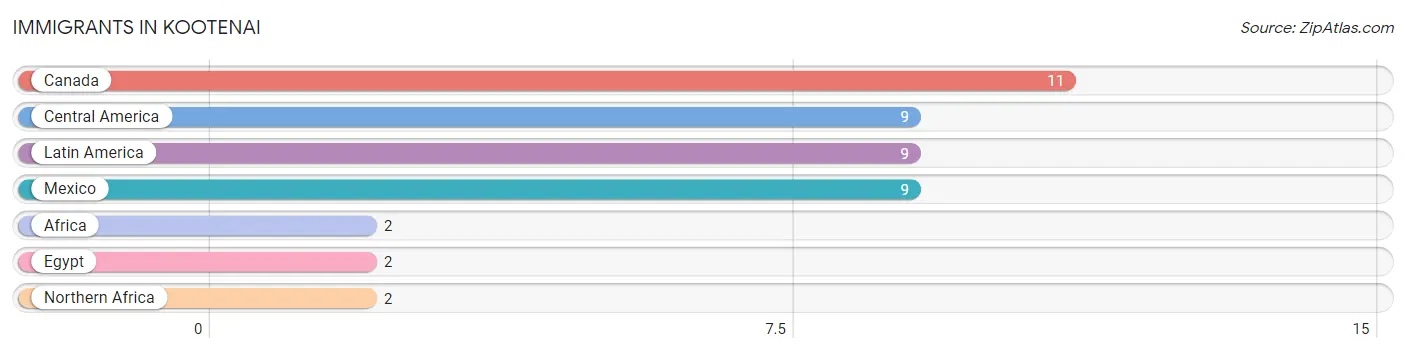
| Immigration Origin | # Population | % Population |
| Africa | 2 | 0.2% |
| Canada | 11 | 0.9% |
| Central America | 9 | 0.8% |
| Egypt | 2 | 0.2% |
| Latin America | 9 | 0.8% |
| Mexico | 9 | 0.8% |
| Northern Africa | 2 | 0.2% | View All 7 Rows |
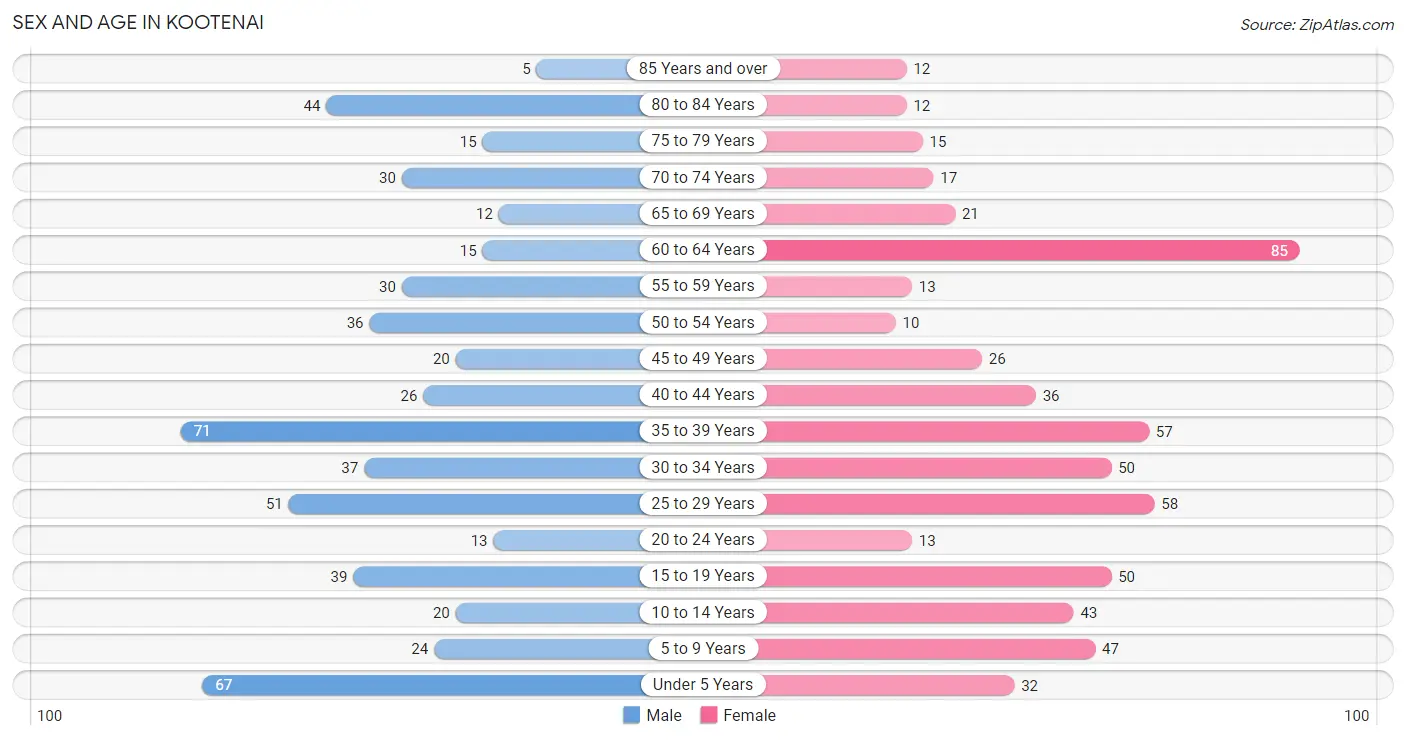
Sex and Age in Kootenai
Sex and Age in Kootenai
The most populous age groups in Kootenai are 35 to 39 Years (71 | 12.8%) for men and 60 to 64 Years (85 | 14.2%) for women.
| Age Bracket | Male | Female |
| Under 5 Years | 67 (12.1%) | 32 (5.4%) |
| 5 to 9 Years | 24 (4.3%) | 47 (7.9%) |
| 10 to 14 Years | 20 (3.6%) | 43 (7.2%) |
| 15 to 19 Years | 39 (7.0%) | 50 (8.4%) |
| 20 to 24 Years | 13 (2.3%) | 13 (2.2%) |
| 25 to 29 Years | 51 (9.2%) | 58 (9.7%) |
| 30 to 34 Years | 37 (6.7%) | 50 (8.4%) |
| 35 to 39 Years | 71 (12.8%) | 57 (9.6%) |
| 40 to 44 Years | 26 (4.7%) | 36 (6.0%) |
| 45 to 49 Years | 20 (3.6%) | 26 (4.4%) |
| 50 to 54 Years | 36 (6.5%) | 10 (1.7%) |
| 55 to 59 Years | 30 (5.4%) | 13 (2.2%) |
| 60 to 64 Years | 15 (2.7%) | 85 (14.2%) |
| 65 to 69 Years | 12 (2.2%) | 21 (3.5%) |
| 70 to 74 Years | 30 (5.4%) | 17 (2.9%) |
| 75 to 79 Years | 15 (2.7%) | 15 (2.5%) |
| 80 to 84 Years | 44 (7.9%) | 12 (2.0%) |
| 85 Years and over | 5 (0.9%) | 12 (2.0%) |
| Total | 555 (100.0%) | 597 (100.0%) |
Families and Households in Kootenai
Median Family Size in Kootenai
The median family size in Kootenai is 3.12 persons per family, with married-couple families (193 | 72.0%) accounting for the largest median family size of 3.22 persons per family. On the other hand, single male/father families (17 | 6.3%) represent the smallest median family size with 2.65 persons per family.
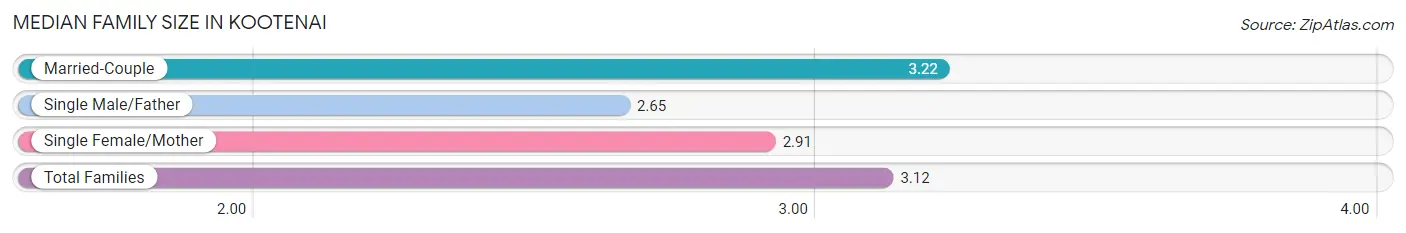
| Family Type | # Families | Family Size |
| Married-Couple | 193 (72.0%) | 3.22 |
| Single Male/Father | 17 (6.3%) | 2.65 |
| Single Female/Mother | 58 (21.6%) | 2.91 |
| Total Families | 268 (100.0%) | 3.12 |
Median Household Size in Kootenai
The median household size in Kootenai is 2.63 persons per household, with single male/father households (17 | 4.0%) accounting for the largest median household size of 3.76 persons per household. non-family households (154 | 36.5%) represent the smallest median household size with 1.32 persons per household.
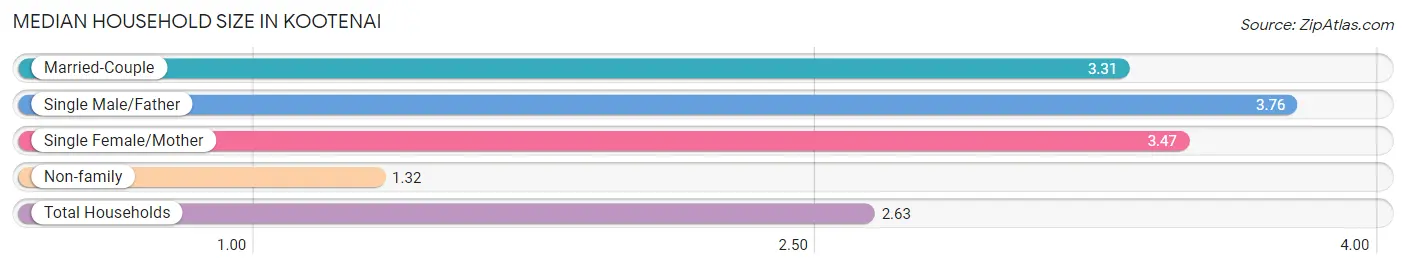
| Household Type | # Households | Household Size |
| Married-Couple | 193 (45.7%) | 3.31 |
| Single Male/Father | 17 (4.0%) | 3.76 |
| Single Female/Mother | 58 (13.7%) | 3.47 |
| Non-family | 154 (36.5%) | 1.32 |
| Total Households | 422 (100.0%) | 2.63 |
Household Size by Marriage Status in Kootenai
Out of a total of 422 households in Kootenai, 268 (63.5%) are family households, while 154 (36.5%) are nonfamily households. The most numerous type of family households are 2-person households, comprising 145, and the most common type of nonfamily households are 1-person households, comprising 106.
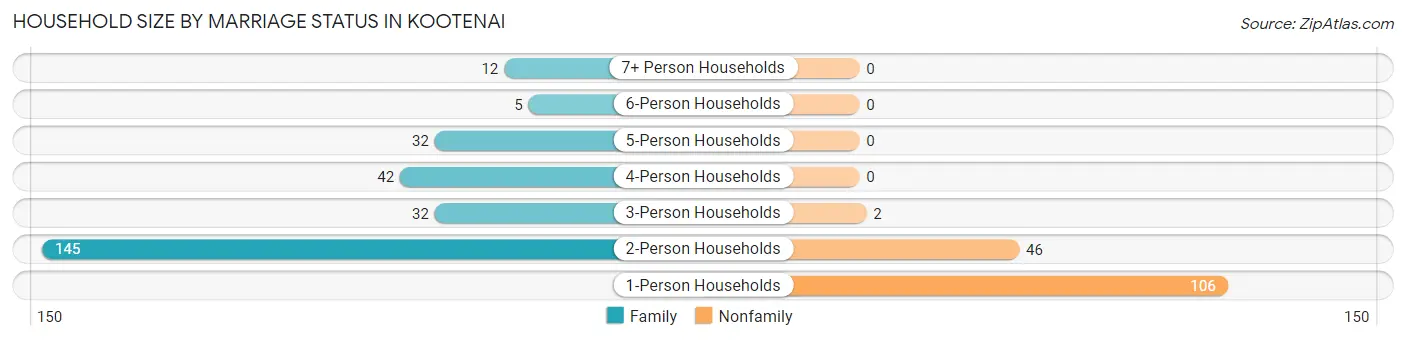
| Household Size | Family Households | Nonfamily Households |
| 1-Person Households | - | 106 (25.1%) |
| 2-Person Households | 145 (34.4%) | 46 (10.9%) |
| 3-Person Households | 32 (7.6%) | 2 (0.5%) |
| 4-Person Households | 42 (10.0%) | 0 (0.0%) |
| 5-Person Households | 32 (7.6%) | 0 (0.0%) |
| 6-Person Households | 5 (1.2%) | 0 (0.0%) |
| 7+ Person Households | 12 (2.8%) | 0 (0.0%) |
| Total | 268 (63.5%) | 154 (36.5%) |
Female Fertility in Kootenai
Fertility by Age in Kootenai
Average fertility rate in Kootenai is 31.0 births per 1,000 women. Women in the age bracket of 35 to 50 years have the highest fertility rate with 50.0 births per 1,000 women. Women in the age bracket of 35 to 50 years acount for 66.7% of all women with births.
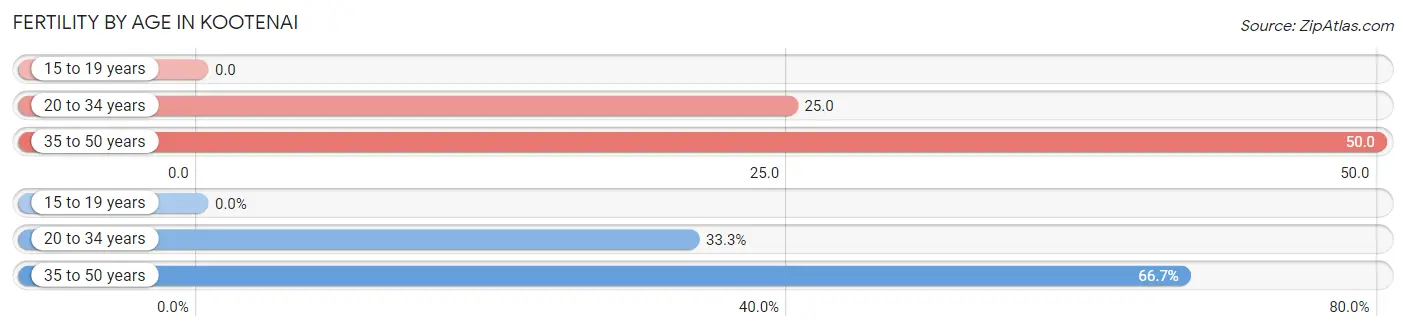
| Age Bracket | Women with Births | Births / 1,000 Women |
| 15 to 19 years | 0 (0.0%) | 0.0 |
| 20 to 34 years | 3 (33.3%) | 25.0 |
| 35 to 50 years | 6 (66.7%) | 50.0 |
| Total | 9 (100.0%) | 31.0 |
Fertility by Age by Marriage Status in Kootenai
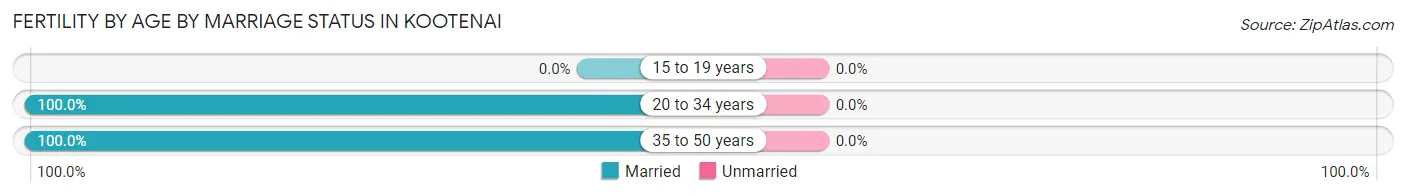
| Age Bracket | Married | Unmarried |
| 15 to 19 years | 0 (0.0%) | 0 (0.0%) |
| 20 to 34 years | 3 (100.0%) | 0 (0.0%) |
| 35 to 50 years | 6 (100.0%) | 0 (0.0%) |
| Total | 9 (100.0%) | 0 (0.0%) |
Fertility by Education in Kootenai
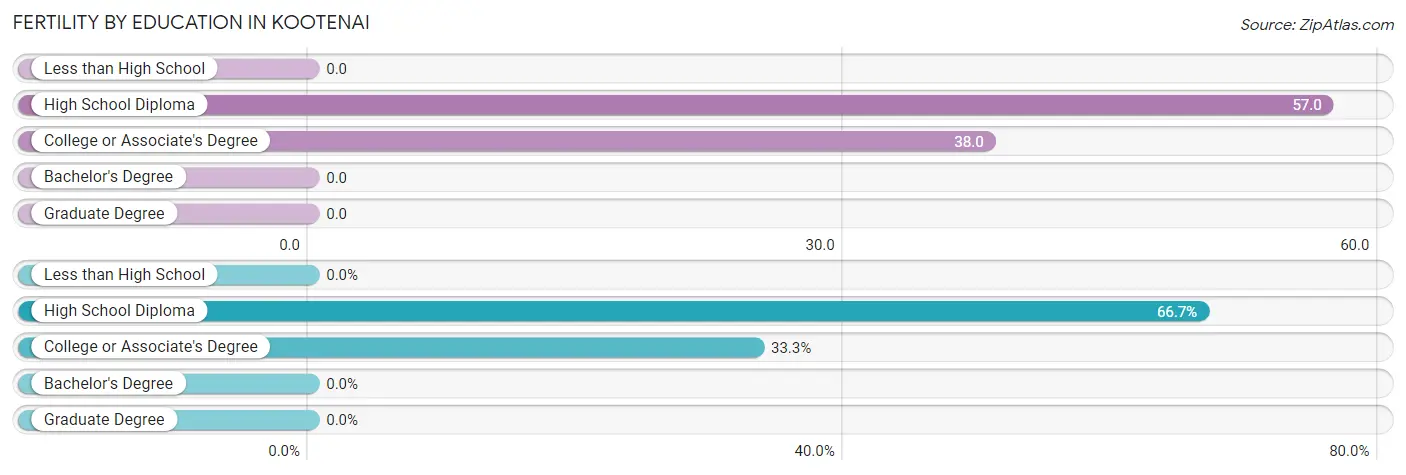
| Educational Attainment | Women with Births | Births / 1,000 Women |
| Less than High School | 0 (0.0%) | 0.0 |
| High School Diploma | 6 (66.7%) | 57.0 |
| College or Associate's Degree | 3 (33.3%) | 38.0 |
| Bachelor's Degree | 0 (0.0%) | 0.0 |
| Graduate Degree | 0 (0.0%) | 0.0 |
| Total | 9 (100.0%) | 31.0 |
Fertility by Education by Marriage Status in Kootenai
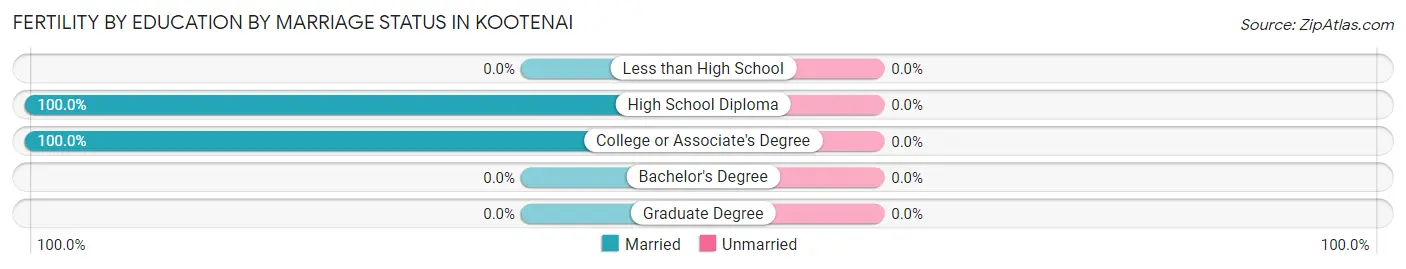
| Educational Attainment | Married | Unmarried |
| Less than High School | 0 (0.0%) | 0 (0.0%) |
| High School Diploma | 6 (100.0%) | 0 (0.0%) |
| College or Associate's Degree | 3 (100.0%) | 0 (0.0%) |
| Bachelor's Degree | 0 (0.0%) | 0 (0.0%) |
| Graduate Degree | 0 (0.0%) | 0 (0.0%) |
| Total | 9 (100.0%) | 0 (0.0%) |
Employment Characteristics in Kootenai
Employment by Class of Employer in Kootenai
Among the 575 employed individuals in Kootenai, private company employees (416 | 72.4%), self-employed (not incorporated) (50 | 8.7%), and not-for-profit organizations (41 | 7.1%) make up the most common classes of employment.
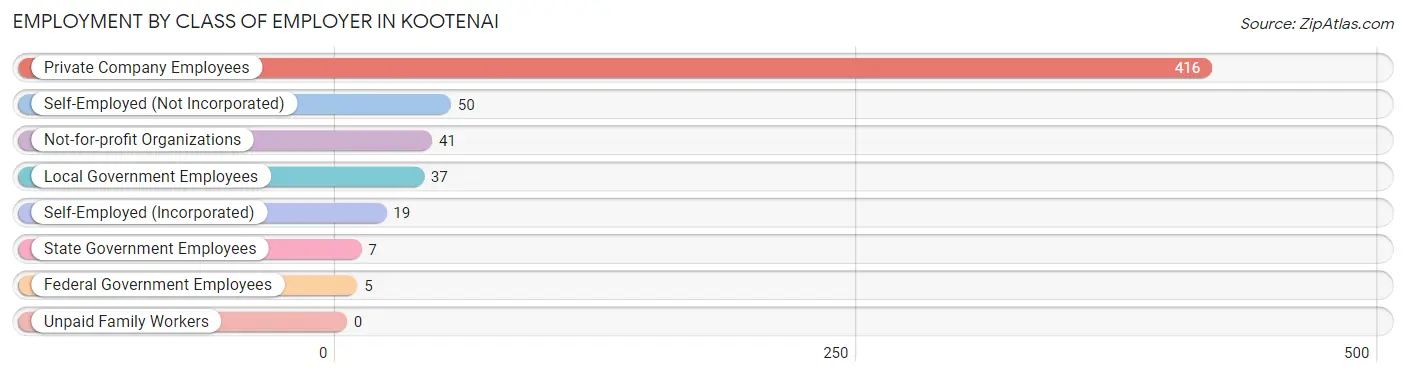
| Employer Class | # Employees | % Employees |
| Private Company Employees | 416 | 72.4% |
| Self-Employed (Incorporated) | 19 | 3.3% |
| Self-Employed (Not Incorporated) | 50 | 8.7% |
| Not-for-profit Organizations | 41 | 7.1% |
| Local Government Employees | 37 | 6.4% |
| State Government Employees | 7 | 1.2% |
| Federal Government Employees | 5 | 0.9% |
| Unpaid Family Workers | 0 | 0.0% |
| Total | 575 | 100.0% |
Employment Status by Age in Kootenai
According to the labor force statistics for Kootenai, out of the total population over 16 years of age (911), 67.8% or 618 individuals are in the labor force, with 4.7% or 29 of them unemployed. The age group with the highest labor force participation rate is 45 to 54 years, with 100.0% or 92 individuals in the labor force. Within the labor force, the 16 to 19 years age range has the highest percentage of unemployed individuals, with 47.7% or 21 of them being unemployed.
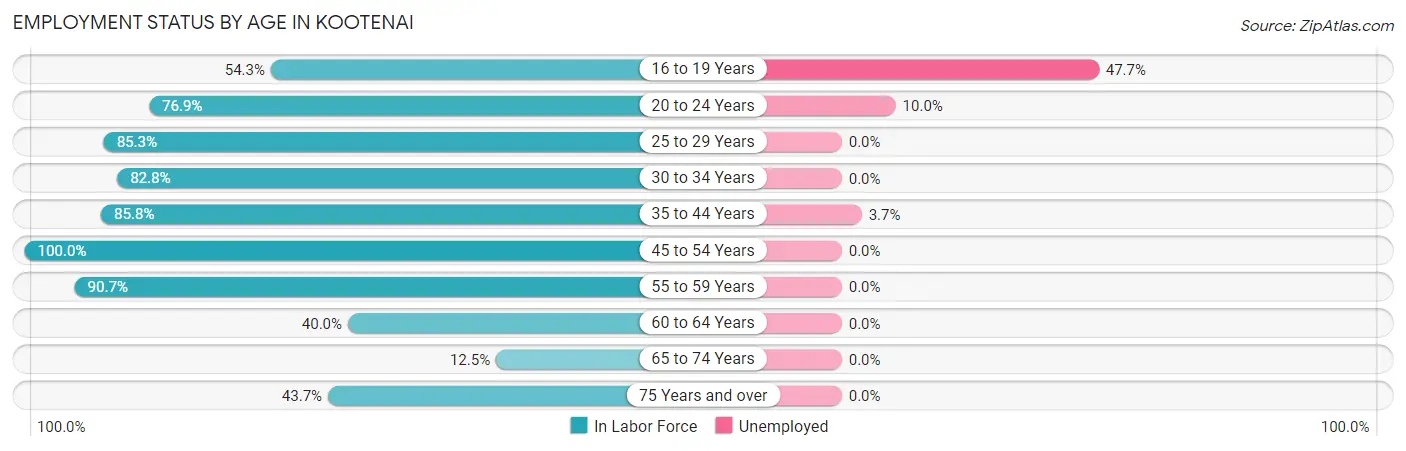
| Age Bracket | In Labor Force | Unemployed |
| 16 to 19 Years | 44 (54.3%) | 21 (47.7%) |
| 20 to 24 Years | 20 (76.9%) | 2 (10.0%) |
| 25 to 29 Years | 93 (85.3%) | 0 (0.0%) |
| 30 to 34 Years | 72 (82.8%) | 0 (0.0%) |
| 35 to 44 Years | 163 (85.8%) | 6 (3.7%) |
| 45 to 54 Years | 92 (100.0%) | 0 (0.0%) |
| 55 to 59 Years | 39 (90.7%) | 0 (0.0%) |
| 60 to 64 Years | 40 (40.0%) | 0 (0.0%) |
| 65 to 74 Years | 10 (12.5%) | 0 (0.0%) |
| 75 Years and over | 45 (43.7%) | 0 (0.0%) |
| Total | 618 (67.8%) | 29 (4.7%) |
Employment Status by Educational Attainment in Kootenai
According to labor force statistics for Kootenai, 80.4% of individuals (499) out of the total population between 25 and 64 years of age (621) are in the labor force, with 1.2% or 6 of them being unemployed. The group with the highest labor force participation rate are those with the educational attainment of bachelor's degree or higher, with 98.3% or 113 individuals in the labor force. Within the labor force, individuals with less than high school education have the highest percentage of unemployment, with 16.0% or 4 of them being unemployed.
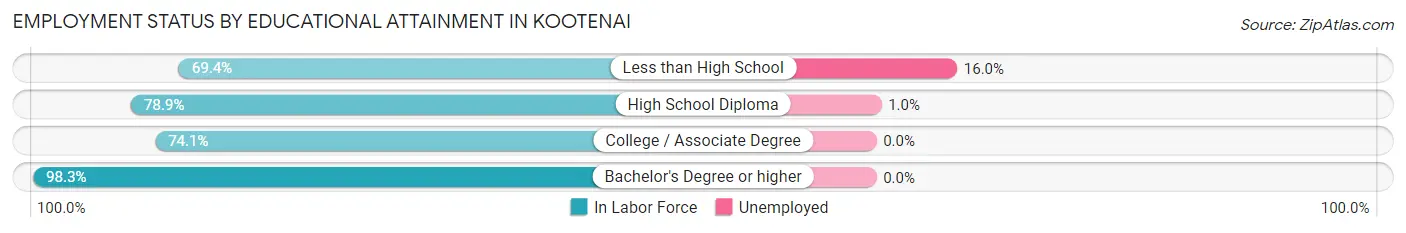
| Educational Attainment | In Labor Force | Unemployed |
| Less than High School | 25 (69.4%) | 6 (16.0%) |
| High School Diploma | 209 (78.9%) | 3 (1.0%) |
| College / Associate Degree | 152 (74.1%) | 0 (0.0%) |
| Bachelor's Degree or higher | 113 (98.3%) | 0 (0.0%) |
| Total | 499 (80.4%) | 7 (1.2%) |
Employment Occupations by Sex in Kootenai
Management, Business, Science and Arts Occupations
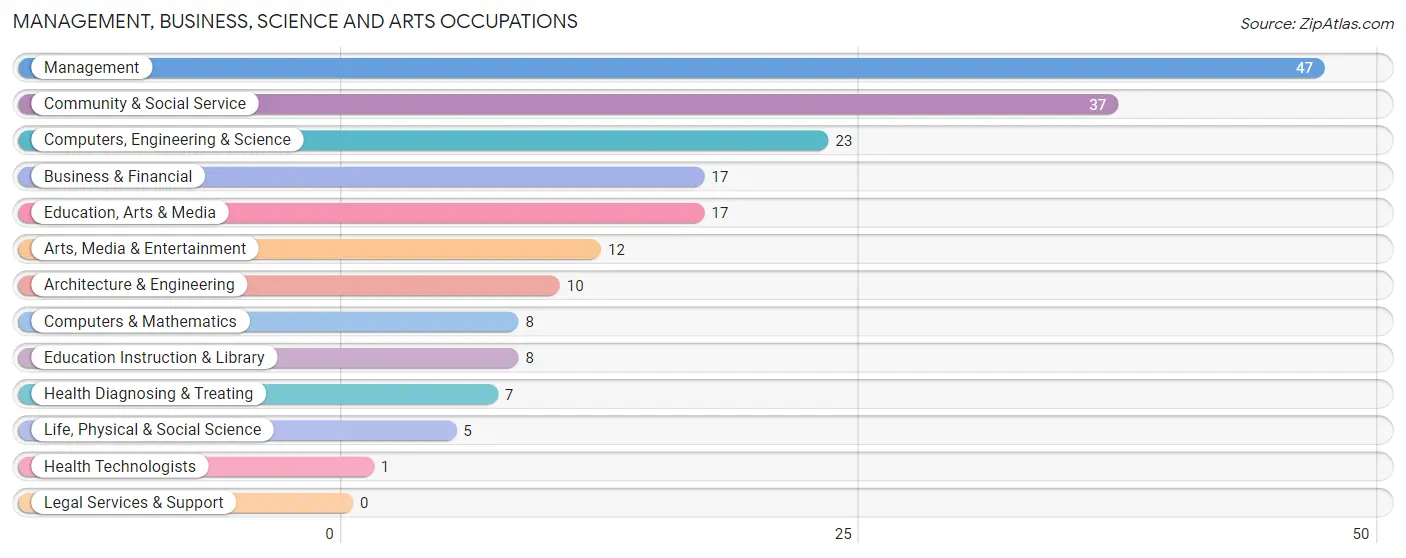
The most common Management, Business, Science and Arts occupations in Kootenai are Management (47 | 8.0%), Community & Social Service (37 | 6.3%), Computers, Engineering & Science (23 | 3.9%), Business & Financial (17 | 2.9%), and Education, Arts & Media (17 | 2.9%).
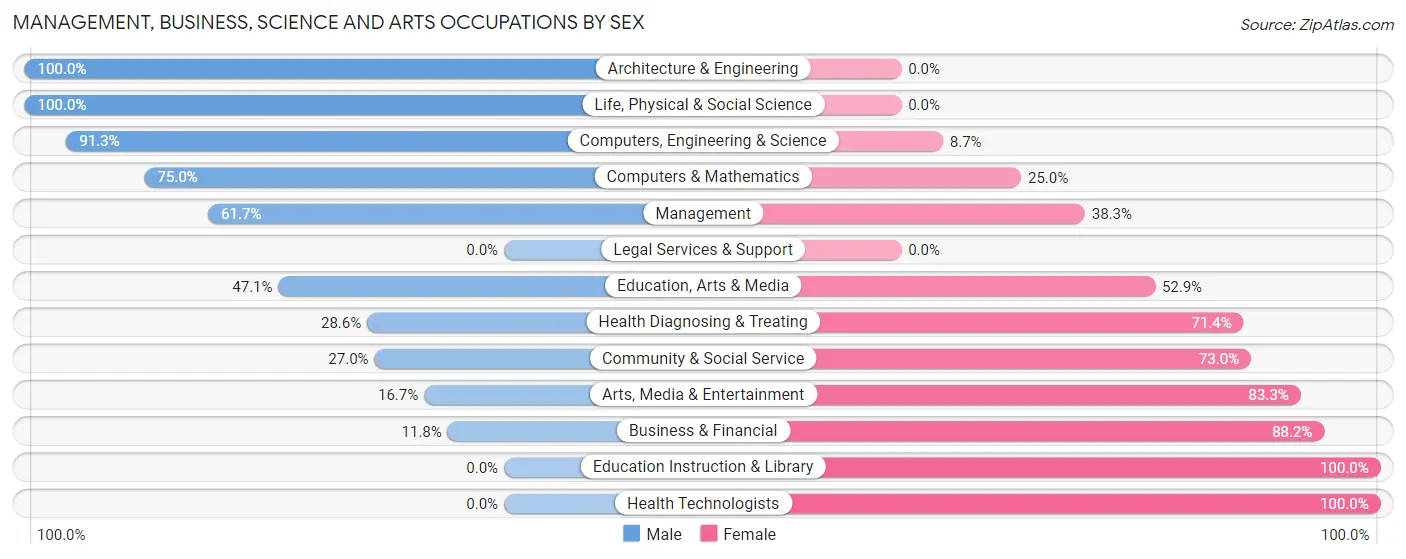
Management, Business, Science and Arts Occupations by Sex
Within the Management, Business, Science and Arts occupations in Kootenai, the most male-oriented occupations are Architecture & Engineering (100.0%), Life, Physical & Social Science (100.0%), and Computers, Engineering & Science (91.3%), while the most female-oriented occupations are Education Instruction & Library (100.0%), Health Technologists (100.0%), and Business & Financial (88.2%).
| Occupation | Male | Female |
| Management | 29 (61.7%) | 18 (38.3%) |
| Business & Financial | 2 (11.8%) | 15 (88.2%) |
| Computers, Engineering & Science | 21 (91.3%) | 2 (8.7%) |
| Computers & Mathematics | 6 (75.0%) | 2 (25.0%) |
| Architecture & Engineering | 10 (100.0%) | 0 (0.0%) |
| Life, Physical & Social Science | 5 (100.0%) | 0 (0.0%) |
| Community & Social Service | 10 (27.0%) | 27 (73.0%) |
| Education, Arts & Media | 8 (47.1%) | 9 (52.9%) |
| Legal Services & Support | 0 (0.0%) | 0 (0.0%) |
| Education Instruction & Library | 0 (0.0%) | 8 (100.0%) |
| Arts, Media & Entertainment | 2 (16.7%) | 10 (83.3%) |
| Health Diagnosing & Treating | 2 (28.6%) | 5 (71.4%) |
| Health Technologists | 0 (0.0%) | 1 (100.0%) |
| Total (Category) | 64 (48.8%) | 67 (51.1%) |
| Total (Overall) | 301 (51.1%) | 288 (48.9%) |
Services Occupations
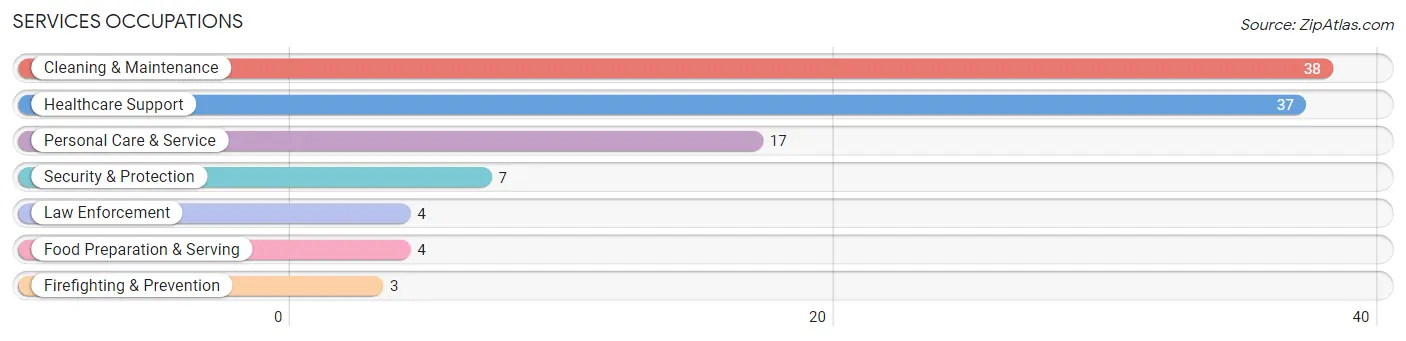
The most common Services occupations in Kootenai are Cleaning & Maintenance (38 | 6.5%), Healthcare Support (37 | 6.3%), Personal Care & Service (17 | 2.9%), Security & Protection (7 | 1.2%), and Law Enforcement (4 | 0.7%).
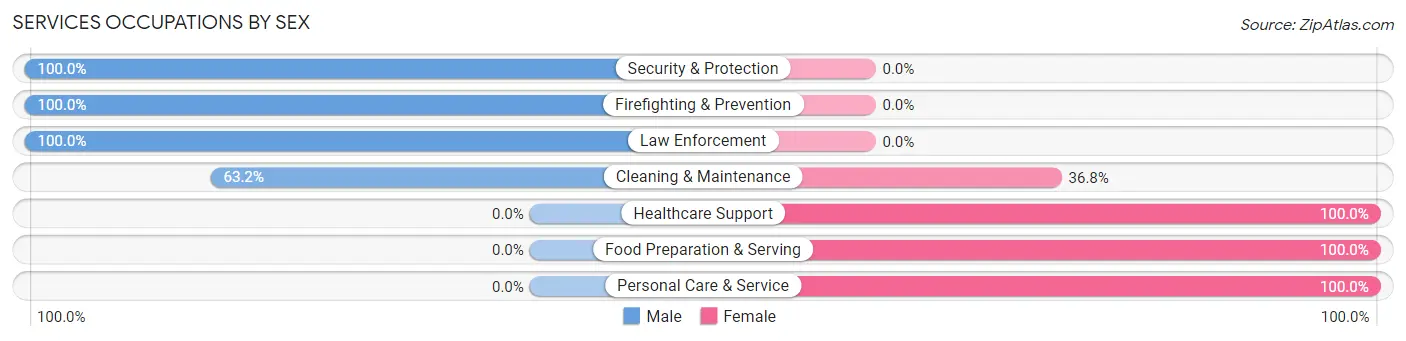
Services Occupations by Sex
Within the Services occupations in Kootenai, the most male-oriented occupations are Security & Protection (100.0%), Firefighting & Prevention (100.0%), and Law Enforcement (100.0%), while the most female-oriented occupations are Healthcare Support (100.0%), Food Preparation & Serving (100.0%), and Personal Care & Service (100.0%).
| Occupation | Male | Female |
| Healthcare Support | 0 (0.0%) | 37 (100.0%) |
| Security & Protection | 7 (100.0%) | 0 (0.0%) |
| Firefighting & Prevention | 3 (100.0%) | 0 (0.0%) |
| Law Enforcement | 4 (100.0%) | 0 (0.0%) |
| Food Preparation & Serving | 0 (0.0%) | 4 (100.0%) |
| Cleaning & Maintenance | 24 (63.2%) | 14 (36.8%) |
| Personal Care & Service | 0 (0.0%) | 17 (100.0%) |
| Total (Category) | 31 (30.1%) | 72 (69.9%) |
| Total (Overall) | 301 (51.1%) | 288 (48.9%) |
Sales and Office Occupations
The most common Sales and Office occupations in Kootenai are Sales & Related (120 | 20.4%), and Office & Administration (60 | 10.2%).
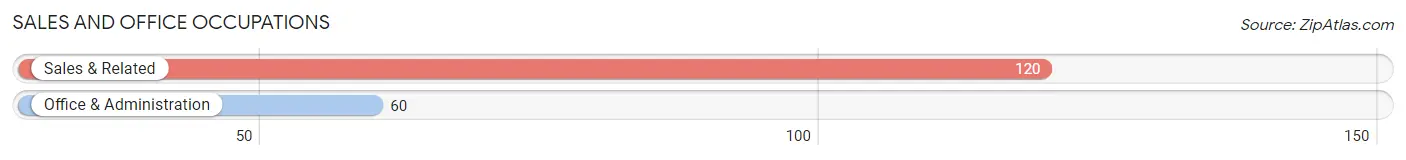
Sales and Office Occupations by Sex
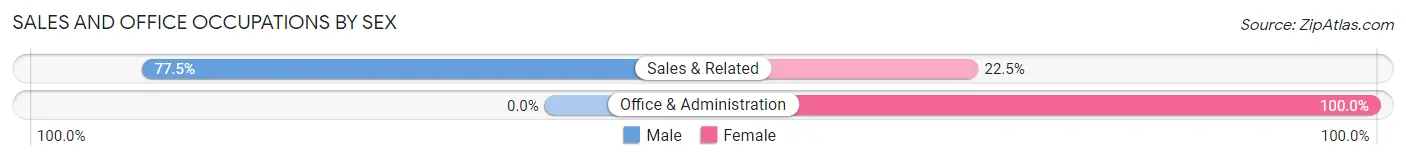
| Occupation | Male | Female |
| Sales & Related | 93 (77.5%) | 27 (22.5%) |
| Office & Administration | 0 (0.0%) | 60 (100.0%) |
| Total (Category) | 93 (51.7%) | 87 (48.3%) |
| Total (Overall) | 301 (51.1%) | 288 (48.9%) |
Natural Resources, Construction and Maintenance Occupations
The most common Natural Resources, Construction and Maintenance occupations in Kootenai are Construction & Extraction (87 | 14.8%), and Installation, Maintenance & Repair (13 | 2.2%).
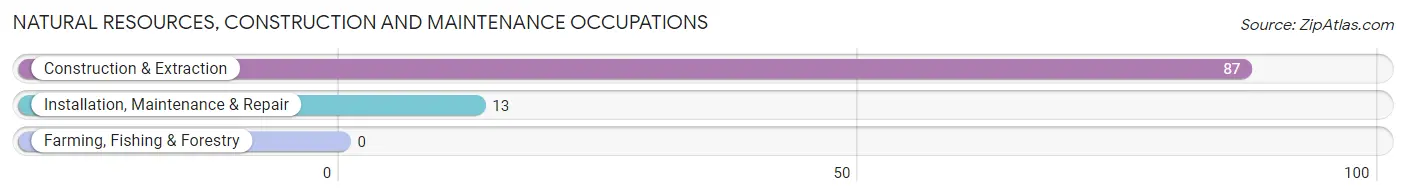
Natural Resources, Construction and Maintenance Occupations by Sex
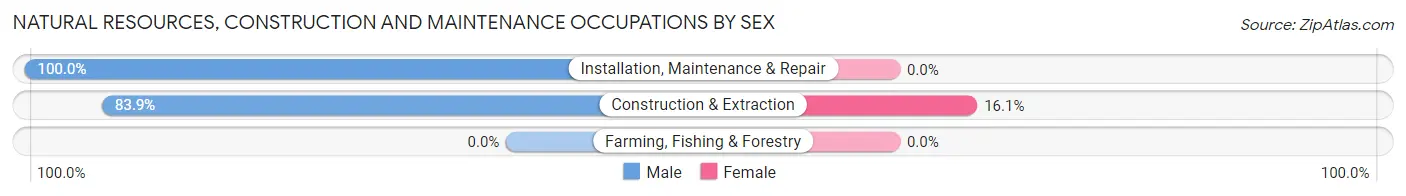
| Occupation | Male | Female |
| Farming, Fishing & Forestry | 0 (0.0%) | 0 (0.0%) |
| Construction & Extraction | 73 (83.9%) | 14 (16.1%) |
| Installation, Maintenance & Repair | 13 (100.0%) | 0 (0.0%) |
| Total (Category) | 86 (86.0%) | 14 (14.0%) |
| Total (Overall) | 301 (51.1%) | 288 (48.9%) |
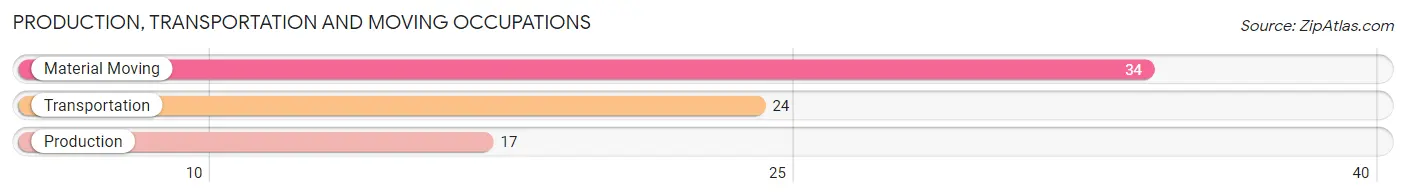
Production, Transportation and Moving Occupations
The most common Production, Transportation and Moving occupations in Kootenai are Material Moving (34 | 5.8%), Transportation (24 | 4.1%), and Production (17 | 2.9%).
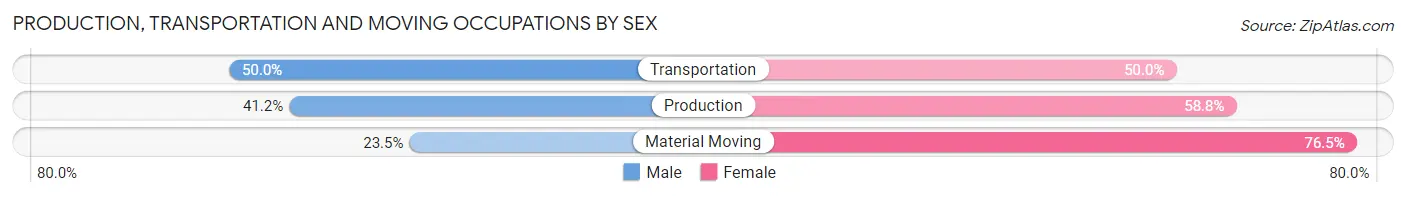
Production, Transportation and Moving Occupations by Sex
| Occupation | Male | Female |
| Production | 7 (41.2%) | 10 (58.8%) |
| Transportation | 12 (50.0%) | 12 (50.0%) |
| Material Moving | 8 (23.5%) | 26 (76.5%) |
| Total (Category) | 27 (36.0%) | 48 (64.0%) |
| Total (Overall) | 301 (51.1%) | 288 (48.9%) |
Employment Industries by Sex in Kootenai
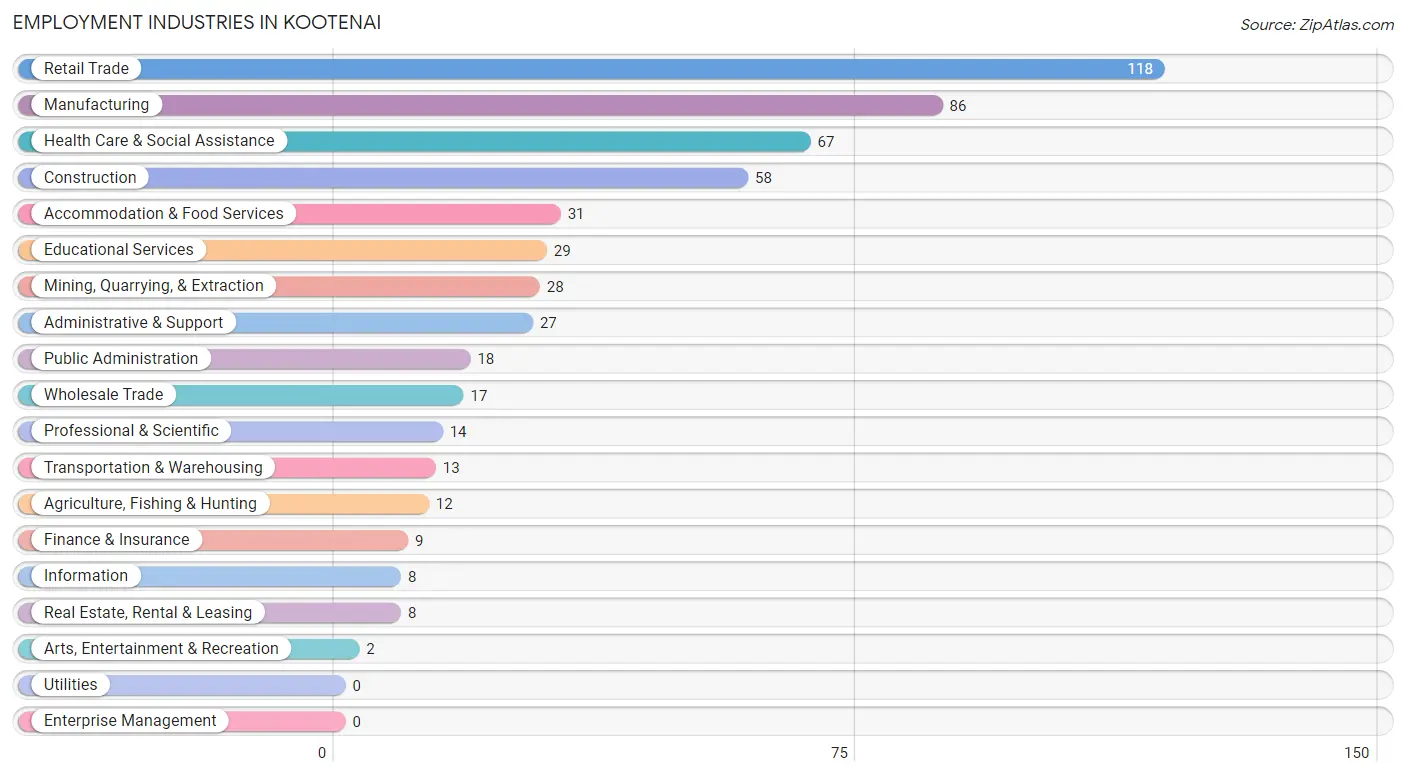
Employment Industries in Kootenai
The major employment industries in Kootenai include Retail Trade (118 | 20.0%), Manufacturing (86 | 14.6%), Health Care & Social Assistance (67 | 11.4%), Construction (58 | 9.9%), and Accommodation & Food Services (31 | 5.3%).
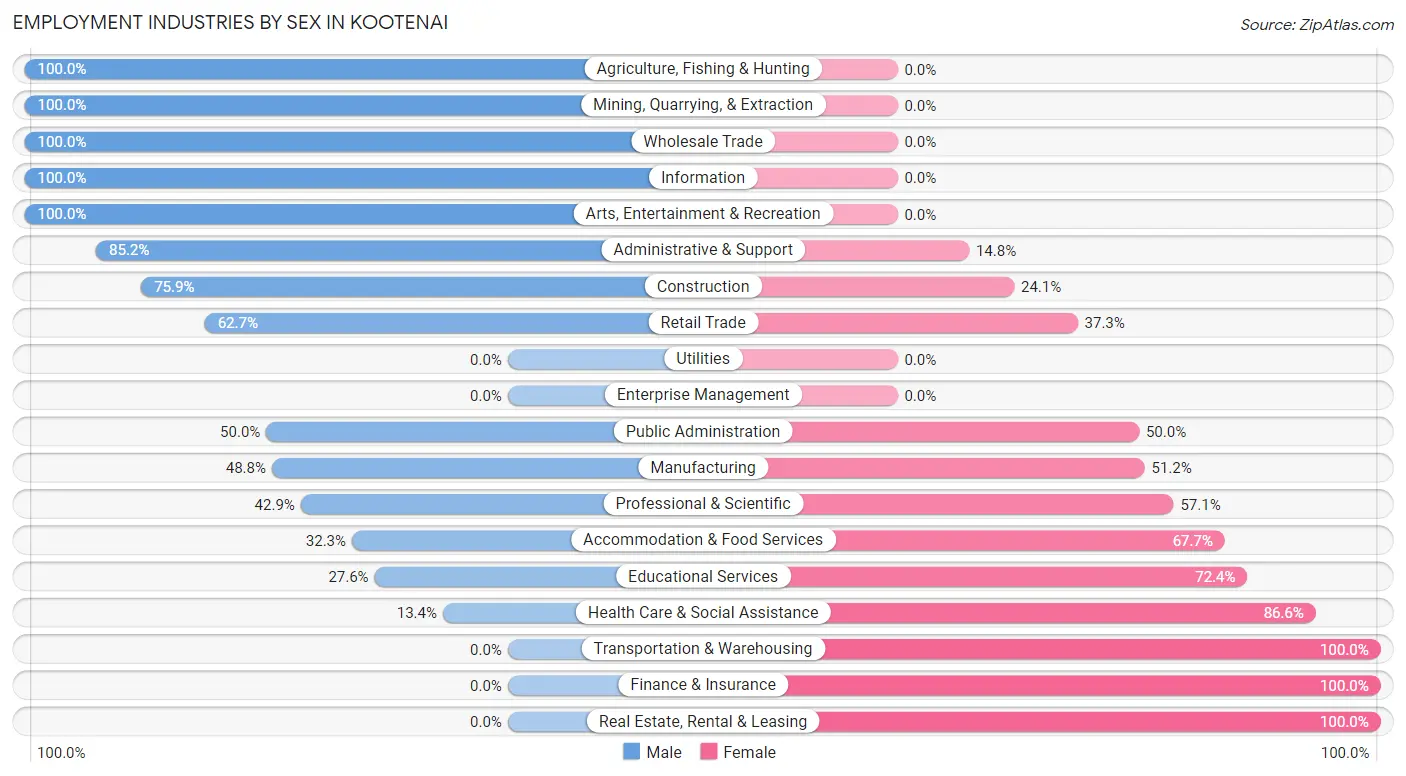
Employment Industries by Sex in Kootenai
The Kootenai industries that see more men than women are Agriculture, Fishing & Hunting (100.0%), Mining, Quarrying, & Extraction (100.0%), and Wholesale Trade (100.0%), whereas the industries that tend to have a higher number of women are Transportation & Warehousing (100.0%), Finance & Insurance (100.0%), and Real Estate, Rental & Leasing (100.0%).
| Industry | Male | Female |
| Agriculture, Fishing & Hunting | 12 (100.0%) | 0 (0.0%) |
| Mining, Quarrying, & Extraction | 28 (100.0%) | 0 (0.0%) |
| Construction | 44 (75.9%) | 14 (24.1%) |
| Manufacturing | 42 (48.8%) | 44 (51.2%) |
| Wholesale Trade | 17 (100.0%) | 0 (0.0%) |
| Retail Trade | 74 (62.7%) | 44 (37.3%) |
| Transportation & Warehousing | 0 (0.0%) | 13 (100.0%) |
| Utilities | 0 (0.0%) | 0 (0.0%) |
| Information | 8 (100.0%) | 0 (0.0%) |
| Finance & Insurance | 0 (0.0%) | 9 (100.0%) |
| Real Estate, Rental & Leasing | 0 (0.0%) | 8 (100.0%) |
| Professional & Scientific | 6 (42.9%) | 8 (57.1%) |
| Enterprise Management | 0 (0.0%) | 0 (0.0%) |
| Administrative & Support | 23 (85.2%) | 4 (14.8%) |
| Educational Services | 8 (27.6%) | 21 (72.4%) |
| Health Care & Social Assistance | 9 (13.4%) | 58 (86.6%) |
| Arts, Entertainment & Recreation | 2 (100.0%) | 0 (0.0%) |
| Accommodation & Food Services | 10 (32.3%) | 21 (67.7%) |
| Public Administration | 9 (50.0%) | 9 (50.0%) |
| Total | 301 (51.1%) | 288 (48.9%) |
Education in Kootenai
School Enrollment in Kootenai
The most common levels of schooling among the 181 students in Kootenai are high school (62 | 34.3%), middle school (49 | 27.1%), and elementary school (48 | 26.5%).

| School Level | # Students | % Students |
| Nursery / Preschool | 1 | 0.5% |
| Kindergarten | 11 | 6.1% |
| Elementary School | 48 | 26.5% |
| Middle School | 49 | 27.1% |
| High School | 62 | 34.3% |
| College / Undergraduate | 4 | 2.2% |
| Graduate / Professional | 6 | 3.3% |
| Total | 181 | 100.0% |
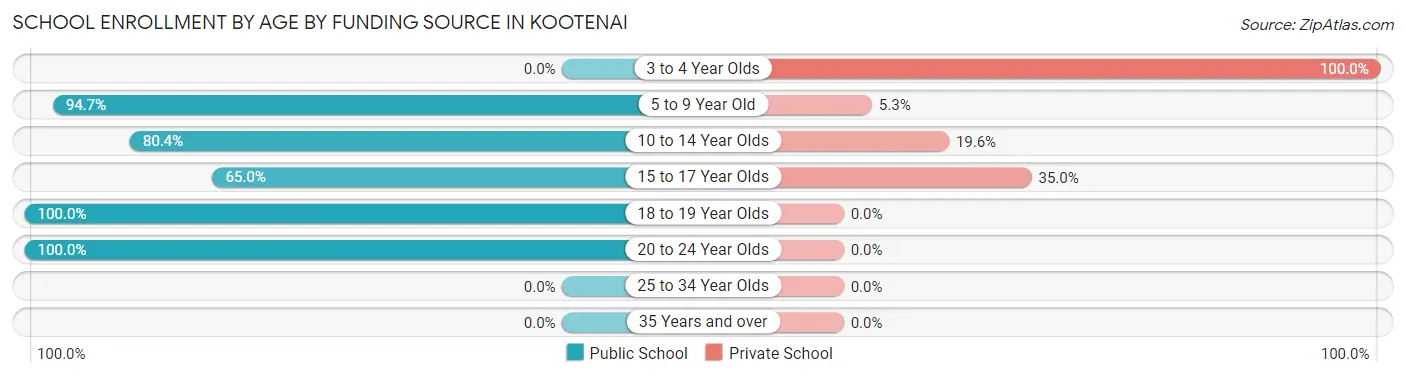
School Enrollment by Age by Funding Source in Kootenai
Out of a total of 181 students who are enrolled in schools in Kootenai, 35 (19.3%) attend a private institution, while the remaining 146 (80.7%) are enrolled in public schools. The age group of 3 to 4 year olds has the highest likelihood of being enrolled in private schools, with 1 (100.0% in the age bracket) enrolled. Conversely, the age group of 18 to 19 year olds has the lowest likelihood of being enrolled in a private school, with 2 (100.0% in the age bracket) attending a public institution.
| Age Bracket | Public School | Private School |
| 3 to 4 Year Olds | 0 (0.0%) | 1 (100.0%) |
| 5 to 9 Year Old | 54 (94.7%) | 3 (5.3%) |
| 10 to 14 Year Olds | 41 (80.4%) | 10 (19.6%) |
| 15 to 17 Year Olds | 39 (65.0%) | 21 (35.0%) |
| 18 to 19 Year Olds | 2 (100.0%) | 0 (0.0%) |
| 20 to 24 Year Olds | 10 (100.0%) | 0 (0.0%) |
| 25 to 34 Year Olds | 0 (0.0%) | 0 (0.0%) |
| 35 Years and over | 0 (0.0%) | 0 (0.0%) |
| Total | 146 (80.7%) | 35 (19.3%) |
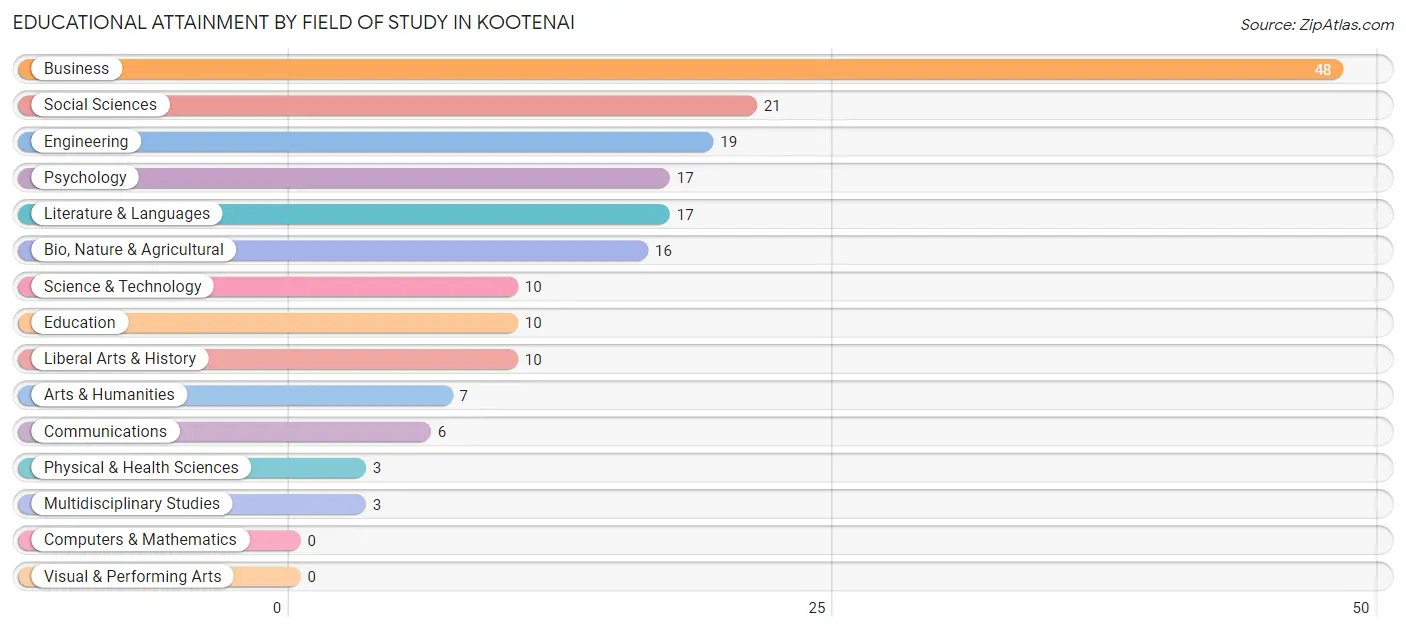
Educational Attainment by Field of Study in Kootenai
Business (48 | 25.7%), social sciences (21 | 11.2%), engineering (19 | 10.2%), psychology (17 | 9.1%), and literature & languages (17 | 9.1%) are the most common fields of study among 187 individuals in Kootenai who have obtained a bachelor's degree or higher.
| Field of Study | # Graduates | % Graduates |
| Computers & Mathematics | 0 | 0.0% |
| Bio, Nature & Agricultural | 16 | 8.6% |
| Physical & Health Sciences | 3 | 1.6% |
| Psychology | 17 | 9.1% |
| Social Sciences | 21 | 11.2% |
| Engineering | 19 | 10.2% |
| Multidisciplinary Studies | 3 | 1.6% |
| Science & Technology | 10 | 5.3% |
| Business | 48 | 25.7% |
| Education | 10 | 5.3% |
| Literature & Languages | 17 | 9.1% |
| Liberal Arts & History | 10 | 5.3% |
| Visual & Performing Arts | 0 | 0.0% |
| Communications | 6 | 3.2% |
| Arts & Humanities | 7 | 3.7% |
| Total | 187 | 100.0% |
Transportation & Commute in Kootenai
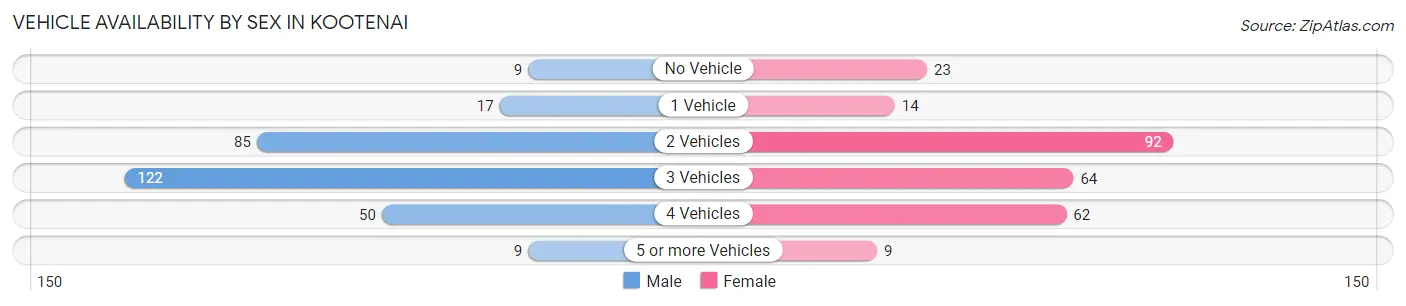
Vehicle Availability by Sex in Kootenai
The most prevalent vehicle ownership categories in Kootenai are males with 3 vehicles (122, accounting for 41.8%) and females with 3 vehicles (64, making up 46.2%).
| Vehicles Available | Male | Female |
| No Vehicle | 9 (3.1%) | 23 (8.7%) |
| 1 Vehicle | 17 (5.8%) | 14 (5.3%) |
| 2 Vehicles | 85 (29.1%) | 92 (34.8%) |
| 3 Vehicles | 122 (41.8%) | 64 (24.2%) |
| 4 Vehicles | 50 (17.1%) | 62 (23.5%) |
| 5 or more Vehicles | 9 (3.1%) | 9 (3.4%) |
| Total | 292 (100.0%) | 264 (100.0%) |
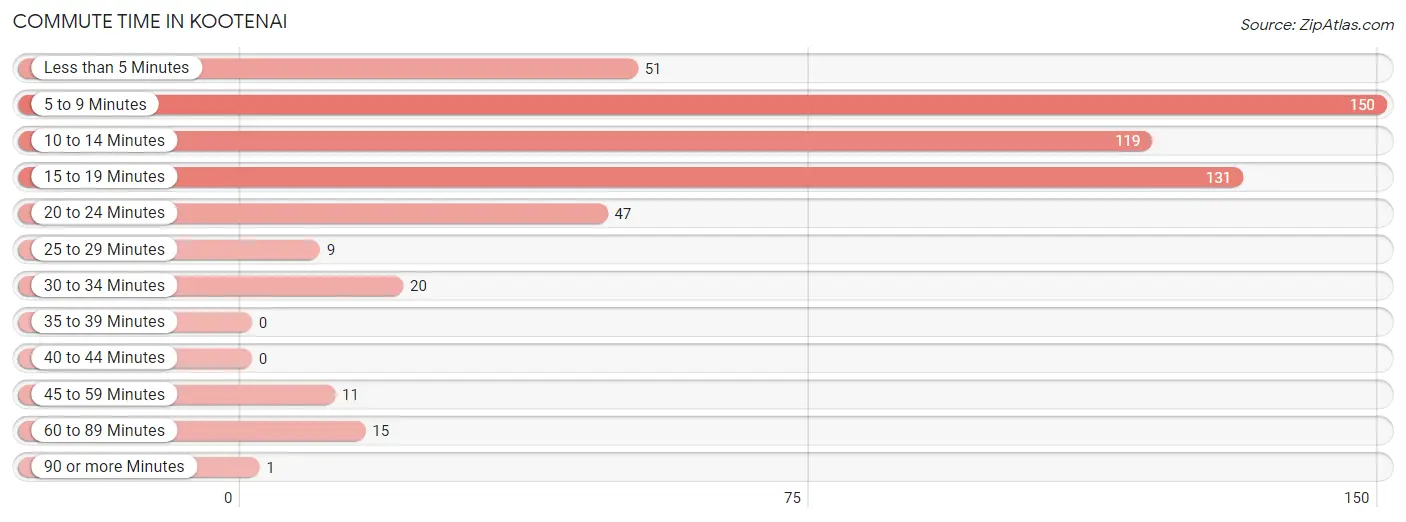
Commute Time in Kootenai
The most frequently occuring commute durations in Kootenai are 5 to 9 minutes (150 commuters, 27.1%), 15 to 19 minutes (131 commuters, 23.6%), and 10 to 14 minutes (119 commuters, 21.5%).
| Commute Time | # Commuters | % Commuters |
| Less than 5 Minutes | 51 | 9.2% |
| 5 to 9 Minutes | 150 | 27.1% |
| 10 to 14 Minutes | 119 | 21.5% |
| 15 to 19 Minutes | 131 | 23.6% |
| 20 to 24 Minutes | 47 | 8.5% |
| 25 to 29 Minutes | 9 | 1.6% |
| 30 to 34 Minutes | 20 | 3.6% |
| 35 to 39 Minutes | 0 | 0.0% |
| 40 to 44 Minutes | 0 | 0.0% |
| 45 to 59 Minutes | 11 | 2.0% |
| 60 to 89 Minutes | 15 | 2.7% |
| 90 or more Minutes | 1 | 0.2% |
Commute Time by Sex in Kootenai
The most common commute times in Kootenai are 5 to 9 minutes (79 commuters, 27.3%) for males and 5 to 9 minutes (71 commuters, 26.8%) for females.
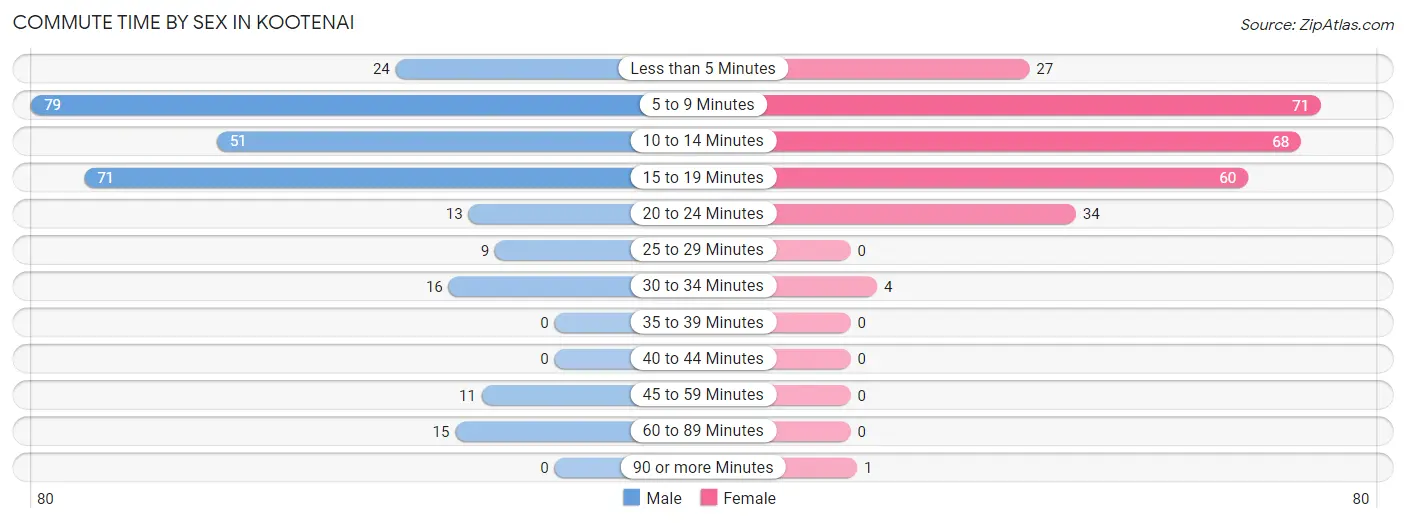
| Commute Time | Male | Female |
| Less than 5 Minutes | 24 (8.3%) | 27 (10.2%) |
| 5 to 9 Minutes | 79 (27.3%) | 71 (26.8%) |
| 10 to 14 Minutes | 51 (17.6%) | 68 (25.7%) |
| 15 to 19 Minutes | 71 (24.6%) | 60 (22.6%) |
| 20 to 24 Minutes | 13 (4.5%) | 34 (12.8%) |
| 25 to 29 Minutes | 9 (3.1%) | 0 (0.0%) |
| 30 to 34 Minutes | 16 (5.5%) | 4 (1.5%) |
| 35 to 39 Minutes | 0 (0.0%) | 0 (0.0%) |
| 40 to 44 Minutes | 0 (0.0%) | 0 (0.0%) |
| 45 to 59 Minutes | 11 (3.8%) | 0 (0.0%) |
| 60 to 89 Minutes | 15 (5.2%) | 0 (0.0%) |
| 90 or more Minutes | 0 (0.0%) | 1 (0.4%) |
Time of Departure to Work by Sex in Kootenai
The most frequent times of departure to work in Kootenai are 6:00 AM to 6:29 AM (41, 14.2%) for males and 7:30 AM to 7:59 AM (69, 26.0%) for females.
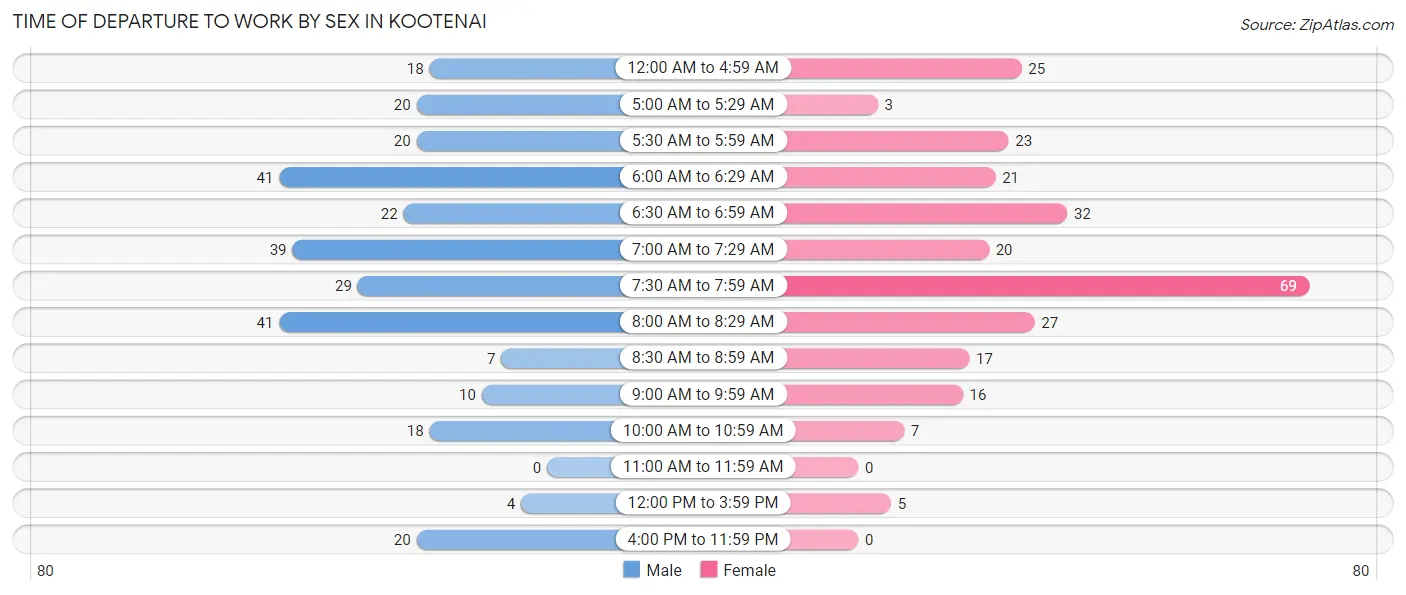
| Time of Departure | Male | Female |
| 12:00 AM to 4:59 AM | 18 (6.2%) | 25 (9.4%) |
| 5:00 AM to 5:29 AM | 20 (6.9%) | 3 (1.1%) |
| 5:30 AM to 5:59 AM | 20 (6.9%) | 23 (8.7%) |
| 6:00 AM to 6:29 AM | 41 (14.2%) | 21 (7.9%) |
| 6:30 AM to 6:59 AM | 22 (7.6%) | 32 (12.1%) |
| 7:00 AM to 7:29 AM | 39 (13.5%) | 20 (7.5%) |
| 7:30 AM to 7:59 AM | 29 (10.0%) | 69 (26.0%) |
| 8:00 AM to 8:29 AM | 41 (14.2%) | 27 (10.2%) |
| 8:30 AM to 8:59 AM | 7 (2.4%) | 17 (6.4%) |
| 9:00 AM to 9:59 AM | 10 (3.5%) | 16 (6.0%) |
| 10:00 AM to 10:59 AM | 18 (6.2%) | 7 (2.6%) |
| 11:00 AM to 11:59 AM | 0 (0.0%) | 0 (0.0%) |
| 12:00 PM to 3:59 PM | 4 (1.4%) | 5 (1.9%) |
| 4:00 PM to 11:59 PM | 20 (6.9%) | 0 (0.0%) |
| Total | 289 (100.0%) | 265 (100.0%) |
Housing Occupancy in Kootenai
Occupancy by Ownership in Kootenai
Of the total 422 dwellings in Kootenai, owner-occupied units account for 342 (81.0%), while renter-occupied units make up 80 (19.0%).
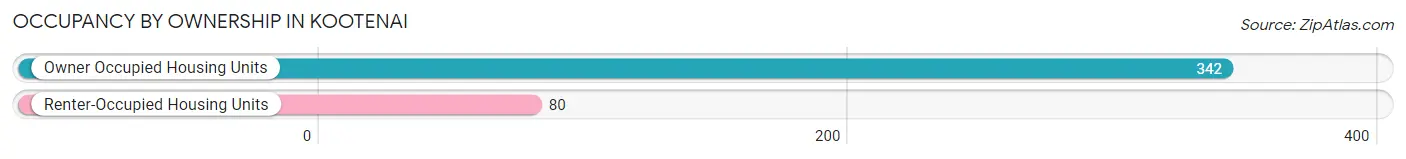
| Occupancy | # Housing Units | % Housing Units |
| Owner Occupied Housing Units | 342 | 81.0% |
| Renter-Occupied Housing Units | 80 | 19.0% |
| Total Occupied Housing Units | 422 | 100.0% |
Occupancy by Household Size in Kootenai
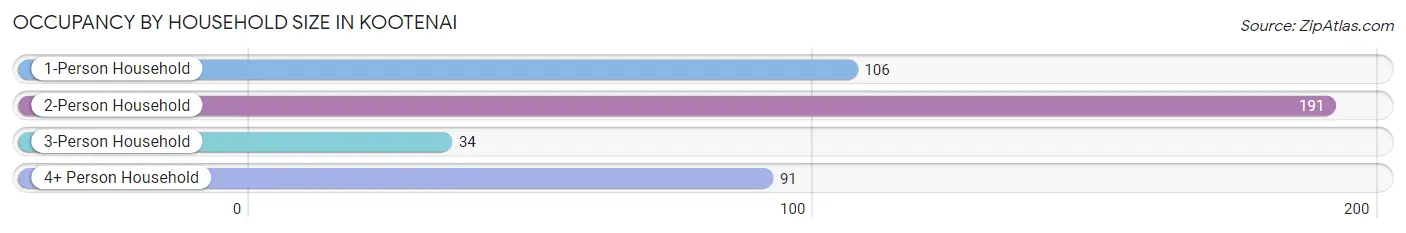
| Household Size | # Housing Units | % Housing Units |
| 1-Person Household | 106 | 25.1% |
| 2-Person Household | 191 | 45.3% |
| 3-Person Household | 34 | 8.1% |
| 4+ Person Household | 91 | 21.6% |
| Total Housing Units | 422 | 100.0% |
Occupancy by Ownership by Household Size in Kootenai
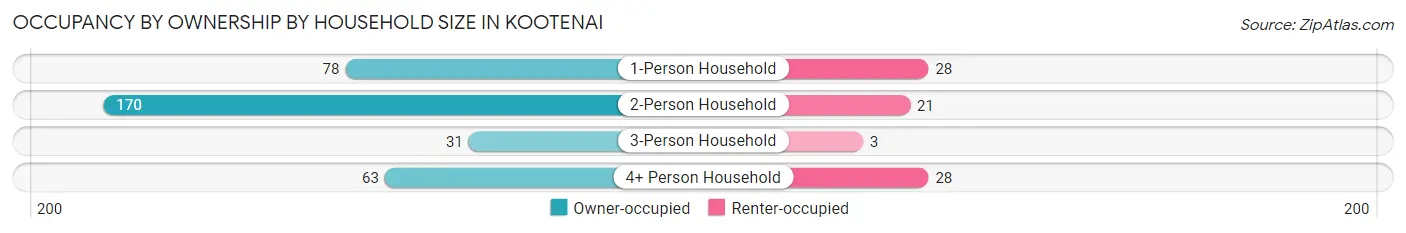
| Household Size | Owner-occupied | Renter-occupied |
| 1-Person Household | 78 (73.6%) | 28 (26.4%) |
| 2-Person Household | 170 (89.0%) | 21 (11.0%) |
| 3-Person Household | 31 (91.2%) | 3 (8.8%) |
| 4+ Person Household | 63 (69.2%) | 28 (30.8%) |
| Total Housing Units | 342 (81.0%) | 80 (19.0%) |
Occupancy by Educational Attainment in Kootenai
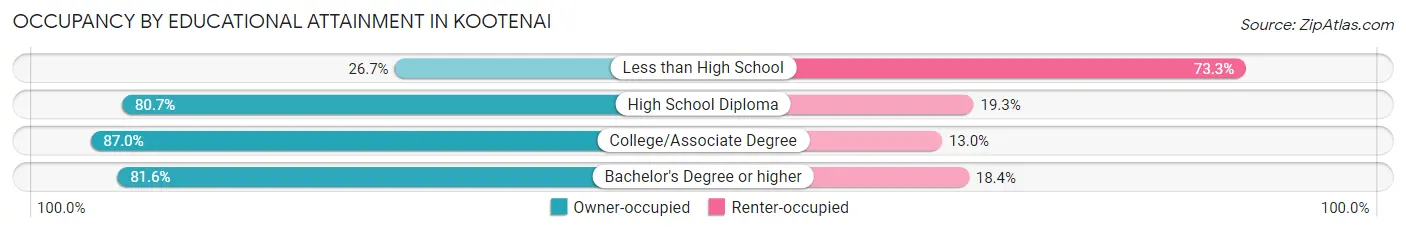
| Household Size | Owner-occupied | Renter-occupied |
| Less than High School | 4 (26.7%) | 11 (73.3%) |
| High School Diploma | 138 (80.7%) | 33 (19.3%) |
| College/Associate Degree | 120 (87.0%) | 18 (13.0%) |
| Bachelor's Degree or higher | 80 (81.6%) | 18 (18.4%) |
Occupancy by Age of Householder in Kootenai
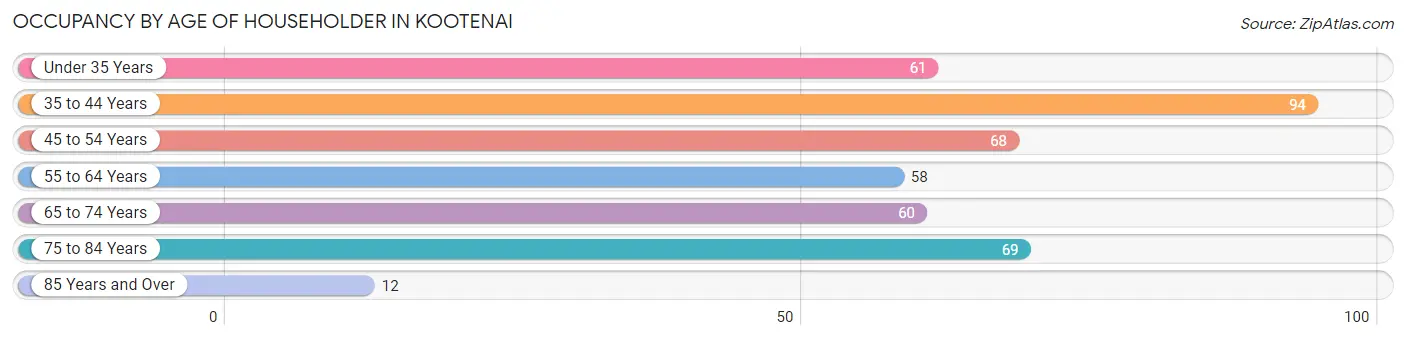
| Age Bracket | # Households | % Households |
| Under 35 Years | 61 | 14.4% |
| 35 to 44 Years | 94 | 22.3% |
| 45 to 54 Years | 68 | 16.1% |
| 55 to 64 Years | 58 | 13.7% |
| 65 to 74 Years | 60 | 14.2% |
| 75 to 84 Years | 69 | 16.4% |
| 85 Years and Over | 12 | 2.8% |
| Total | 422 | 100.0% |
Housing Finances in Kootenai
Median Income by Occupancy in Kootenai
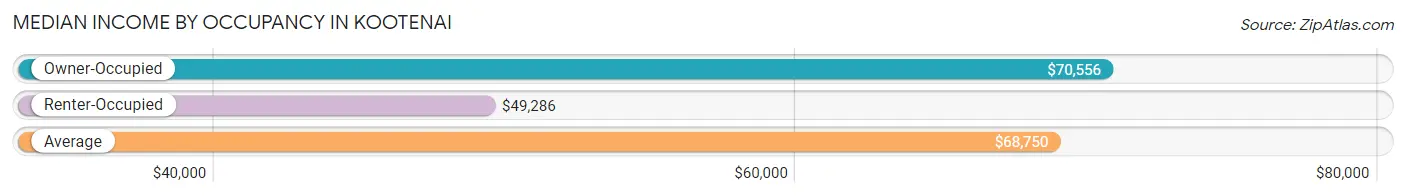
| Occupancy Type | # Households | Median Income |
| Owner-Occupied | 342 (81.0%) | $70,556 |
| Renter-Occupied | 80 (19.0%) | $49,286 |
| Average | 422 (100.0%) | $68,750 |
Occupancy by Householder Income Bracket in Kootenai
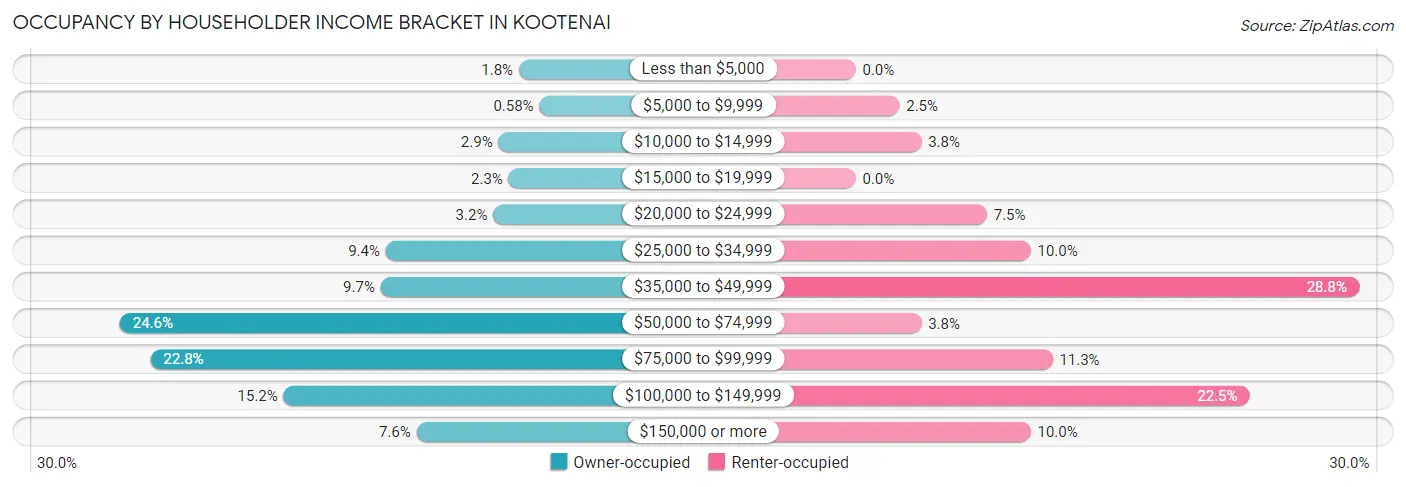
| Income Bracket | Owner-occupied | Renter-occupied |
| Less than $5,000 | 6 (1.8%) | 0 (0.0%) |
| $5,000 to $9,999 | 2 (0.6%) | 2 (2.5%) |
| $10,000 to $14,999 | 10 (2.9%) | 3 (3.7%) |
| $15,000 to $19,999 | 8 (2.3%) | 0 (0.0%) |
| $20,000 to $24,999 | 11 (3.2%) | 6 (7.5%) |
| $25,000 to $34,999 | 32 (9.4%) | 8 (10.0%) |
| $35,000 to $49,999 | 33 (9.7%) | 23 (28.7%) |
| $50,000 to $74,999 | 84 (24.6%) | 3 (3.7%) |
| $75,000 to $99,999 | 78 (22.8%) | 9 (11.3%) |
| $100,000 to $149,999 | 52 (15.2%) | 18 (22.5%) |
| $150,000 or more | 26 (7.6%) | 8 (10.0%) |
| Total | 342 (100.0%) | 80 (100.0%) |
Monthly Housing Cost Tiers in Kootenai
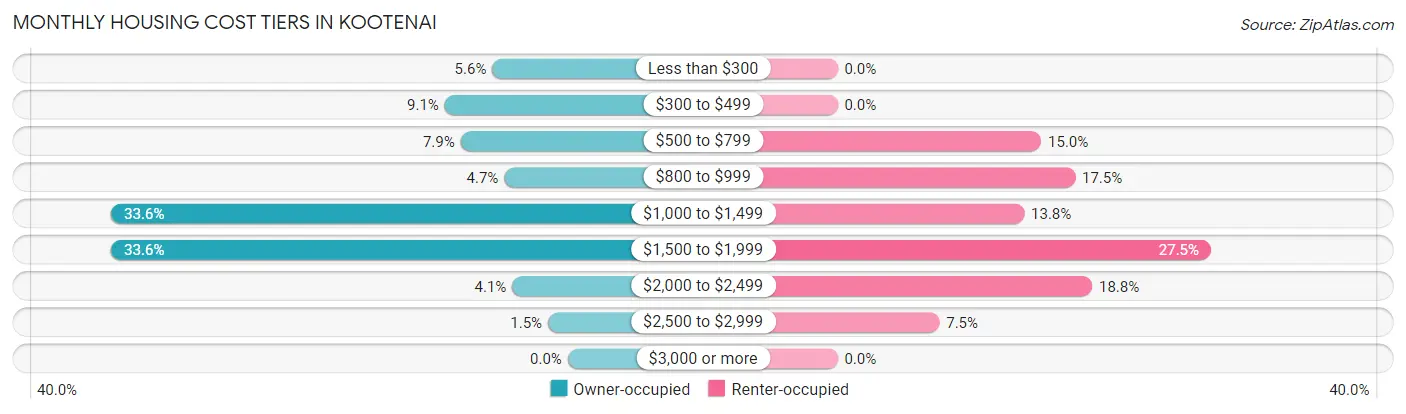
| Monthly Cost | Owner-occupied | Renter-occupied |
| Less than $300 | 19 (5.6%) | 0 (0.0%) |
| $300 to $499 | 31 (9.1%) | 0 (0.0%) |
| $500 to $799 | 27 (7.9%) | 12 (15.0%) |
| $800 to $999 | 16 (4.7%) | 14 (17.5%) |
| $1,000 to $1,499 | 115 (33.6%) | 11 (13.8%) |
| $1,500 to $1,999 | 115 (33.6%) | 22 (27.5%) |
| $2,000 to $2,499 | 14 (4.1%) | 15 (18.8%) |
| $2,500 to $2,999 | 5 (1.5%) | 6 (7.5%) |
| $3,000 or more | 0 (0.0%) | 0 (0.0%) |
| Total | 342 (100.0%) | 80 (100.0%) |
Physical Housing Characteristics in Kootenai
Housing Structures in Kootenai
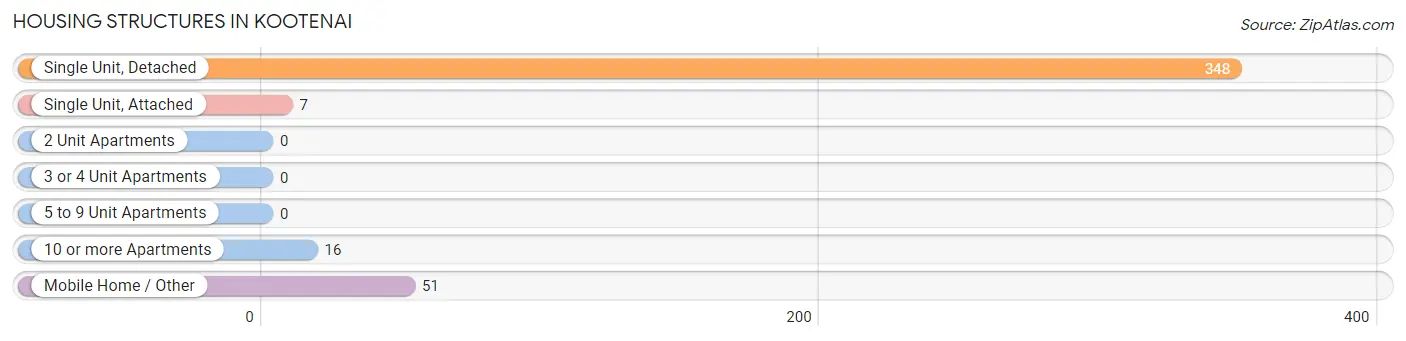
| Structure Type | # Housing Units | % Housing Units |
| Single Unit, Detached | 348 | 82.5% |
| Single Unit, Attached | 7 | 1.7% |
| 2 Unit Apartments | 0 | 0.0% |
| 3 or 4 Unit Apartments | 0 | 0.0% |
| 5 to 9 Unit Apartments | 0 | 0.0% |
| 10 or more Apartments | 16 | 3.8% |
| Mobile Home / Other | 51 | 12.1% |
| Total | 422 | 100.0% |
Housing Structures by Occupancy in Kootenai
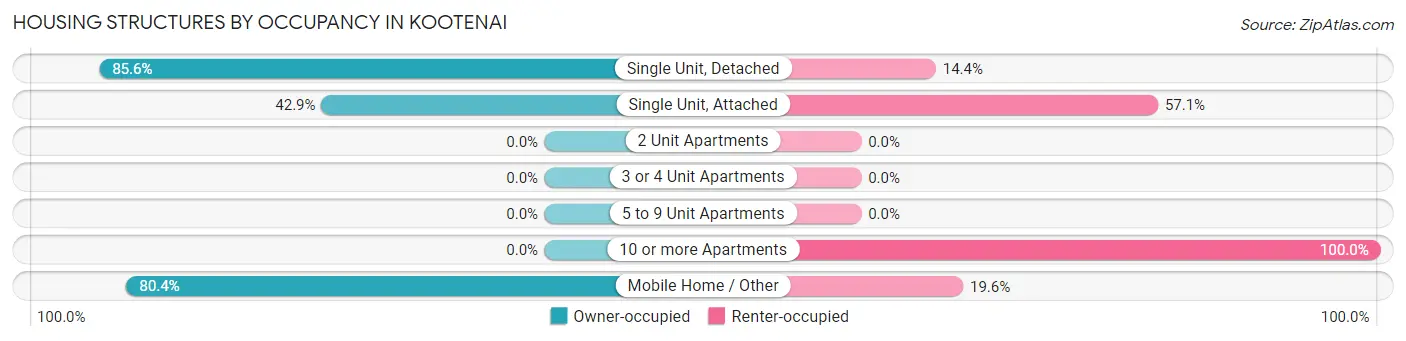
| Structure Type | Owner-occupied | Renter-occupied |
| Single Unit, Detached | 298 (85.6%) | 50 (14.4%) |
| Single Unit, Attached | 3 (42.9%) | 4 (57.1%) |
| 2 Unit Apartments | 0 (0.0%) | 0 (0.0%) |
| 3 or 4 Unit Apartments | 0 (0.0%) | 0 (0.0%) |
| 5 to 9 Unit Apartments | 0 (0.0%) | 0 (0.0%) |
| 10 or more Apartments | 0 (0.0%) | 16 (100.0%) |
| Mobile Home / Other | 41 (80.4%) | 10 (19.6%) |
| Total | 342 (81.0%) | 80 (19.0%) |
Housing Structures by Number of Rooms in Kootenai
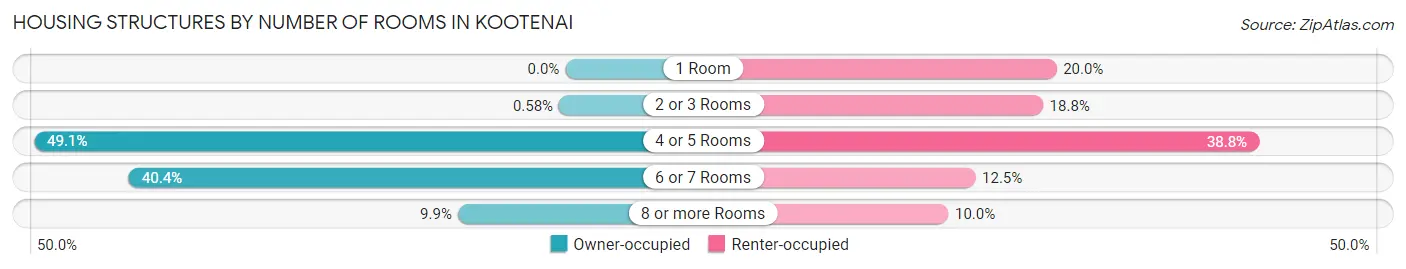
| Number of Rooms | Owner-occupied | Renter-occupied |
| 1 Room | 0 (0.0%) | 16 (20.0%) |
| 2 or 3 Rooms | 2 (0.6%) | 15 (18.8%) |
| 4 or 5 Rooms | 168 (49.1%) | 31 (38.8%) |
| 6 or 7 Rooms | 138 (40.4%) | 10 (12.5%) |
| 8 or more Rooms | 34 (9.9%) | 8 (10.0%) |
| Total | 342 (100.0%) | 80 (100.0%) |
Housing Structure by Heating Type in Kootenai
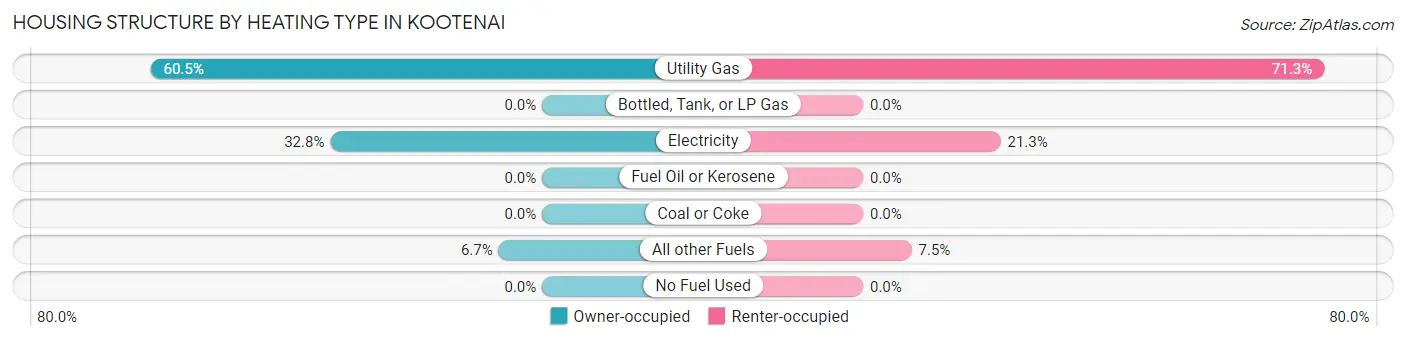
| Heating Type | Owner-occupied | Renter-occupied |
| Utility Gas | 207 (60.5%) | 57 (71.3%) |
| Bottled, Tank, or LP Gas | 0 (0.0%) | 0 (0.0%) |
| Electricity | 112 (32.8%) | 17 (21.2%) |
| Fuel Oil or Kerosene | 0 (0.0%) | 0 (0.0%) |
| Coal or Coke | 0 (0.0%) | 0 (0.0%) |
| All other Fuels | 23 (6.7%) | 6 (7.5%) |
| No Fuel Used | 0 (0.0%) | 0 (0.0%) |
| Total | 342 (100.0%) | 80 (100.0%) |
Household Vehicle Usage in Kootenai
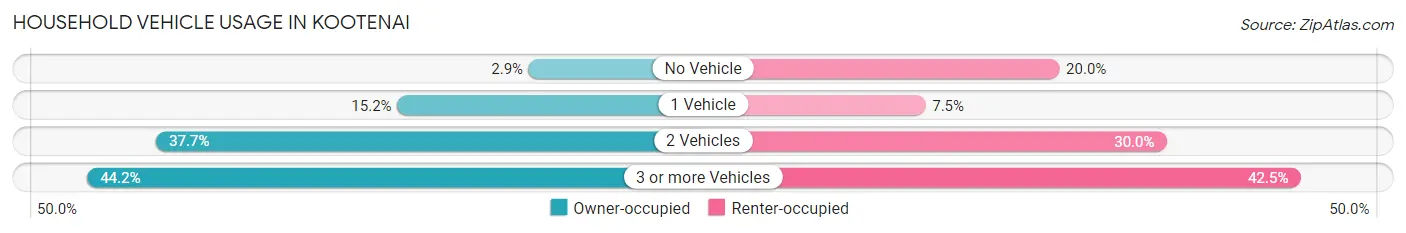
| Vehicles per Household | Owner-occupied | Renter-occupied |
| No Vehicle | 10 (2.9%) | 16 (20.0%) |
| 1 Vehicle | 52 (15.2%) | 6 (7.5%) |
| 2 Vehicles | 129 (37.7%) | 24 (30.0%) |
| 3 or more Vehicles | 151 (44.2%) | 34 (42.5%) |
| Total | 342 (100.0%) | 80 (100.0%) |
Real Estate & Mortgages in Kootenai
Real Estate and Mortgage Overview in Kootenai
| Characteristic | Without Mortgage | With Mortgage |
| Housing Units | 46 | 296 |
| Median Property Value | $296,700 | $285,700 |
| Median Household Income | - | - |
| Monthly Housing Costs | $360 | $0 |
| Real Estate Taxes | $943 | $2 |
Property Value by Mortgage Status in Kootenai
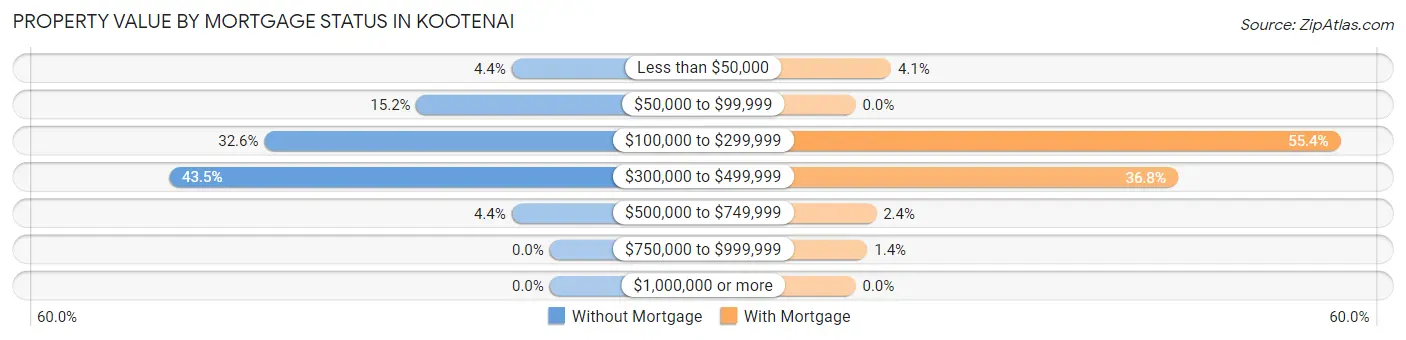
| Property Value | Without Mortgage | With Mortgage |
| Less than $50,000 | 2 (4.3%) | 12 (4.1%) |
| $50,000 to $99,999 | 7 (15.2%) | 0 (0.0%) |
| $100,000 to $299,999 | 15 (32.6%) | 164 (55.4%) |
| $300,000 to $499,999 | 20 (43.5%) | 109 (36.8%) |
| $500,000 to $749,999 | 2 (4.3%) | 7 (2.4%) |
| $750,000 to $999,999 | 0 (0.0%) | 4 (1.3%) |
| $1,000,000 or more | 0 (0.0%) | 0 (0.0%) |
| Total | 46 (100.0%) | 296 (100.0%) |
Household Income by Mortgage Status in Kootenai
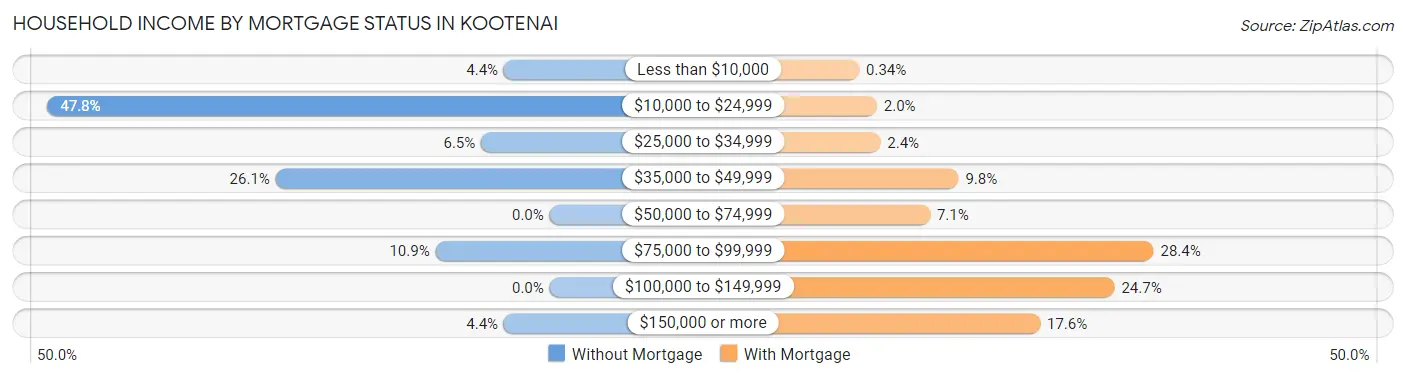
| Household Income | Without Mortgage | With Mortgage |
| Less than $10,000 | 2 (4.3%) | 1 (0.3%) |
| $10,000 to $24,999 | 22 (47.8%) | 6 (2.0%) |
| $25,000 to $34,999 | 3 (6.5%) | 7 (2.4%) |
| $35,000 to $49,999 | 12 (26.1%) | 29 (9.8%) |
| $50,000 to $74,999 | 0 (0.0%) | 21 (7.1%) |
| $75,000 to $99,999 | 5 (10.9%) | 84 (28.4%) |
| $100,000 to $149,999 | 0 (0.0%) | 73 (24.7%) |
| $150,000 or more | 2 (4.3%) | 52 (17.6%) |
| Total | 46 (100.0%) | 296 (100.0%) |
Property Value to Household Income Ratio in Kootenai
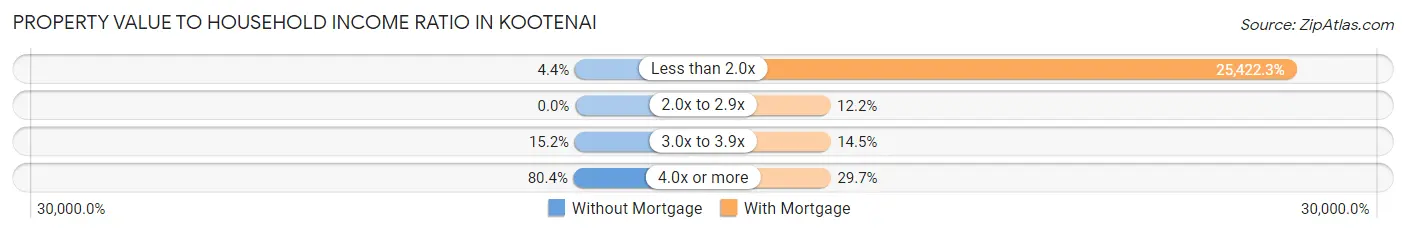
| Value-to-Income Ratio | Without Mortgage | With Mortgage |
| Less than 2.0x | 2 (4.3%) | 75,250 (25,422.3%) |
| 2.0x to 2.9x | 0 (0.0%) | 36 (12.2%) |
| 3.0x to 3.9x | 7 (15.2%) | 43 (14.5%) |
| 4.0x or more | 37 (80.4%) | 88 (29.7%) |
| Total | 46 (100.0%) | 296 (100.0%) |
Real Estate Taxes by Mortgage Status in Kootenai
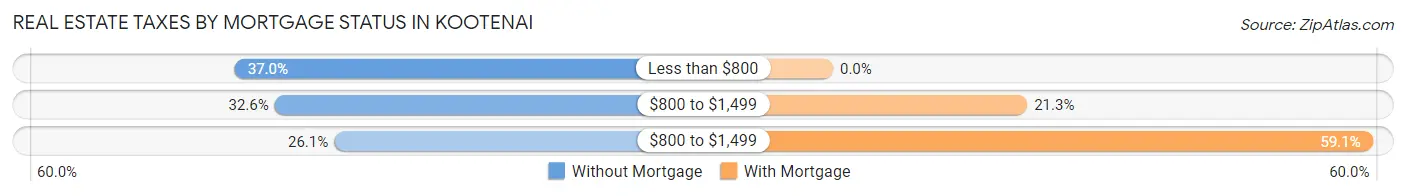
| Property Taxes | Without Mortgage | With Mortgage |
| Less than $800 | 17 (37.0%) | 0 (0.0%) |
| $800 to $1,499 | 15 (32.6%) | 63 (21.3%) |
| $800 to $1,499 | 12 (26.1%) | 175 (59.1%) |
| Total | 46 (100.0%) | 296 (100.0%) |
Health & Disability in Kootenai
Health Insurance Coverage by Age in Kootenai
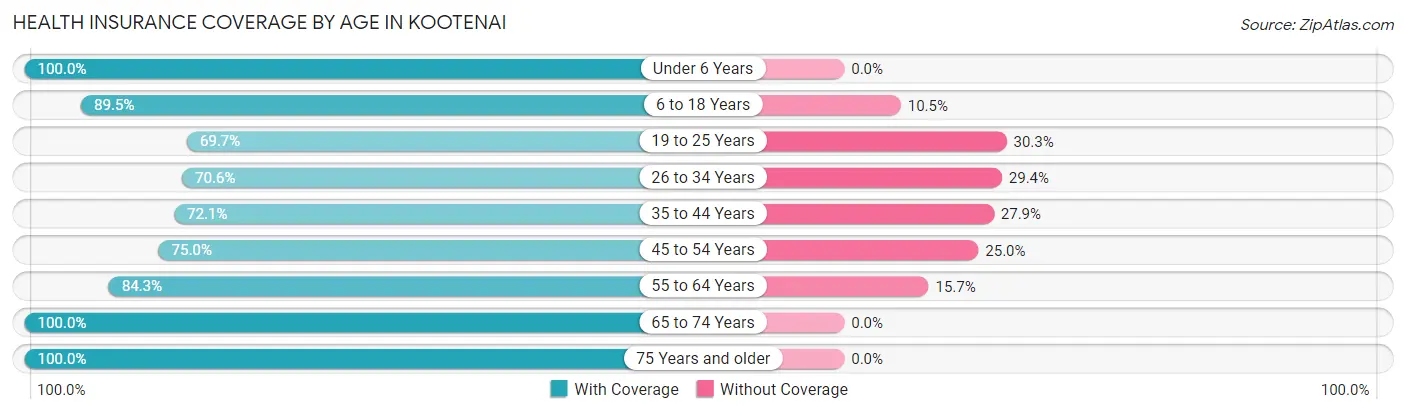
| Age Bracket | With Coverage | Without Coverage |
| Under 6 Years | 118 (100.0%) | 0 (0.0%) |
| 6 to 18 Years | 170 (89.5%) | 20 (10.5%) |
| 19 to 25 Years | 53 (69.7%) | 23 (30.3%) |
| 26 to 34 Years | 113 (70.6%) | 47 (29.4%) |
| 35 to 44 Years | 137 (72.1%) | 53 (27.9%) |
| 45 to 54 Years | 69 (75.0%) | 23 (25.0%) |
| 55 to 64 Years | 118 (84.3%) | 22 (15.7%) |
| 65 to 74 Years | 80 (100.0%) | 0 (0.0%) |
| 75 Years and older | 101 (100.0%) | 0 (0.0%) |
| Total | 959 (83.6%) | 188 (16.4%) |
Health Insurance Coverage by Citizenship Status in Kootenai
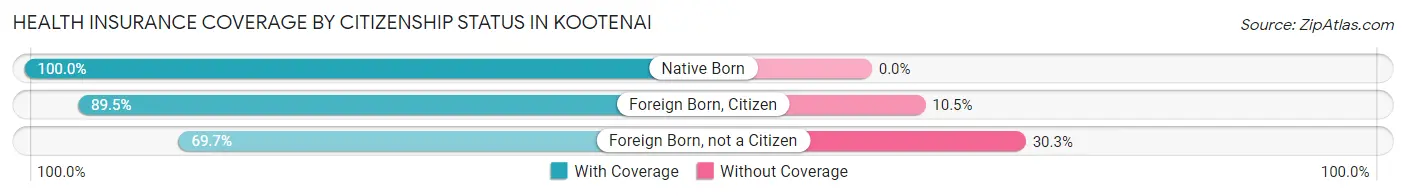
| Citizenship Status | With Coverage | Without Coverage |
| Native Born | 118 (100.0%) | 0 (0.0%) |
| Foreign Born, Citizen | 170 (89.5%) | 20 (10.5%) |
| Foreign Born, not a Citizen | 53 (69.7%) | 23 (30.3%) |
Health Insurance Coverage by Household Income in Kootenai
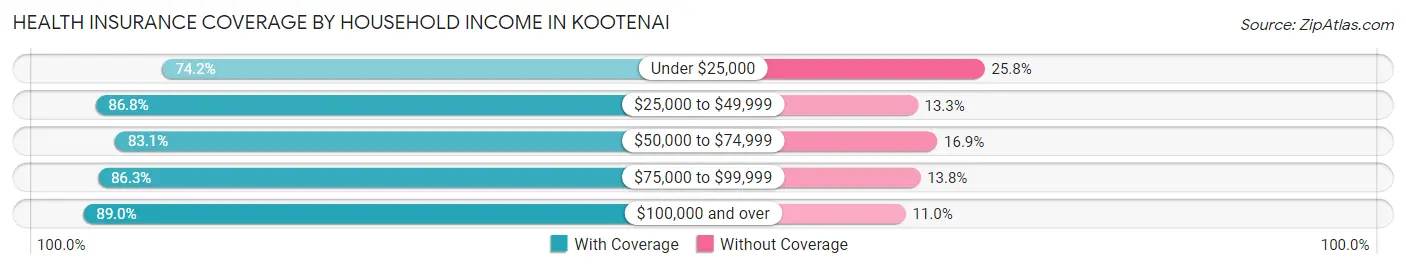
| Household Income | With Coverage | Without Coverage |
| Under $25,000 | 69 (74.2%) | 24 (25.8%) |
| $25,000 to $49,999 | 131 (86.8%) | 20 (13.3%) |
| $50,000 to $74,999 | 162 (83.1%) | 33 (16.9%) |
| $75,000 to $99,999 | 232 (86.3%) | 37 (13.8%) |
| $100,000 and over | 356 (89.0%) | 44 (11.0%) |
Public vs Private Health Insurance Coverage by Age in Kootenai
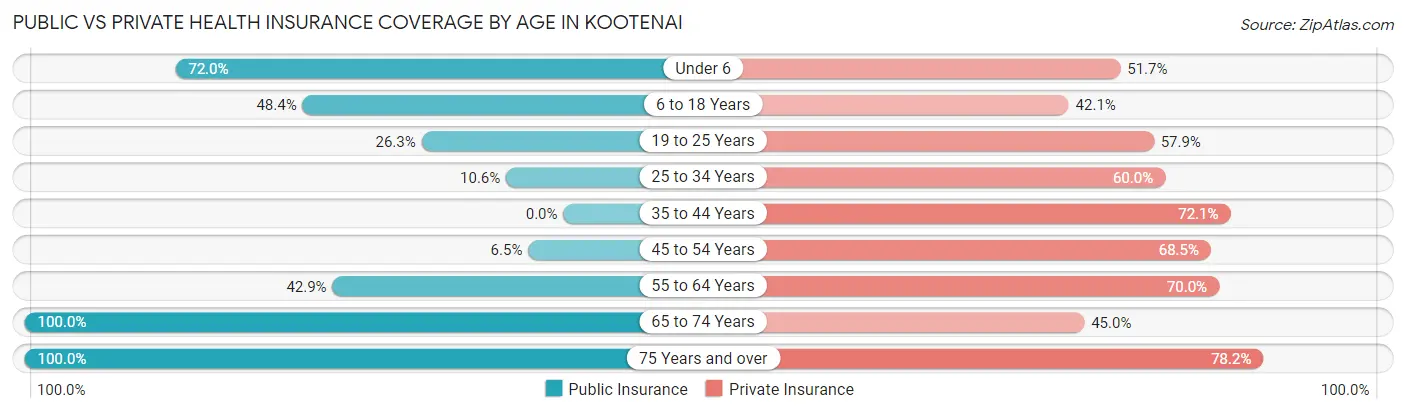
| Age Bracket | Public Insurance | Private Insurance |
| Under 6 | 85 (72.0%) | 61 (51.7%) |
| 6 to 18 Years | 92 (48.4%) | 80 (42.1%) |
| 19 to 25 Years | 20 (26.3%) | 44 (57.9%) |
| 25 to 34 Years | 17 (10.6%) | 96 (60.0%) |
| 35 to 44 Years | 0 (0.0%) | 137 (72.1%) |
| 45 to 54 Years | 6 (6.5%) | 63 (68.5%) |
| 55 to 64 Years | 60 (42.9%) | 98 (70.0%) |
| 65 to 74 Years | 80 (100.0%) | 36 (45.0%) |
| 75 Years and over | 101 (100.0%) | 79 (78.2%) |
| Total | 461 (40.2%) | 694 (60.5%) |
Disability Status by Sex by Age in Kootenai
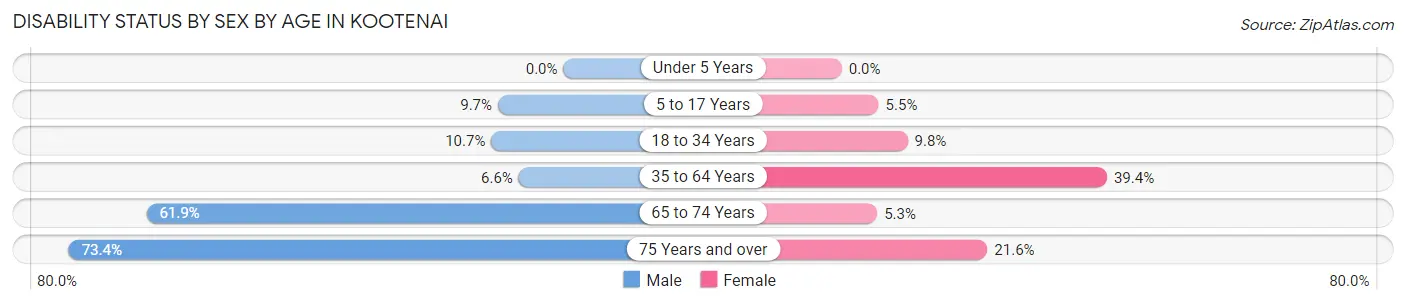
| Age Bracket | Male | Female |
| Under 5 Years | 0 (0.0%) | 0 (0.0%) |
| 5 to 17 Years | 7 (9.7%) | 7 (5.5%) |
| 18 to 34 Years | 12 (10.7%) | 13 (9.8%) |
| 35 to 64 Years | 13 (6.6%) | 89 (39.4%) |
| 65 to 74 Years | 26 (61.9%) | 2 (5.3%) |
| 75 Years and over | 47 (73.4%) | 8 (21.6%) |
Disability Class by Sex by Age in Kootenai
Disability Class: Hearing Difficulty
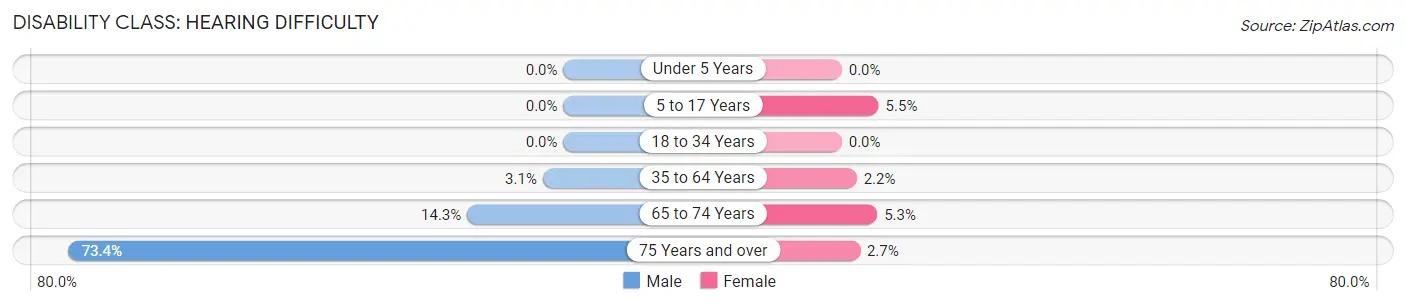
| Age Bracket | Male | Female |
| Under 5 Years | 0 (0.0%) | 0 (0.0%) |
| 5 to 17 Years | 0 (0.0%) | 7 (5.5%) |
| 18 to 34 Years | 0 (0.0%) | 0 (0.0%) |
| 35 to 64 Years | 6 (3.1%) | 5 (2.2%) |
| 65 to 74 Years | 6 (14.3%) | 2 (5.3%) |
| 75 Years and over | 47 (73.4%) | 1 (2.7%) |
Disability Class: Vision Difficulty
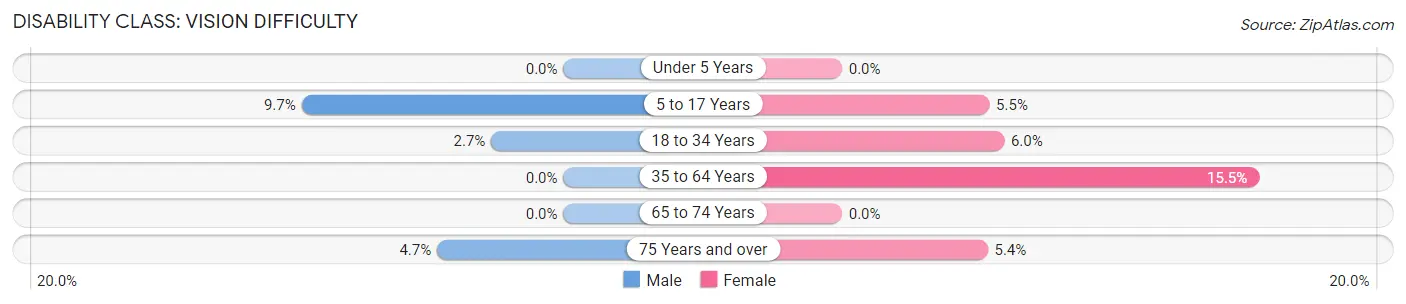
| Age Bracket | Male | Female |
| Under 5 Years | 0 (0.0%) | 0 (0.0%) |
| 5 to 17 Years | 7 (9.7%) | 7 (5.5%) |
| 18 to 34 Years | 3 (2.7%) | 8 (6.0%) |
| 35 to 64 Years | 0 (0.0%) | 35 (15.5%) |
| 65 to 74 Years | 0 (0.0%) | 0 (0.0%) |
| 75 Years and over | 3 (4.7%) | 2 (5.4%) |
Disability Class: Cognitive Difficulty
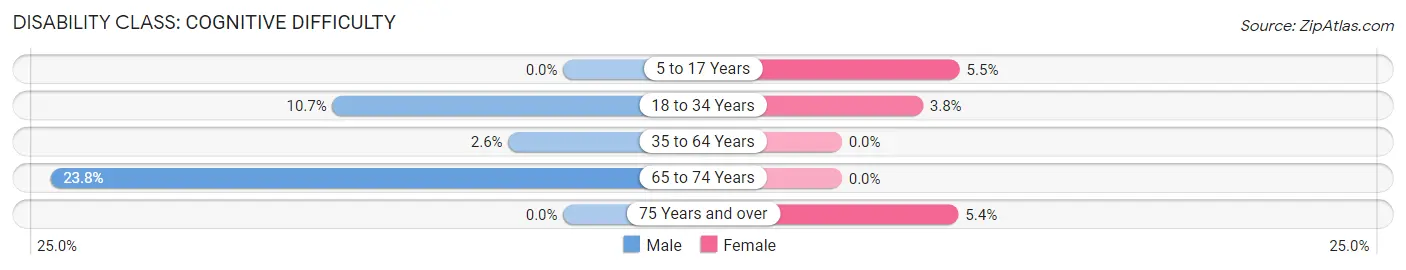
| Age Bracket | Male | Female |
| 5 to 17 Years | 0 (0.0%) | 7 (5.5%) |
| 18 to 34 Years | 12 (10.7%) | 5 (3.8%) |
| 35 to 64 Years | 5 (2.5%) | 0 (0.0%) |
| 65 to 74 Years | 10 (23.8%) | 0 (0.0%) |
| 75 Years and over | 0 (0.0%) | 2 (5.4%) |
Disability Class: Ambulatory Difficulty
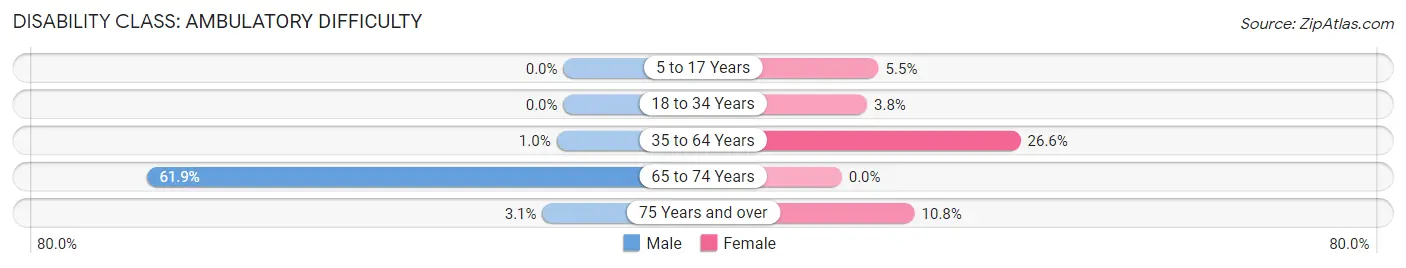
| Age Bracket | Male | Female |
| 5 to 17 Years | 0 (0.0%) | 7 (5.5%) |
| 18 to 34 Years | 0 (0.0%) | 5 (3.8%) |
| 35 to 64 Years | 2 (1.0%) | 60 (26.6%) |
| 65 to 74 Years | 26 (61.9%) | 0 (0.0%) |
| 75 Years and over | 2 (3.1%) | 4 (10.8%) |
Disability Class: Self-Care Difficulty
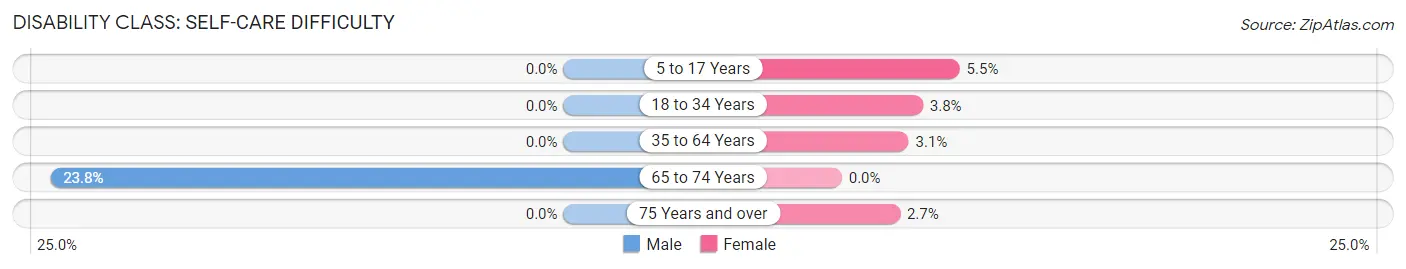
| Age Bracket | Male | Female |
| 5 to 17 Years | 0 (0.0%) | 7 (5.5%) |
| 18 to 34 Years | 0 (0.0%) | 5 (3.8%) |
| 35 to 64 Years | 0 (0.0%) | 7 (3.1%) |
| 65 to 74 Years | 10 (23.8%) | 0 (0.0%) |
| 75 Years and over | 0 (0.0%) | 1 (2.7%) |
Technology Access in Kootenai
Computing Device Access in Kootenai
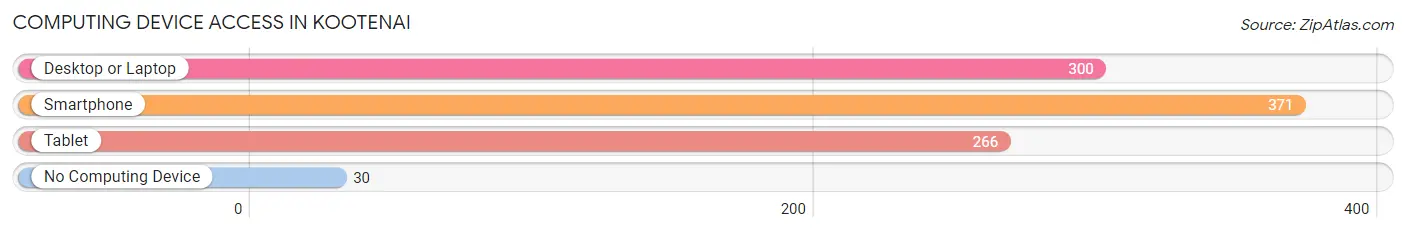
| Device Type | # Households | % Households |
| Desktop or Laptop | 300 | 71.1% |
| Smartphone | 371 | 87.9% |
| Tablet | 266 | 63.0% |
| No Computing Device | 30 | 7.1% |
| Total | 422 | 100.0% |
Internet Access in Kootenai
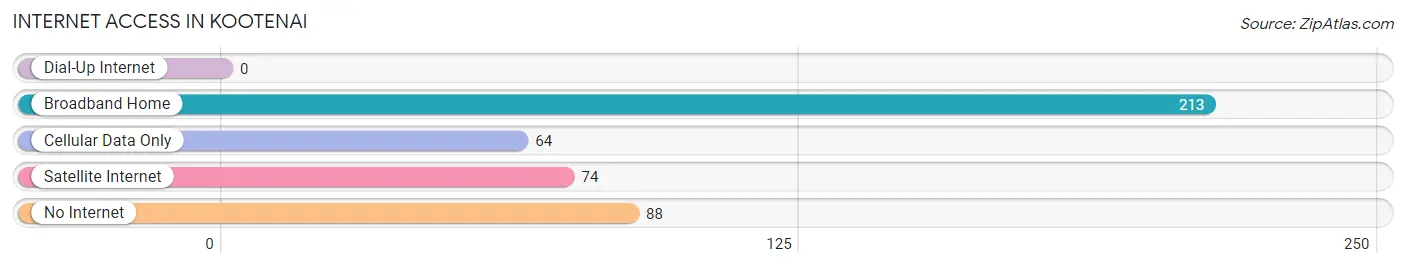
| Internet Type | # Households | % Households |
| Dial-Up Internet | 0 | 0.0% |
| Broadband Home | 213 | 50.5% |
| Cellular Data Only | 64 | 15.2% |
| Satellite Internet | 74 | 17.5% |
| No Internet | 88 | 20.8% |
| Total | 422 | 100.0% |
Kootenai Summary
Kootenai, Idaho is a small city located in the northern part of the state, near the border of Montana and Washington. It is the county seat of Kootenai County and is part of the Coeur d'Alene metropolitan area. The city has a population of approximately 2,500 people and is known for its small-town charm and outdoor recreation opportunities.
History
Kootenai was first settled in the late 1800s by miners and loggers who were drawn to the area by the abundance of natural resources. The city was officially incorporated in 1907 and was named after the Kootenai tribe, which had inhabited the area for centuries. The city grew steadily throughout the 20th century, and by the 1970s, it had become a popular tourist destination due to its proximity to the Coeur d'Alene National Forest and Lake Coeur d'Alene.
Geography
Kootenai is located in the northern part of Idaho, near the border of Montana and Washington. The city is situated in the Coeur d'Alene Mountains, which are part of the Rocky Mountains. The city is surrounded by forests and lakes, and is home to several parks and recreational areas. The city is located approximately 25 miles from the city of Coeur d'Alene and is accessible via Interstate 90.
Economy
Kootenai's economy is largely based on tourism and outdoor recreation. The city is home to several resorts and recreational areas, including the Coeur d'Alene National Forest and Lake Coeur d'Alene. The city is also home to several businesses, including restaurants, retail stores, and professional services. The city is also home to several manufacturing companies, including a paper mill and a lumber mill.
Demographics
As of the 2010 census, Kootenai had a population of 2,500 people. The racial makeup of the city was 94.2% White, 0.8% Native American, 0.4% Asian, 0.2% African American, and 4.4% from other races. The median household income was $37,500, and the median age was 39.7 years. The city is home to a variety of religious denominations, including Catholic, Protestant, and Mormon.
Kootenai is a small city with a rich history and a vibrant economy. The city is home to a variety of outdoor recreational opportunities, and is a popular tourist destination. The city is also home to a diverse population, with a variety of religious denominations and racial backgrounds. Kootenai is a great place to live, work, and play.
Common Questions
What is Per Capita Income in Kootenai?
Per Capita income in Kootenai is $30,101.
What is the Median Family Income in Kootenai?
Median Family Income in Kootenai is $76,667.
What is the Median Household income in Kootenai?
Median Household Income in Kootenai is $68,750.
What is Income or Wage Gap in Kootenai?
Income or Wage Gap in Kootenai is 32.0%.
Women in Kootenai earn 68.0 cents for every dollar earned by a man.
What is Inequality or Gini Index in Kootenai?
Inequality or Gini Index in Kootenai is 0.35.
What is the Total Population of Kootenai?
Total Population of Kootenai is 1,152.
What is the Total Male Population of Kootenai?
Total Male Population of Kootenai is 555.
What is the Total Female Population of Kootenai?
Total Female Population of Kootenai is 597.
What is the Ratio of Males per 100 Females in Kootenai?
There are 92.96 Males per 100 Females in Kootenai.
What is the Ratio of Females per 100 Males in Kootenai?
There are 107.57 Females per 100 Males in Kootenai.
What is the Median Population Age in Kootenai?
Median Population Age in Kootenai is 36.4 Years.
What is the Average Family Size in Kootenai
Average Family Size in Kootenai is 3.1 People.
What is the Average Household Size in Kootenai
Average Household Size in Kootenai is 2.6 People.
How Large is the Labor Force in Kootenai?
There are 618 People in the Labor Forcein in Kootenai.
What is the Percentage of People in the Labor Force in Kootenai?
67.8% of People are in the Labor Force in Kootenai.
What is the Unemployment Rate in Kootenai?
Unemployment Rate in Kootenai is 4.7%.