Council, ID Map & Demographics
Council Map
Council Overview
$21,527
PER CAPITA INCOME
$46,250
AVG FAMILY INCOME
$42,222
AVG HOUSEHOLD INCOME
$9,133
FAMILY INCOME DEFICIT
0.42
INEQUALITY / GINI INDEX
655
TOTAL POPULATION
300
MALE POPULATION
355
FEMALE POPULATION
84.51
MALES / 100 FEMALES
118.33
FEMALES / 100 MALES
59.4
MEDIAN AGE
2.9
AVG FAMILY SIZE
2.2
AVG HOUSEHOLD SIZE
182
LABOR FORCE [ PEOPLE ]
32.3%
PERCENT IN LABOR FORCE
15.9%
UNEMPLOYMENT RATE
Council Zip Codes
Council Area Codes
Income in Council
Income Overview in Council
Per Capita Income in Council is $21,527, while median incomes of families and households are $46,250 and $42,222 respectively.
| Characteristic | Number | Measure |
| Per Capita Income | 655 | $21,527 |
| Median Family Income | 148 | $46,250 |
| Mean Family Income | 148 | $55,235 |
| Median Household Income | 288 | $42,222 |
| Mean Household Income | 288 | $43,735 |
| Income Deficit | 148 | $9,133 |
| Wage / Income Gap (%) | 655 | 0.00% |
| Wage / Income Gap ($) | 655 | 100.00¢ per $1 |
| Gini / Inequality Index | 655 | 0.42 |
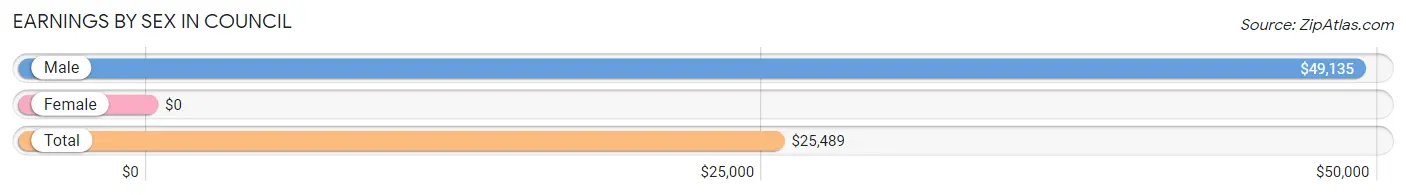
Earnings by Sex in Council
| Sex | Number | Average Earnings |
| Male | 117 (53.9%) | $49,135 |
| Female | 100 (46.1%) | $0 |
| Total | 217 (100.0%) | $25,489 |
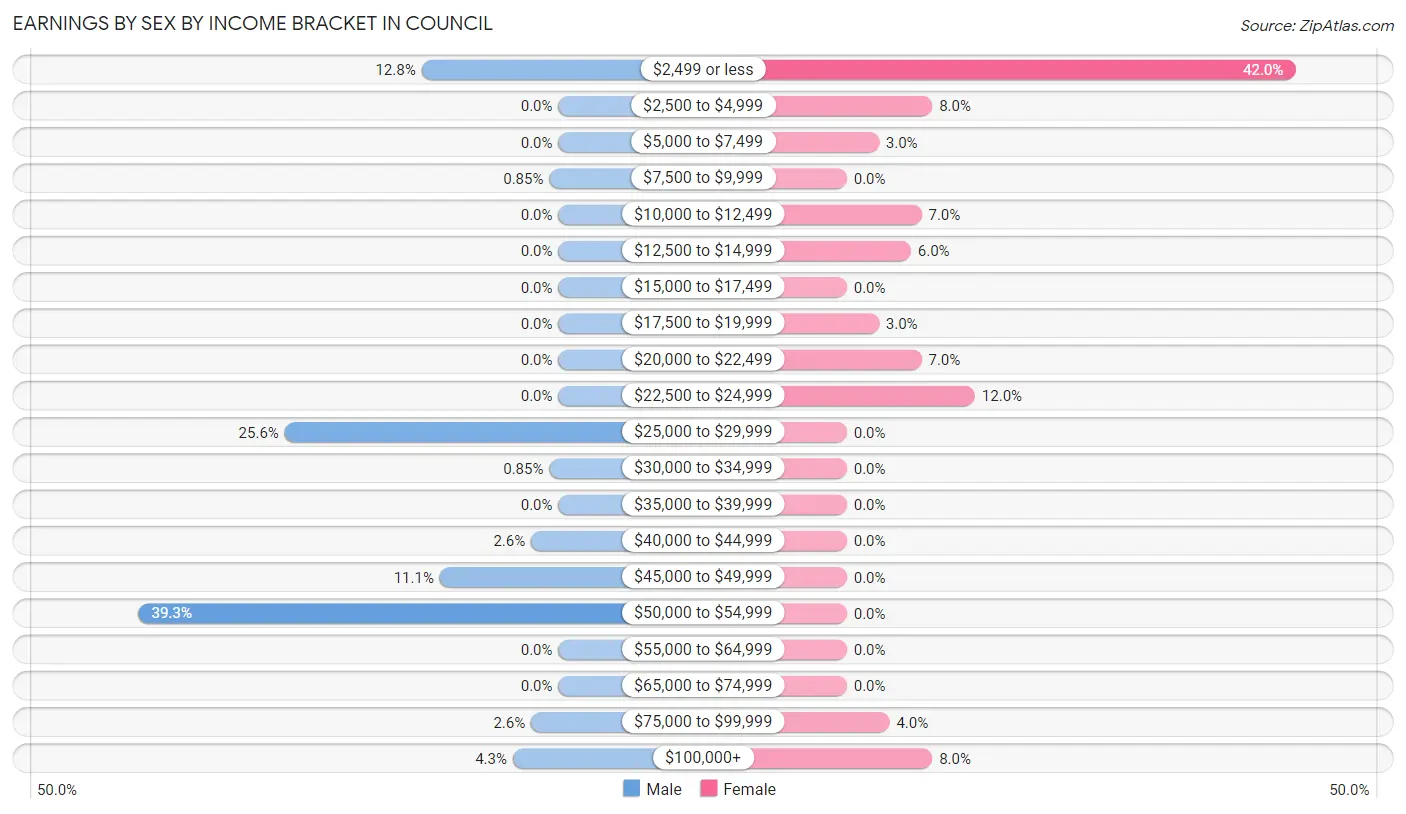
Earnings by Sex by Income Bracket in Council
The most common earnings brackets in Council are $50,000 to $54,999 for men (46 | 39.3%) and $2,499 or less for women (42 | 42.0%).
| Income | Male | Female |
| $2,499 or less | 15 (12.8%) | 42 (42.0%) |
| $2,500 to $4,999 | 0 (0.0%) | 8 (8.0%) |
| $5,000 to $7,499 | 0 (0.0%) | 3 (3.0%) |
| $7,500 to $9,999 | 1 (0.9%) | 0 (0.0%) |
| $10,000 to $12,499 | 0 (0.0%) | 7 (7.0%) |
| $12,500 to $14,999 | 0 (0.0%) | 6 (6.0%) |
| $15,000 to $17,499 | 0 (0.0%) | 0 (0.0%) |
| $17,500 to $19,999 | 0 (0.0%) | 3 (3.0%) |
| $20,000 to $22,499 | 0 (0.0%) | 7 (7.0%) |
| $22,500 to $24,999 | 0 (0.0%) | 12 (12.0%) |
| $25,000 to $29,999 | 30 (25.6%) | 0 (0.0%) |
| $30,000 to $34,999 | 1 (0.9%) | 0 (0.0%) |
| $35,000 to $39,999 | 0 (0.0%) | 0 (0.0%) |
| $40,000 to $44,999 | 3 (2.6%) | 0 (0.0%) |
| $45,000 to $49,999 | 13 (11.1%) | 0 (0.0%) |
| $50,000 to $54,999 | 46 (39.3%) | 0 (0.0%) |
| $55,000 to $64,999 | 0 (0.0%) | 0 (0.0%) |
| $65,000 to $74,999 | 0 (0.0%) | 0 (0.0%) |
| $75,000 to $99,999 | 3 (2.6%) | 4 (4.0%) |
| $100,000+ | 5 (4.3%) | 8 (8.0%) |
| Total | 117 (100.0%) | 100 (100.0%) |
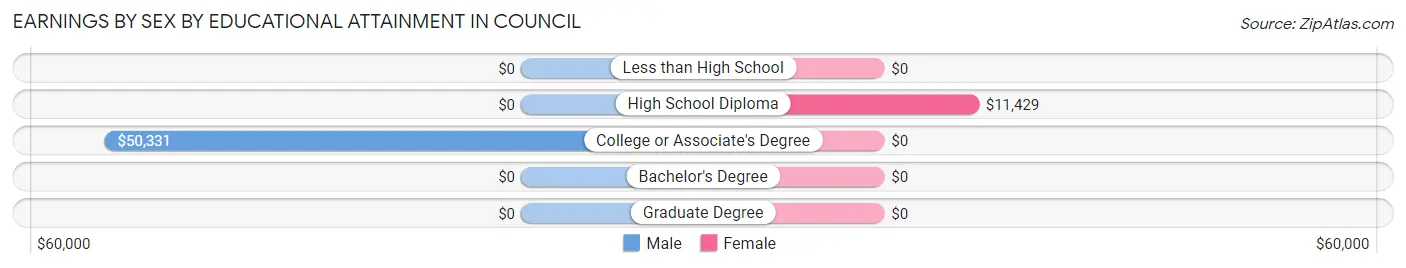
Earnings by Sex by Educational Attainment in Council
| Educational Attainment | Male Income | Female Income |
| Less than High School | - | - |
| High School Diploma | - | - |
| College or Associate's Degree | $50,331 | $0 |
| Bachelor's Degree | - | - |
| Graduate Degree | - | - |
| Total | $49,327 | $0 |
Family Income in Council
Family Income Brackets in Council
According to the Council family income data, there are 44 families falling into the $50,000 to $74,999 income range, which is the most common income bracket and makes up 29.7% of all families.
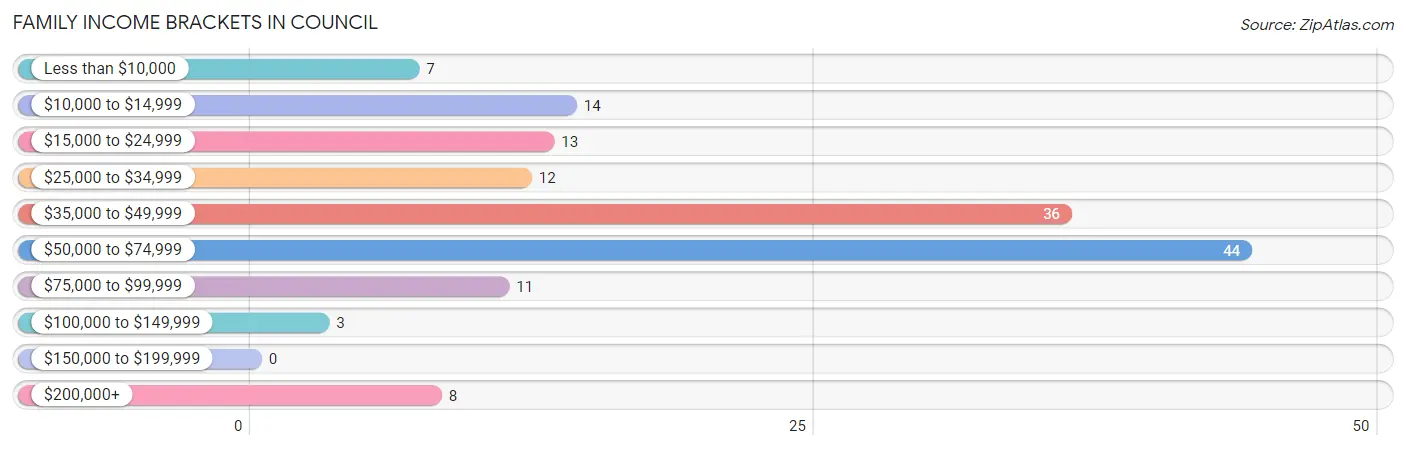
| Income Bracket | # Families | % Families |
| Less than $10,000 | 7 | 4.7% |
| $10,000 to $14,999 | 14 | 9.5% |
| $15,000 to $24,999 | 13 | 8.8% |
| $25,000 to $34,999 | 12 | 8.1% |
| $35,000 to $49,999 | 36 | 24.3% |
| $50,000 to $74,999 | 44 | 29.7% |
| $75,000 to $99,999 | 11 | 7.4% |
| $100,000 to $149,999 | 3 | 2.0% |
| $150,000 to $199,999 | 0 | 0.0% |
| $200,000+ | 8 | 5.4% |
Family Income by Famaliy Size in Council
4-person families (30 | 20.3%) account for the highest median family income in Council with $53,125 per family, while 2-person families (99 | 66.9%) have the highest median income of $20,070 per family member.
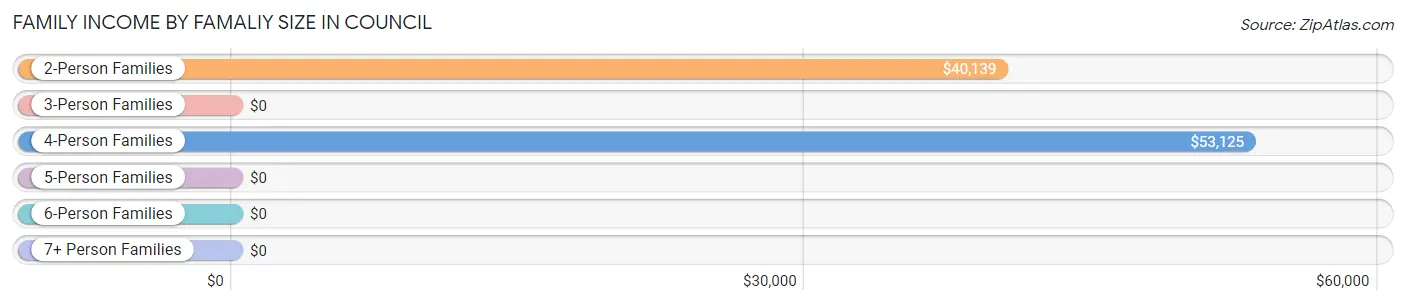
| Income Bracket | # Families | Median Income |
| 2-Person Families | 99 (66.9%) | $40,139 |
| 3-Person Families | 19 (12.8%) | $0 |
| 4-Person Families | 30 (20.3%) | $53,125 |
| 5-Person Families | 0 (0.0%) | $0 |
| 6-Person Families | 0 (0.0%) | $0 |
| 7+ Person Families | 0 (0.0%) | $0 |
| Total | 148 (100.0%) | $46,250 |
Family Income by Number of Earners in Council
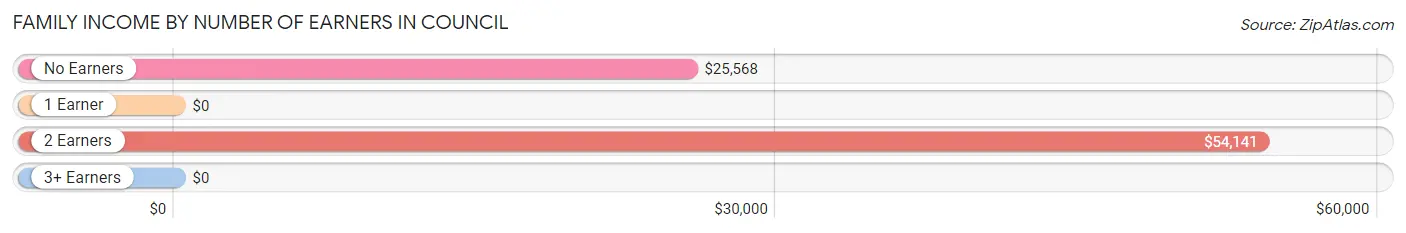
| Number of Earners | # Families | Median Income |
| No Earners | 73 (49.3%) | $25,568 |
| 1 Earner | 26 (17.6%) | $0 |
| 2 Earners | 49 (33.1%) | $54,141 |
| 3+ Earners | 0 (0.0%) | $0 |
| Total | 148 (100.0%) | $46,250 |
Household Income in Council
Household Income Brackets in Council
With 74 households falling in the category, the $50,000 to $74,999 income range is the most frequent in Council, accounting for 25.7% of all households.
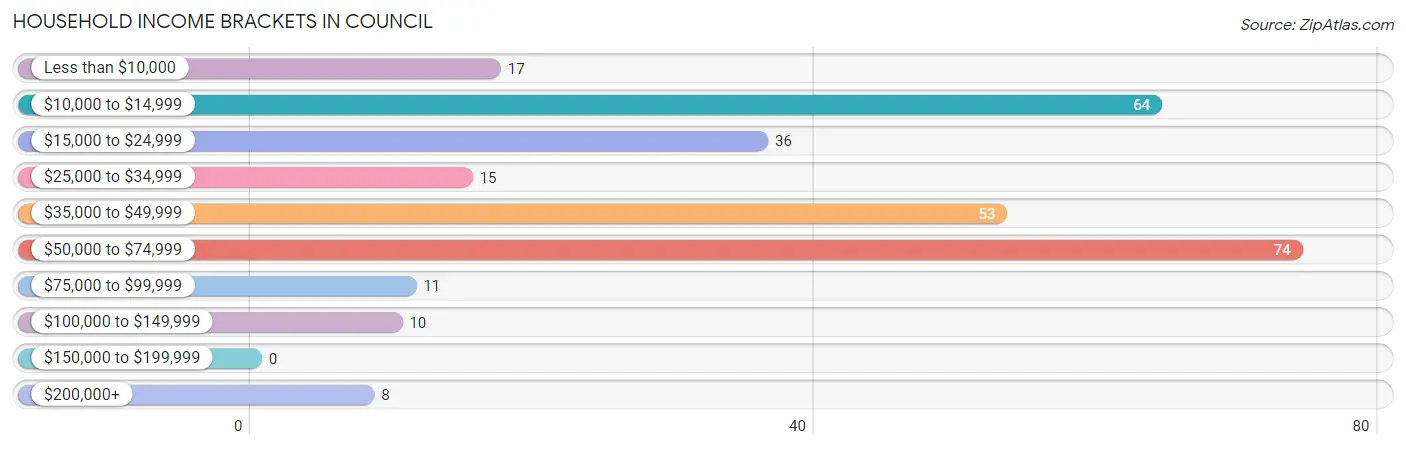
| Income Bracket | # Households | % Households |
| Less than $10,000 | 17 | 5.9% |
| $10,000 to $14,999 | 64 | 22.2% |
| $15,000 to $24,999 | 36 | 12.5% |
| $25,000 to $34,999 | 15 | 5.2% |
| $35,000 to $49,999 | 53 | 18.4% |
| $50,000 to $74,999 | 74 | 25.7% |
| $75,000 to $99,999 | 11 | 3.8% |
| $100,000 to $149,999 | 10 | 3.5% |
| $150,000 to $199,999 | 0 | 0.0% |
| $200,000+ | 8 | 2.8% |
Household Income by Householder Age in Council
The median household income in Council is $42,222, with the highest median household income of $62,500 found in the 25 to 44 years age bracket for the primary householder. A total of 32 households (11.1%) fall into this category. Meanwhile, the 15 to 24 years age bracket for the primary householder has the lowest median household income of $0, with 1 households (0.4%) in this group.
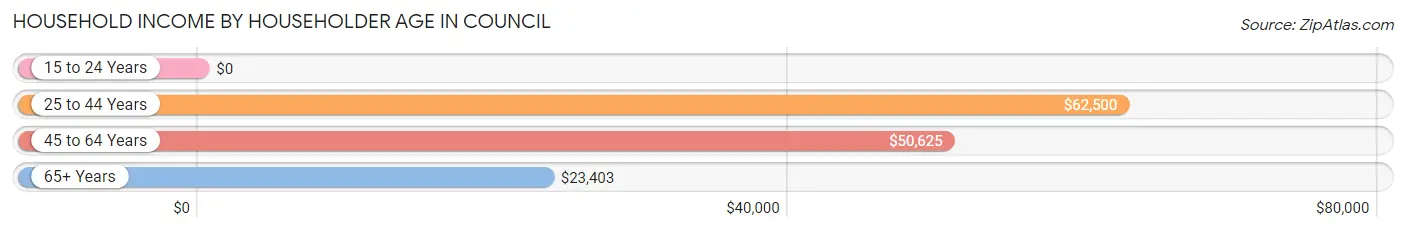
| Income Bracket | # Households | Median Income |
| 15 to 24 Years | 1 (0.4%) | $0 |
| 25 to 44 Years | 32 (11.1%) | $62,500 |
| 45 to 64 Years | 98 (34.0%) | $50,625 |
| 65+ Years | 157 (54.5%) | $23,403 |
| Total | 288 (100.0%) | $42,222 |
Poverty in Council
Income Below Poverty by Sex and Age in Council
With 15.5% poverty level for males and 22.7% for females among the residents of Council, 75 year old and over males and 75 year old and over females are the most vulnerable to poverty, with 16 males (42.1%) and 14 females (37.8%) in their respective age groups living below the poverty level.
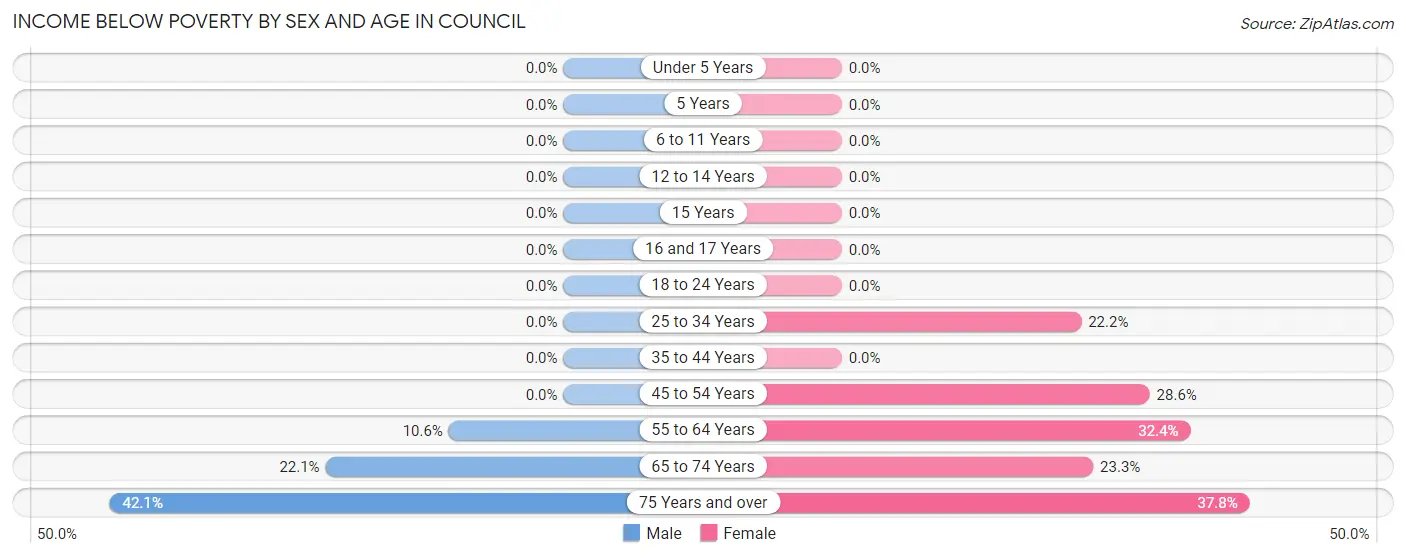
| Age Bracket | Male | Female |
| Under 5 Years | 0 (0.0%) | 0 (0.0%) |
| 5 Years | 0 (0.0%) | 0 (0.0%) |
| 6 to 11 Years | 0 (0.0%) | 0 (0.0%) |
| 12 to 14 Years | 0 (0.0%) | 0 (0.0%) |
| 15 Years | 0 (0.0%) | 0 (0.0%) |
| 16 and 17 Years | 0 (0.0%) | 0 (0.0%) |
| 18 to 24 Years | 0 (0.0%) | 0 (0.0%) |
| 25 to 34 Years | 0 (0.0%) | 12 (22.2%) |
| 35 to 44 Years | 0 (0.0%) | 0 (0.0%) |
| 45 to 54 Years | 0 (0.0%) | 16 (28.6%) |
| 55 to 64 Years | 10 (10.6%) | 22 (32.4%) |
| 65 to 74 Years | 17 (22.1%) | 14 (23.3%) |
| 75 Years and over | 16 (42.1%) | 14 (37.8%) |
| Total | 43 (15.5%) | 78 (22.7%) |
Income Above Poverty by Sex and Age in Council
According to the poverty statistics in Council, males aged under 5 years and females aged under 5 years are the age groups that are most secure financially, with 100.0% of males and 100.0% of females in these age groups living above the poverty line.
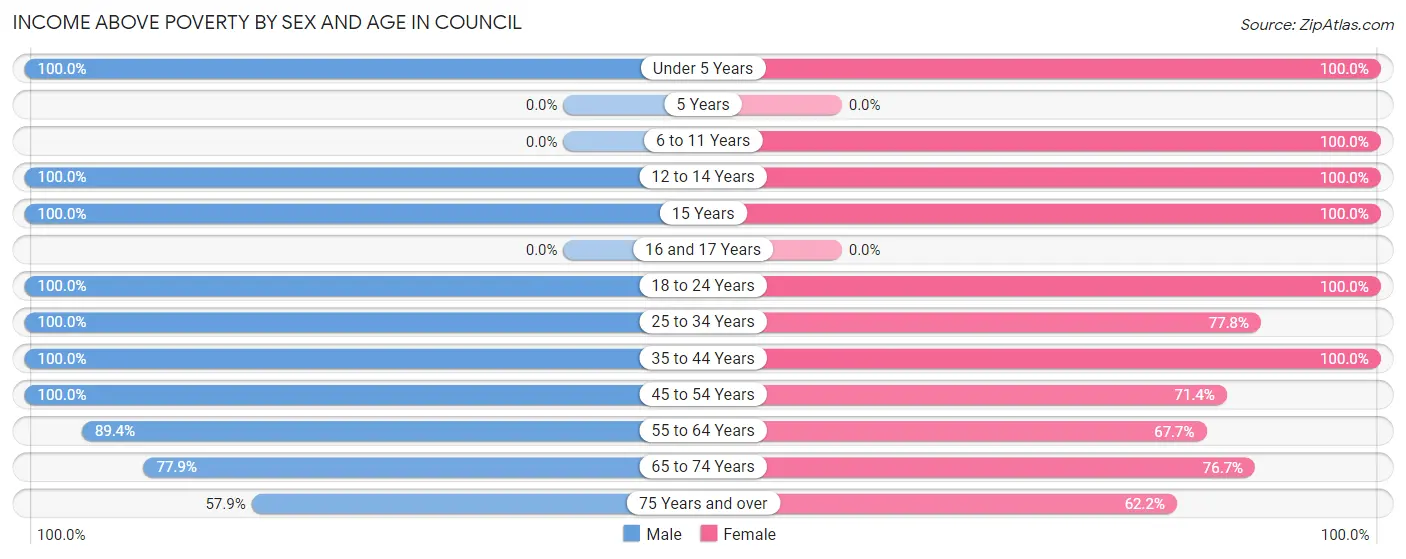
| Age Bracket | Male | Female |
| Under 5 Years | 15 (100.0%) | 10 (100.0%) |
| 5 Years | 0 (0.0%) | 0 (0.0%) |
| 6 to 11 Years | 0 (0.0%) | 13 (100.0%) |
| 12 to 14 Years | 6 (100.0%) | 18 (100.0%) |
| 15 Years | 6 (100.0%) | 14 (100.0%) |
| 16 and 17 Years | 0 (0.0%) | 0 (0.0%) |
| 18 to 24 Years | 1 (100.0%) | 12 (100.0%) |
| 25 to 34 Years | 13 (100.0%) | 42 (77.8%) |
| 35 to 44 Years | 19 (100.0%) | 2 (100.0%) |
| 45 to 54 Years | 9 (100.0%) | 40 (71.4%) |
| 55 to 64 Years | 84 (89.4%) | 46 (67.6%) |
| 65 to 74 Years | 60 (77.9%) | 46 (76.7%) |
| 75 Years and over | 22 (57.9%) | 23 (62.2%) |
| Total | 235 (84.5%) | 266 (77.3%) |
Income Below Poverty Among Married-Couple Families in Council
The poverty statistics for married-couple families in Council show that 17.2% or 21 of the total 122 families live below the poverty line. Families with no children have the highest poverty rate of 24.4%, comprising of 21 families. On the other hand, families with 1 or 2 children have the lowest poverty rate of 0.0%, which includes 0 families.
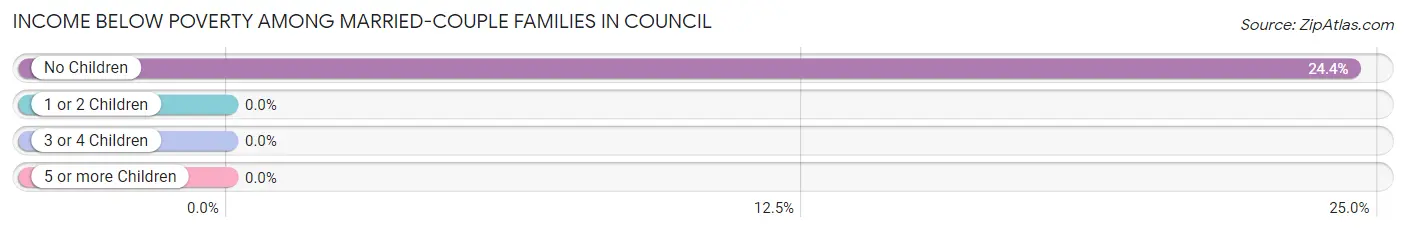
| Children | Above Poverty | Below Poverty |
| No Children | 65 (75.6%) | 21 (24.4%) |
| 1 or 2 Children | 36 (100.0%) | 0 (0.0%) |
| 3 or 4 Children | 0 (0.0%) | 0 (0.0%) |
| 5 or more Children | 0 (0.0%) | 0 (0.0%) |
| Total | 101 (82.8%) | 21 (17.2%) |
Income Below Poverty Among Single-Parent Households in Council
| Children | Single Father | Single Mother |
| No Children | 0 (0.0%) | 0 (0.0%) |
| 1 or 2 Children | 0 (0.0%) | 0 (0.0%) |
| 3 or 4 Children | 0 (0.0%) | 0 (0.0%) |
| 5 or more Children | 0 (0.0%) | 0 (0.0%) |
| Total | 0 (0.0%) | 0 (0.0%) |
Income Below Poverty Among Married-Couple vs Single-Parent Households in Council
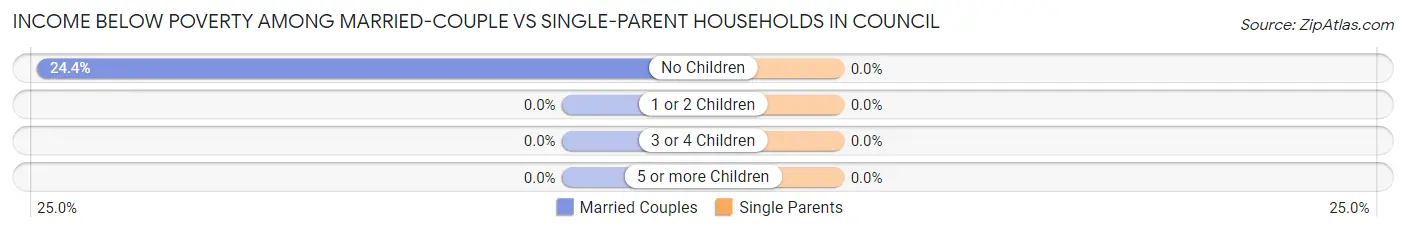
| Children | Married-Couple Families | Single-Parent Households |
| No Children | 21 (24.4%) | 0 (0.0%) |
| 1 or 2 Children | 0 (0.0%) | 0 (0.0%) |
| 3 or 4 Children | 0 (0.0%) | 0 (0.0%) |
| 5 or more Children | 0 (0.0%) | 0 (0.0%) |
| Total | 21 (17.2%) | 0 (0.0%) |
Race in Council
The most populous races in Council are White / Caucasian (611 | 93.3%), Hispanic or Latino (50 | 7.6%), and Two or more Races (36 | 5.5%).
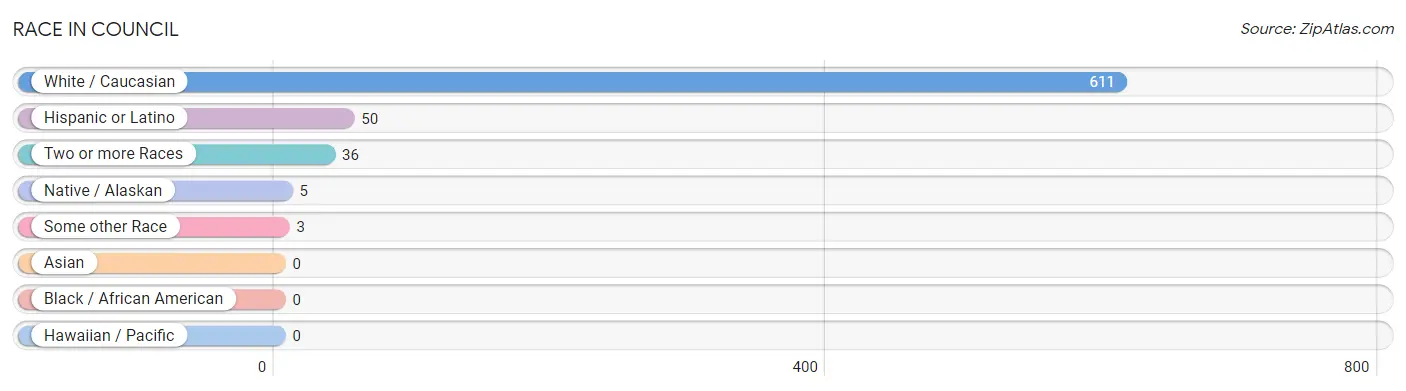
| Race | # Population | % Population |
| Asian | 0 | 0.0% |
| Black / African American | 0 | 0.0% |
| Hawaiian / Pacific | 0 | 0.0% |
| Hispanic or Latino | 50 | 7.6% |
| Native / Alaskan | 5 | 0.8% |
| White / Caucasian | 611 | 93.3% |
| Two or more Races | 36 | 5.5% |
| Some other Race | 3 | 0.5% |
| Total | 655 | 100.0% |
Ancestry in Council
The most populous ancestries reported in Council are English (159 | 24.3%), Irish (112 | 17.1%), German (88 | 13.4%), Mexican (33 | 5.0%), and Greek (32 | 4.9%), together accounting for 64.7% of all Council residents.
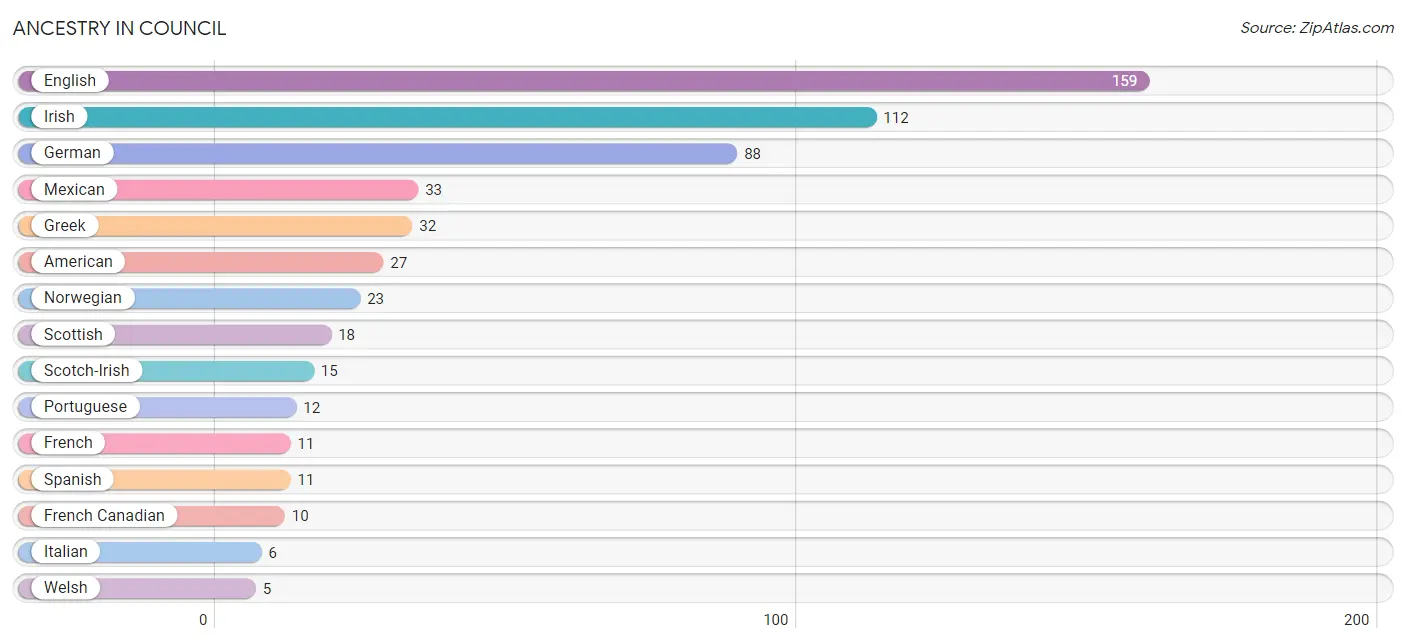
| Ancestry | # Population | % Population |
| American | 27 | 4.1% |
| English | 159 | 24.3% |
| European | 3 | 0.5% |
| French | 11 | 1.7% |
| French Canadian | 10 | 1.5% |
| German | 88 | 13.4% |
| Greek | 32 | 4.9% |
| Icelander | 4 | 0.6% |
| Irish | 112 | 17.1% |
| Italian | 6 | 0.9% |
| Mexican | 33 | 5.0% |
| Norwegian | 23 | 3.5% |
| Portuguese | 12 | 1.8% |
| Scotch-Irish | 15 | 2.3% |
| Scottish | 18 | 2.8% |
| Spanish | 11 | 1.7% |
| Welsh | 5 | 0.8% | View All 17 Rows |
Immigrants in Council
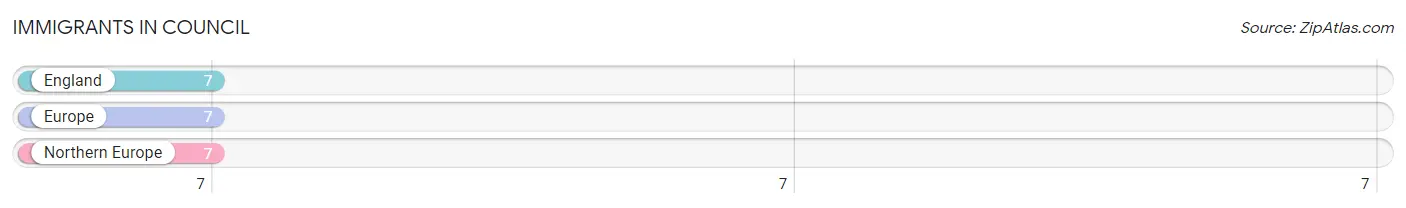
The most numerous immigrant groups reported in Council came from England (7 | 1.1%), Europe (7 | 1.1%), and Northern Europe (7 | 1.1%), together accounting for 3.2% of all Council residents.
| Immigration Origin | # Population | % Population |
| England | 7 | 1.1% |
| Europe | 7 | 1.1% |
| Northern Europe | 7 | 1.1% | View All 3 Rows |
Sex and Age in Council
Sex and Age in Council
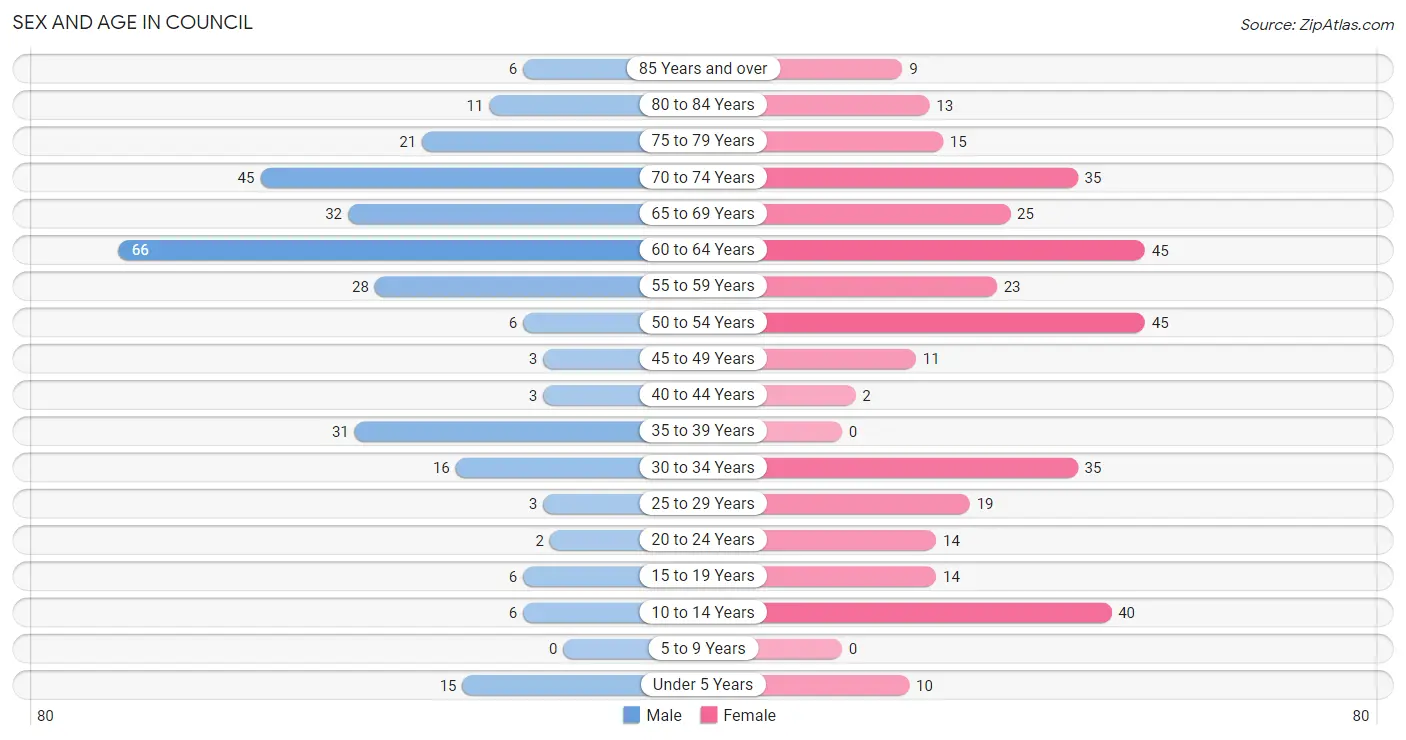
The most populous age groups in Council are 60 to 64 Years (66 | 22.0%) for men and 50 to 54 Years (45 | 12.7%) for women.
| Age Bracket | Male | Female |
| Under 5 Years | 15 (5.0%) | 10 (2.8%) |
| 5 to 9 Years | 0 (0.0%) | 0 (0.0%) |
| 10 to 14 Years | 6 (2.0%) | 40 (11.3%) |
| 15 to 19 Years | 6 (2.0%) | 14 (3.9%) |
| 20 to 24 Years | 2 (0.7%) | 14 (3.9%) |
| 25 to 29 Years | 3 (1.0%) | 19 (5.3%) |
| 30 to 34 Years | 16 (5.3%) | 35 (9.9%) |
| 35 to 39 Years | 31 (10.3%) | 0 (0.0%) |
| 40 to 44 Years | 3 (1.0%) | 2 (0.6%) |
| 45 to 49 Years | 3 (1.0%) | 11 (3.1%) |
| 50 to 54 Years | 6 (2.0%) | 45 (12.7%) |
| 55 to 59 Years | 28 (9.3%) | 23 (6.5%) |
| 60 to 64 Years | 66 (22.0%) | 45 (12.7%) |
| 65 to 69 Years | 32 (10.7%) | 25 (7.0%) |
| 70 to 74 Years | 45 (15.0%) | 35 (9.9%) |
| 75 to 79 Years | 21 (7.0%) | 15 (4.2%) |
| 80 to 84 Years | 11 (3.7%) | 13 (3.7%) |
| 85 Years and over | 6 (2.0%) | 9 (2.5%) |
| Total | 300 (100.0%) | 355 (100.0%) |
Families and Households in Council
Median Family Size in Council
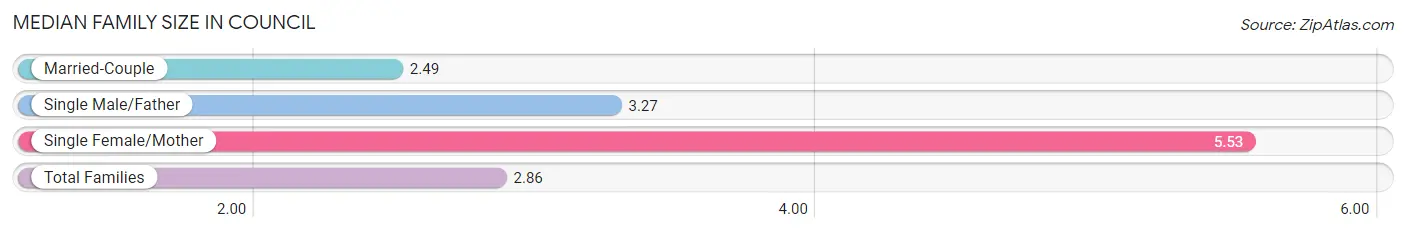
The median family size in Council is 2.86 persons per family, with single female/mother families (15 | 10.1%) accounting for the largest median family size of 5.53 persons per family. On the other hand, married-couple families (122 | 82.4%) represent the smallest median family size with 2.49 persons per family.
| Family Type | # Families | Family Size |
| Married-Couple | 122 (82.4%) | 2.49 |
| Single Male/Father | 11 (7.4%) | 3.27 |
| Single Female/Mother | 15 (10.1%) | 5.53 |
| Total Families | 148 (100.0%) | 2.86 |
Median Household Size in Council
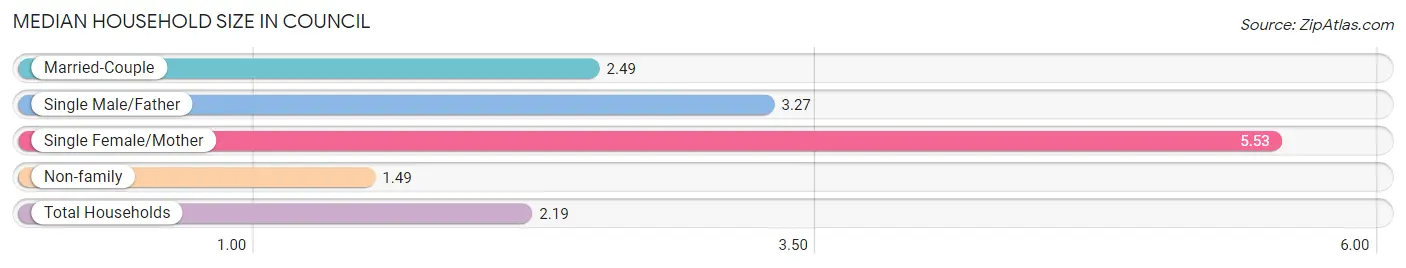
The median household size in Council is 2.19 persons per household, with single female/mother households (15 | 5.2%) accounting for the largest median household size of 5.53 persons per household. non-family households (140 | 48.6%) represent the smallest median household size with 1.49 persons per household.
| Household Type | # Households | Household Size |
| Married-Couple | 122 (42.4%) | 2.49 |
| Single Male/Father | 11 (3.8%) | 3.27 |
| Single Female/Mother | 15 (5.2%) | 5.53 |
| Non-family | 140 (48.6%) | 1.49 |
| Total Households | 288 (100.0%) | 2.19 |
Household Size by Marriage Status in Council
Out of a total of 288 households in Council, 148 (51.4%) are family households, while 140 (48.6%) are nonfamily households. The most numerous type of family households are 2-person households, comprising 99, and the most common type of nonfamily households are 1-person households, comprising 114.
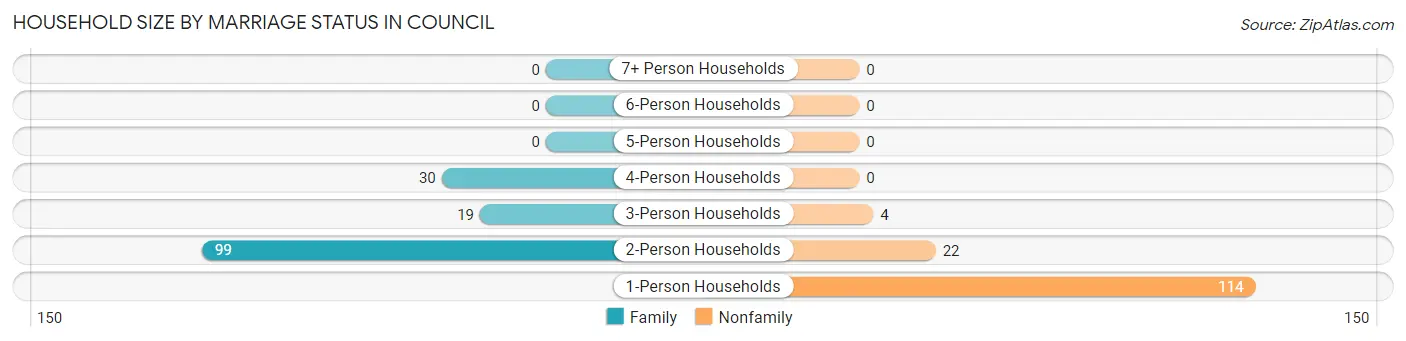
| Household Size | Family Households | Nonfamily Households |
| 1-Person Households | - | 114 (39.6%) |
| 2-Person Households | 99 (34.4%) | 22 (7.6%) |
| 3-Person Households | 19 (6.6%) | 4 (1.4%) |
| 4-Person Households | 30 (10.4%) | 0 (0.0%) |
| 5-Person Households | 0 (0.0%) | 0 (0.0%) |
| 6-Person Households | 0 (0.0%) | 0 (0.0%) |
| 7+ Person Households | 0 (0.0%) | 0 (0.0%) |
| Total | 148 (51.4%) | 140 (48.6%) |
Female Fertility in Council
Fertility by Age in Council
Average fertility rate in Council is 21.0 births per 1,000 women. Women in the age bracket of 20 to 34 years have the highest fertility rate with 29.0 births per 1,000 women. Women in the age bracket of 20 to 34 years acount for 100.0% of all women with births.
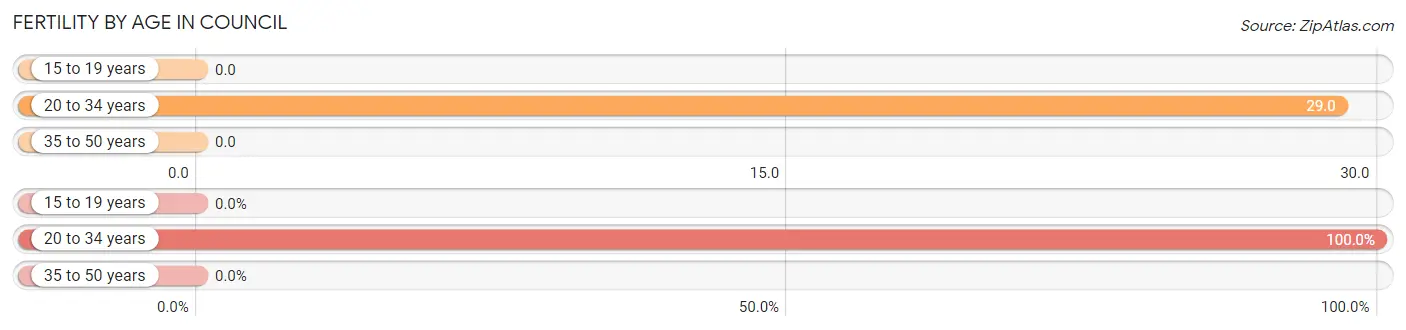
| Age Bracket | Women with Births | Births / 1,000 Women |
| 15 to 19 years | 0 (0.0%) | 0.0 |
| 20 to 34 years | 2 (100.0%) | 29.0 |
| 35 to 50 years | 0 (0.0%) | 0.0 |
| Total | 2 (100.0%) | 21.0 |
Fertility by Age by Marriage Status in Council
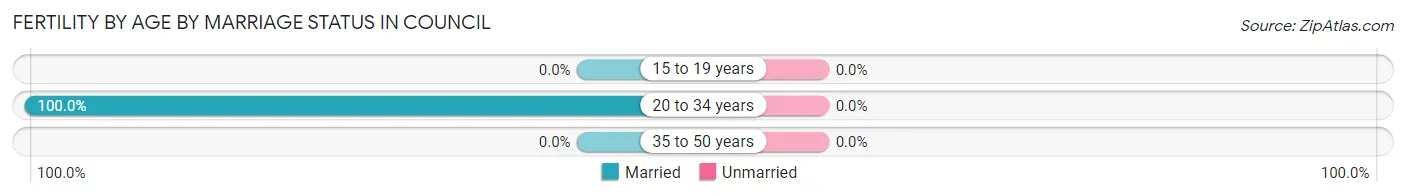
| Age Bracket | Married | Unmarried |
| 15 to 19 years | 0 (0.0%) | 0 (0.0%) |
| 20 to 34 years | 2 (100.0%) | 0 (0.0%) |
| 35 to 50 years | 0 (0.0%) | 0 (0.0%) |
| Total | 2 (100.0%) | 0 (0.0%) |
Fertility by Education in Council
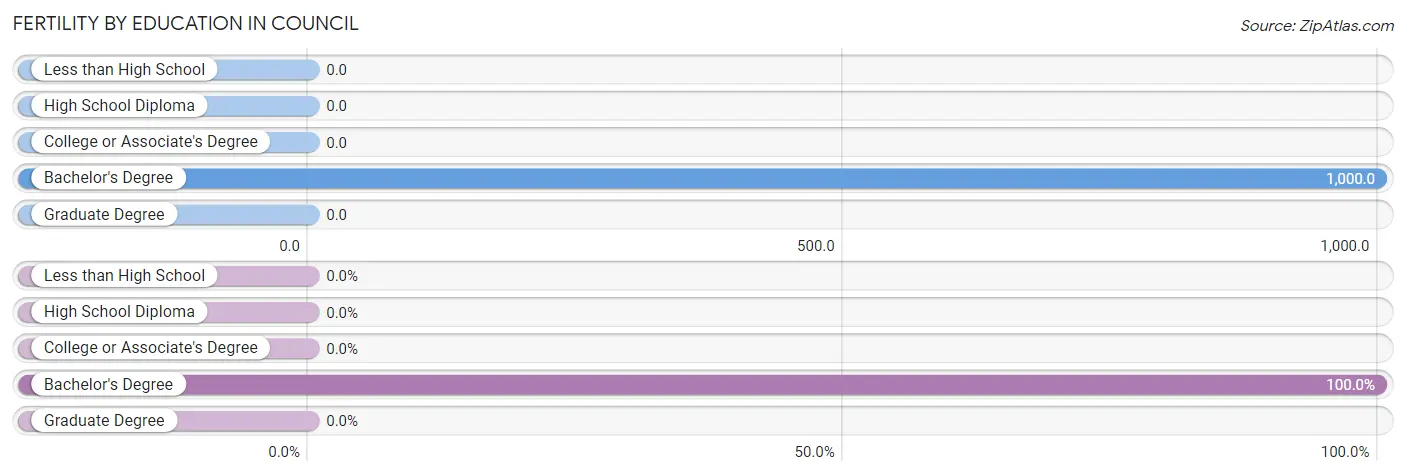
| Educational Attainment | Women with Births | Births / 1,000 Women |
| Less than High School | 0 (0.0%) | 0.0 |
| High School Diploma | 0 (0.0%) | 0.0 |
| College or Associate's Degree | 0 (0.0%) | 0.0 |
| Bachelor's Degree | 2 (100.0%) | 1,000.0 |
| Graduate Degree | 0 (0.0%) | 0.0 |
| Total | 2 (100.0%) | 21.0 |
Fertility by Education by Marriage Status in Council
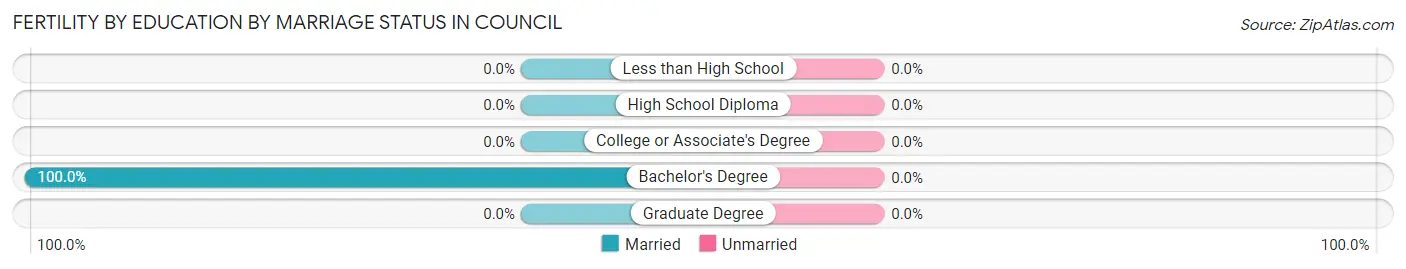
| Educational Attainment | Married | Unmarried |
| Less than High School | 0 (0.0%) | 0 (0.0%) |
| High School Diploma | 0 (0.0%) | 0 (0.0%) |
| College or Associate's Degree | 0 (0.0%) | 0 (0.0%) |
| Bachelor's Degree | 2 (100.0%) | 0 (0.0%) |
| Graduate Degree | 0 (0.0%) | 0 (0.0%) |
| Total | 2 (100.0%) | 0 (0.0%) |
Employment Characteristics in Council
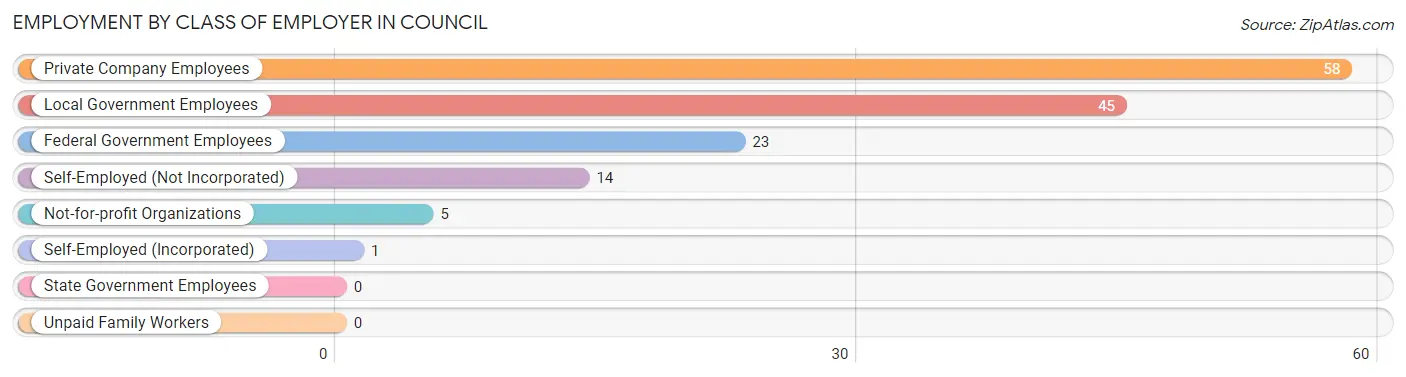
Employment by Class of Employer in Council
Among the 146 employed individuals in Council, private company employees (58 | 39.7%), local government employees (45 | 30.8%), and federal government employees (23 | 15.8%) make up the most common classes of employment.
| Employer Class | # Employees | % Employees |
| Private Company Employees | 58 | 39.7% |
| Self-Employed (Incorporated) | 1 | 0.7% |
| Self-Employed (Not Incorporated) | 14 | 9.6% |
| Not-for-profit Organizations | 5 | 3.4% |
| Local Government Employees | 45 | 30.8% |
| State Government Employees | 0 | 0.0% |
| Federal Government Employees | 23 | 15.8% |
| Unpaid Family Workers | 0 | 0.0% |
| Total | 146 | 100.0% |
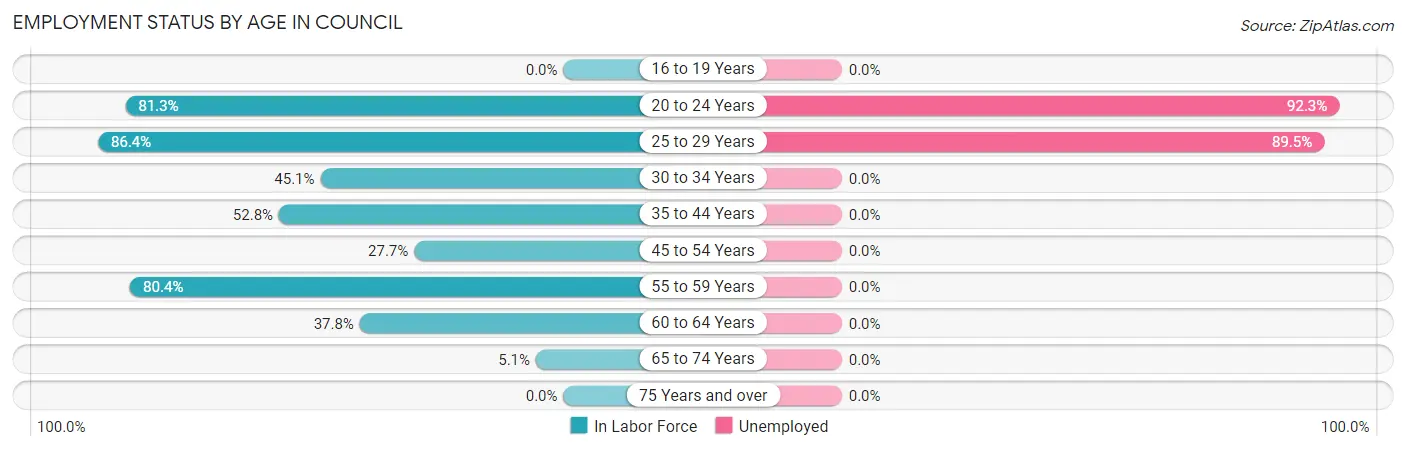
Employment Status by Age in Council
According to the labor force statistics for Council, out of the total population over 16 years of age (564), 32.3% or 182 individuals are in the labor force, with 15.9% or 29 of them unemployed. The age group with the highest labor force participation rate is 25 to 29 years, with 86.4% or 19 individuals in the labor force. Within the labor force, the 20 to 24 years age range has the highest percentage of unemployed individuals, with 92.3% or 12 of them being unemployed.
| Age Bracket | In Labor Force | Unemployed |
| 16 to 19 Years | 0 (0.0%) | 0 (0.0%) |
| 20 to 24 Years | 13 (81.3%) | 12 (92.3%) |
| 25 to 29 Years | 19 (86.4%) | 17 (89.5%) |
| 30 to 34 Years | 23 (45.1%) | 0 (0.0%) |
| 35 to 44 Years | 19 (52.8%) | 0 (0.0%) |
| 45 to 54 Years | 18 (27.7%) | 0 (0.0%) |
| 55 to 59 Years | 41 (80.4%) | 0 (0.0%) |
| 60 to 64 Years | 42 (37.8%) | 0 (0.0%) |
| 65 to 74 Years | 7 (5.1%) | 0 (0.0%) |
| 75 Years and over | 0 (0.0%) | 0 (0.0%) |
| Total | 182 (32.3%) | 29 (15.9%) |
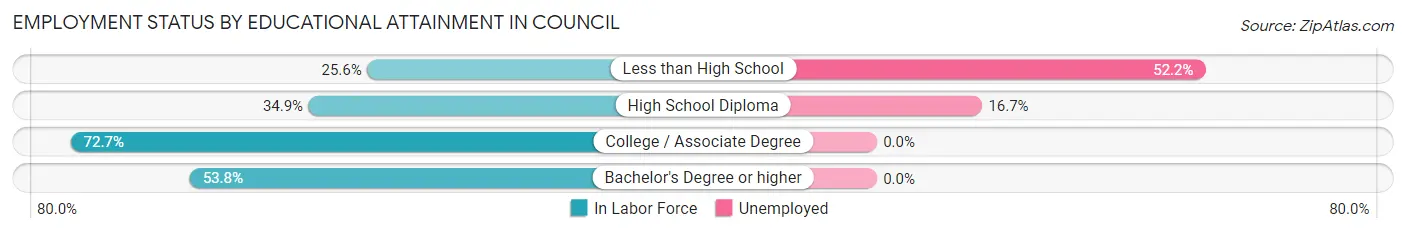
Employment Status by Educational Attainment in Council
According to labor force statistics for Council, 48.2% of individuals (162) out of the total population between 25 and 64 years of age (336) are in the labor force, with 10.5% or 17 of them being unemployed. The group with the highest labor force participation rate are those with the educational attainment of college / associate degree, with 72.7% or 88 individuals in the labor force. Within the labor force, individuals with less than high school education have the highest percentage of unemployment, with 52.2% or 12 of them being unemployed.
| Educational Attainment | In Labor Force | Unemployed |
| Less than High School | 23 (25.6%) | 47 (52.2%) |
| High School Diploma | 30 (34.9%) | 14 (16.7%) |
| College / Associate Degree | 88 (72.7%) | 0 (0.0%) |
| Bachelor's Degree or higher | 21 (53.8%) | 0 (0.0%) |
| Total | 162 (48.2%) | 35 (10.5%) |
Employment Occupations by Sex in Council
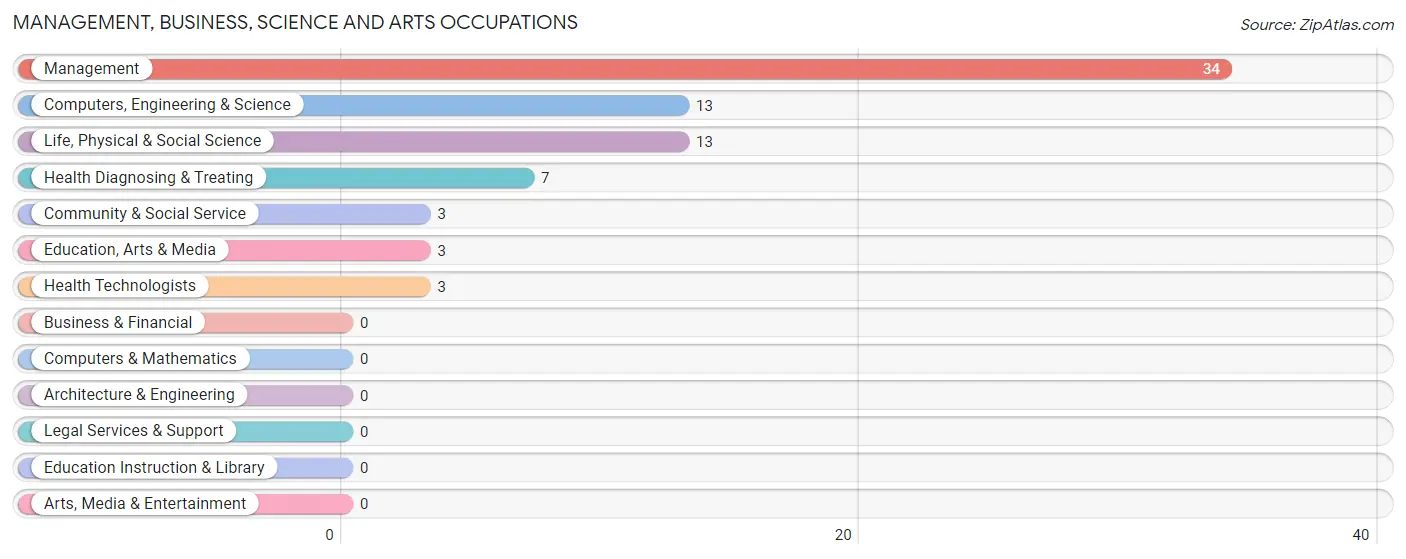
Management, Business, Science and Arts Occupations
The most common Management, Business, Science and Arts occupations in Council are Management (34 | 22.2%), Computers, Engineering & Science (13 | 8.5%), Life, Physical & Social Science (13 | 8.5%), Health Diagnosing & Treating (7 | 4.6%), and Community & Social Service (3 | 2.0%).
Management, Business, Science and Arts Occupations by Sex
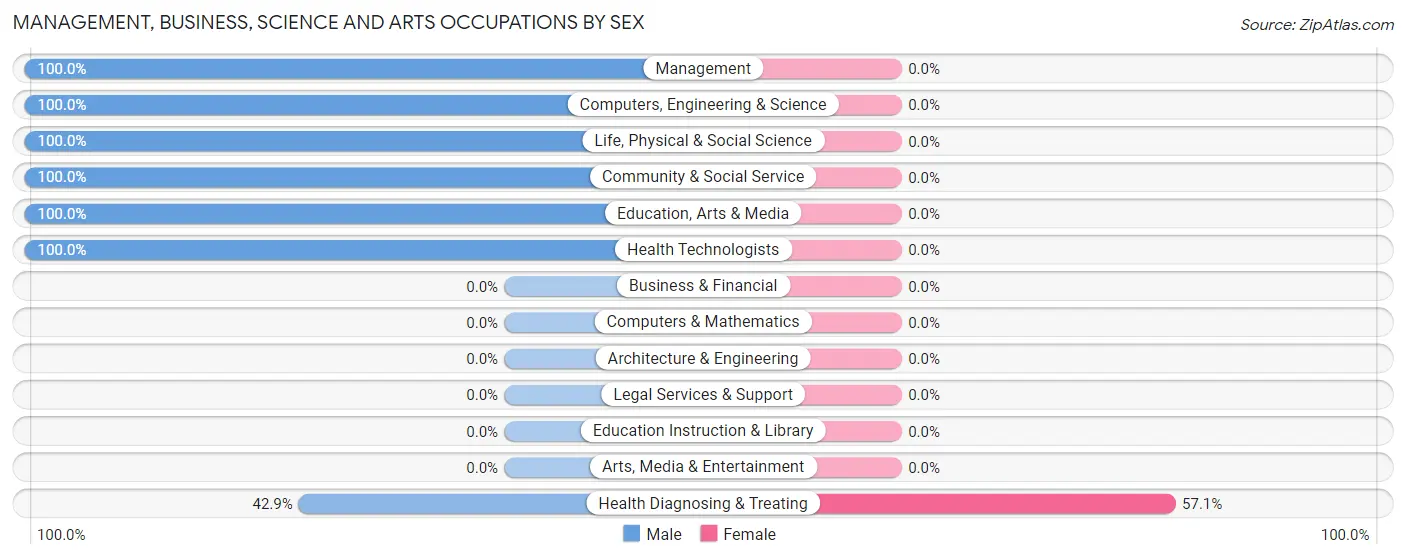
| Occupation | Male | Female |
| Management | 34 (100.0%) | 0 (0.0%) |
| Business & Financial | 0 (0.0%) | 0 (0.0%) |
| Computers, Engineering & Science | 13 (100.0%) | 0 (0.0%) |
| Computers & Mathematics | 0 (0.0%) | 0 (0.0%) |
| Architecture & Engineering | 0 (0.0%) | 0 (0.0%) |
| Life, Physical & Social Science | 13 (100.0%) | 0 (0.0%) |
| Community & Social Service | 3 (100.0%) | 0 (0.0%) |
| Education, Arts & Media | 3 (100.0%) | 0 (0.0%) |
| Legal Services & Support | 0 (0.0%) | 0 (0.0%) |
| Education Instruction & Library | 0 (0.0%) | 0 (0.0%) |
| Arts, Media & Entertainment | 0 (0.0%) | 0 (0.0%) |
| Health Diagnosing & Treating | 3 (42.9%) | 4 (57.1%) |
| Health Technologists | 3 (100.0%) | 0 (0.0%) |
| Total (Category) | 53 (93.0%) | 4 (7.0%) |
| Total (Overall) | 98 (64.0%) | 55 (35.9%) |
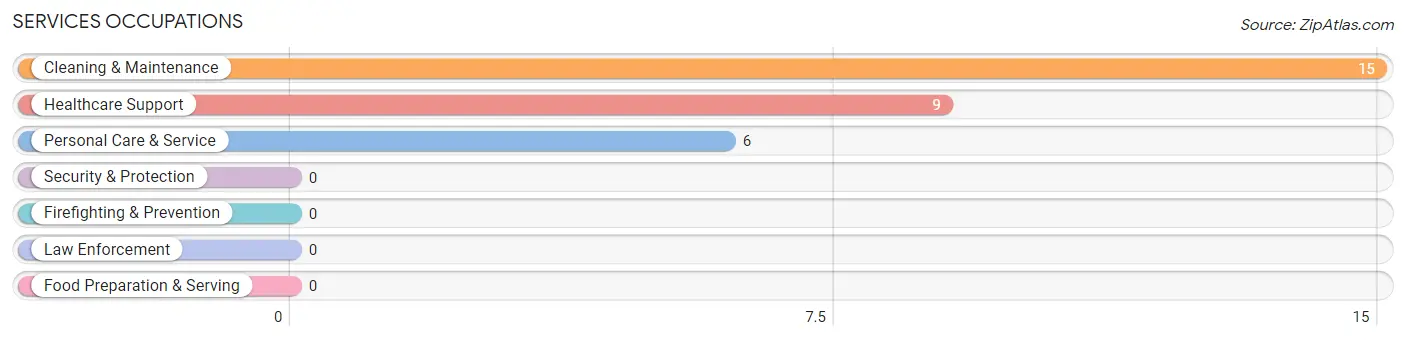
Services Occupations
The most common Services occupations in Council are Cleaning & Maintenance (15 | 9.8%), Healthcare Support (9 | 5.9%), and Personal Care & Service (6 | 3.9%).
Services Occupations by Sex
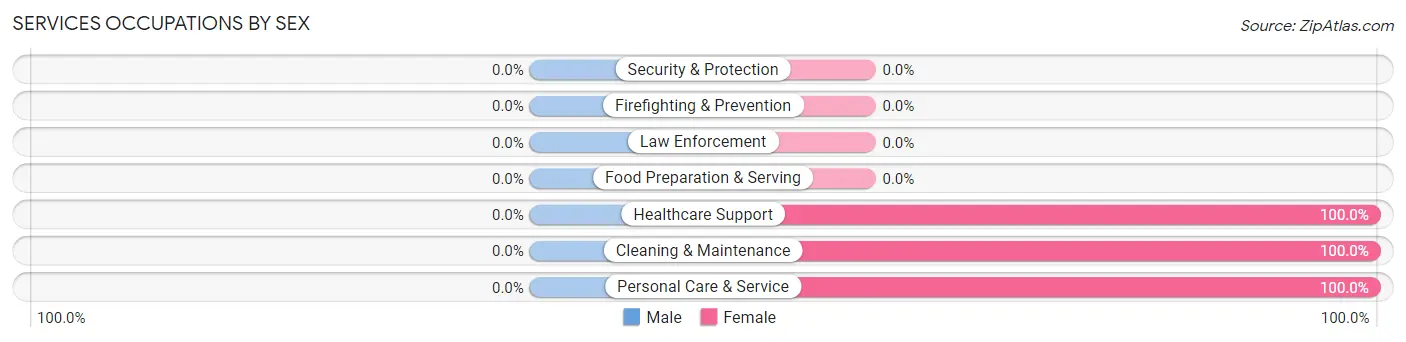
| Occupation | Male | Female |
| Healthcare Support | 0 (0.0%) | 9 (100.0%) |
| Security & Protection | 0 (0.0%) | 0 (0.0%) |
| Firefighting & Prevention | 0 (0.0%) | 0 (0.0%) |
| Law Enforcement | 0 (0.0%) | 0 (0.0%) |
| Food Preparation & Serving | 0 (0.0%) | 0 (0.0%) |
| Cleaning & Maintenance | 0 (0.0%) | 15 (100.0%) |
| Personal Care & Service | 0 (0.0%) | 6 (100.0%) |
| Total (Category) | 0 (0.0%) | 30 (100.0%) |
| Total (Overall) | 98 (64.0%) | 55 (35.9%) |
Sales and Office Occupations
The most common Sales and Office occupations in Council are Office & Administration (10 | 6.5%), and Sales & Related (9 | 5.9%).
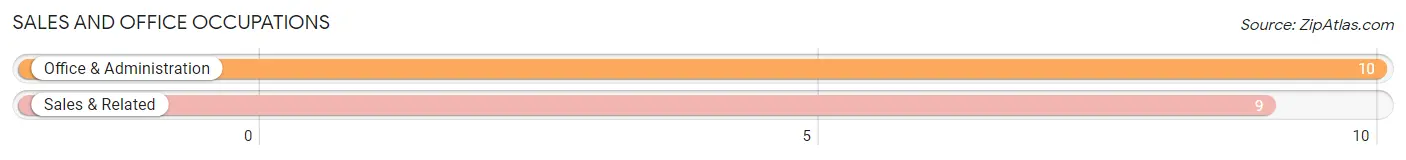
Sales and Office Occupations by Sex
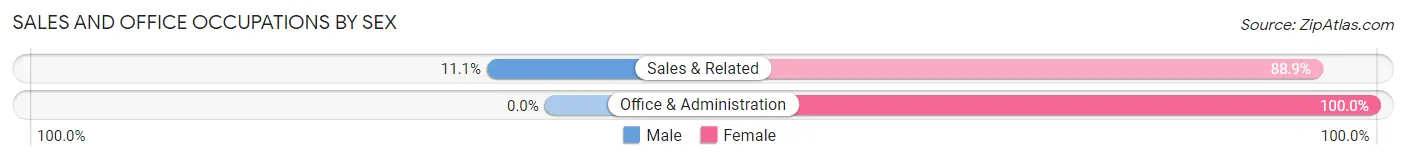
| Occupation | Male | Female |
| Sales & Related | 1 (11.1%) | 8 (88.9%) |
| Office & Administration | 0 (0.0%) | 10 (100.0%) |
| Total (Category) | 1 (5.3%) | 18 (94.7%) |
| Total (Overall) | 98 (64.0%) | 55 (35.9%) |
Natural Resources, Construction and Maintenance Occupations
The most common Natural Resources, Construction and Maintenance occupations in Council are Installation, Maintenance & Repair (23 | 15.0%), and Farming, Fishing & Forestry (3 | 2.0%).
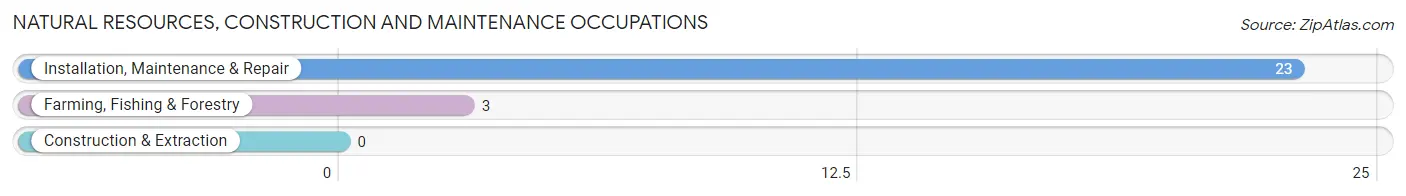
Natural Resources, Construction and Maintenance Occupations by Sex
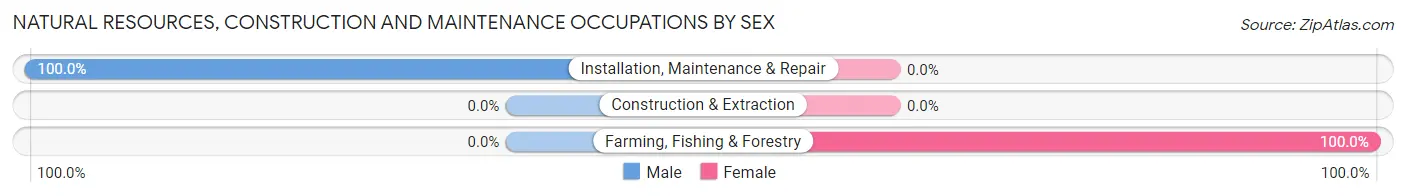
| Occupation | Male | Female |
| Farming, Fishing & Forestry | 0 (0.0%) | 3 (100.0%) |
| Construction & Extraction | 0 (0.0%) | 0 (0.0%) |
| Installation, Maintenance & Repair | 23 (100.0%) | 0 (0.0%) |
| Total (Category) | 23 (88.5%) | 3 (11.5%) |
| Total (Overall) | 98 (64.0%) | 55 (35.9%) |
Production, Transportation and Moving Occupations
The most common Production, Transportation and Moving occupations in Council are Material Moving (12 | 7.8%), Production (5 | 3.3%), and Transportation (4 | 2.6%).
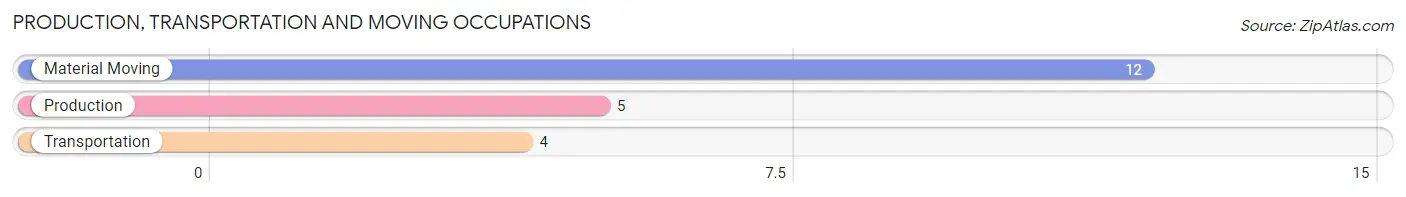
Production, Transportation and Moving Occupations by Sex
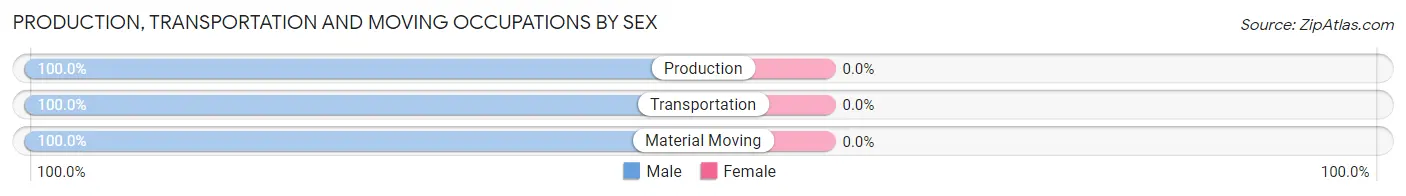
| Occupation | Male | Female |
| Production | 5 (100.0%) | 0 (0.0%) |
| Transportation | 4 (100.0%) | 0 (0.0%) |
| Material Moving | 12 (100.0%) | 0 (0.0%) |
| Total (Category) | 21 (100.0%) | 0 (0.0%) |
| Total (Overall) | 98 (64.0%) | 55 (35.9%) |
Employment Industries by Sex in Council
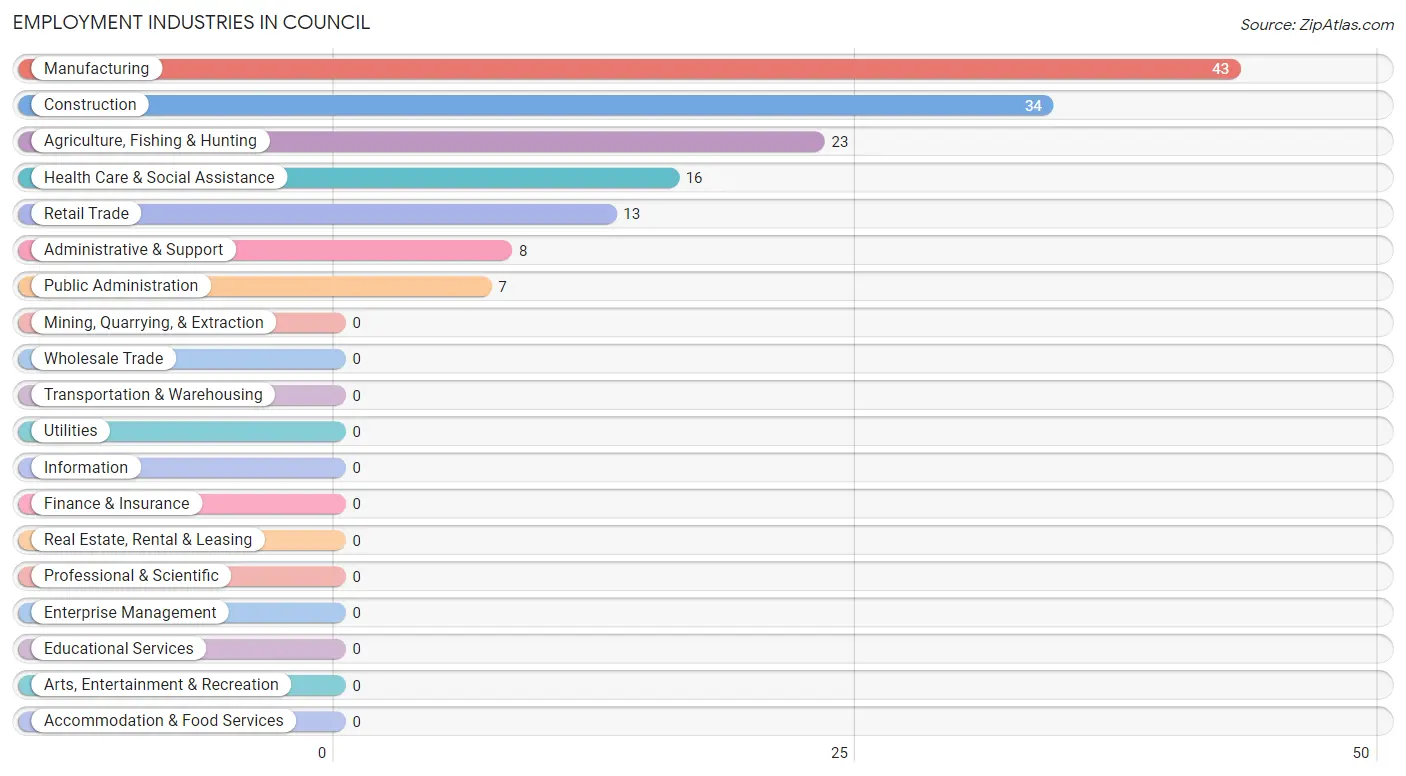
Employment Industries in Council
The major employment industries in Council include Manufacturing (43 | 28.1%), Construction (34 | 22.2%), Agriculture, Fishing & Hunting (23 | 15.0%), Health Care & Social Assistance (16 | 10.5%), and Retail Trade (13 | 8.5%).
Employment Industries by Sex in Council
The Council industries that see more men than women are Construction (100.0%), Manufacturing (93.0%), and Agriculture, Fishing & Hunting (56.5%), whereas the industries that tend to have a higher number of women are Administrative & Support (100.0%), Public Administration (100.0%), and Health Care & Social Assistance (81.2%).
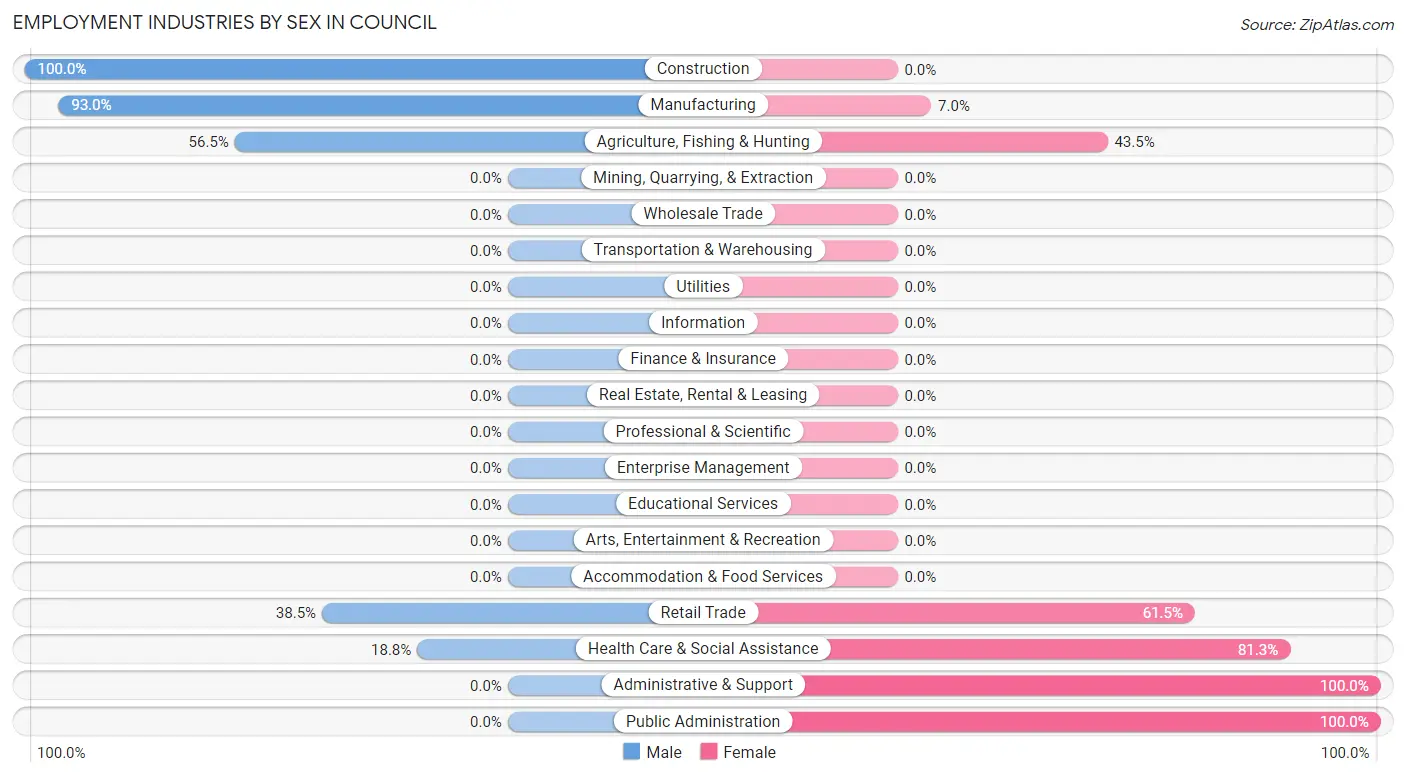
| Industry | Male | Female |
| Agriculture, Fishing & Hunting | 13 (56.5%) | 10 (43.5%) |
| Mining, Quarrying, & Extraction | 0 (0.0%) | 0 (0.0%) |
| Construction | 34 (100.0%) | 0 (0.0%) |
| Manufacturing | 40 (93.0%) | 3 (7.0%) |
| Wholesale Trade | 0 (0.0%) | 0 (0.0%) |
| Retail Trade | 5 (38.5%) | 8 (61.5%) |
| Transportation & Warehousing | 0 (0.0%) | 0 (0.0%) |
| Utilities | 0 (0.0%) | 0 (0.0%) |
| Information | 0 (0.0%) | 0 (0.0%) |
| Finance & Insurance | 0 (0.0%) | 0 (0.0%) |
| Real Estate, Rental & Leasing | 0 (0.0%) | 0 (0.0%) |
| Professional & Scientific | 0 (0.0%) | 0 (0.0%) |
| Enterprise Management | 0 (0.0%) | 0 (0.0%) |
| Administrative & Support | 0 (0.0%) | 8 (100.0%) |
| Educational Services | 0 (0.0%) | 0 (0.0%) |
| Health Care & Social Assistance | 3 (18.8%) | 13 (81.2%) |
| Arts, Entertainment & Recreation | 0 (0.0%) | 0 (0.0%) |
| Accommodation & Food Services | 0 (0.0%) | 0 (0.0%) |
| Public Administration | 0 (0.0%) | 7 (100.0%) |
| Total | 98 (64.0%) | 55 (35.9%) |
Education in Council
School Enrollment in Council
The most common levels of schooling among the 74 students in Council are middle school (33 | 44.6%), high school (20 | 27.0%), and elementary school (13 | 17.6%).
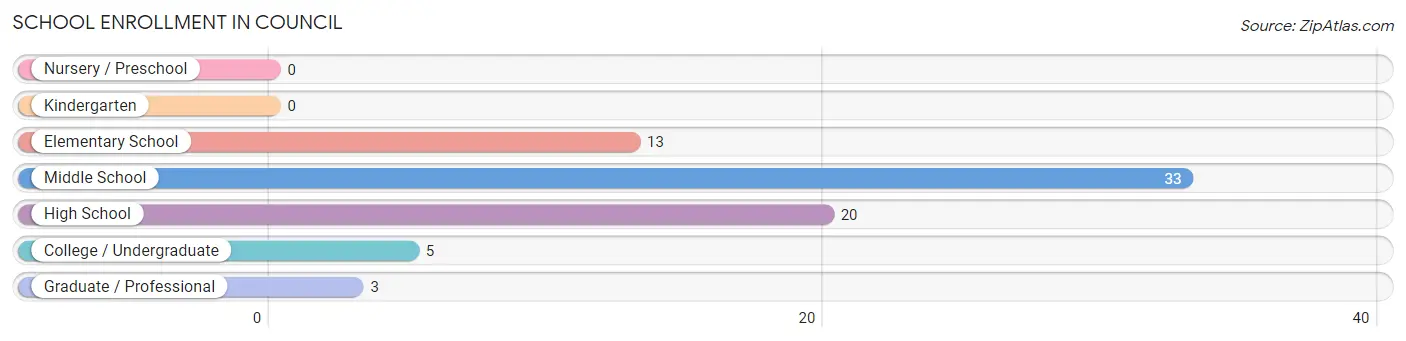
| School Level | # Students | % Students |
| Nursery / Preschool | 0 | 0.0% |
| Kindergarten | 0 | 0.0% |
| Elementary School | 13 | 17.6% |
| Middle School | 33 | 44.6% |
| High School | 20 | 27.0% |
| College / Undergraduate | 5 | 6.8% |
| Graduate / Professional | 3 | 4.1% |
| Total | 74 | 100.0% |
School Enrollment by Age by Funding Source in Council
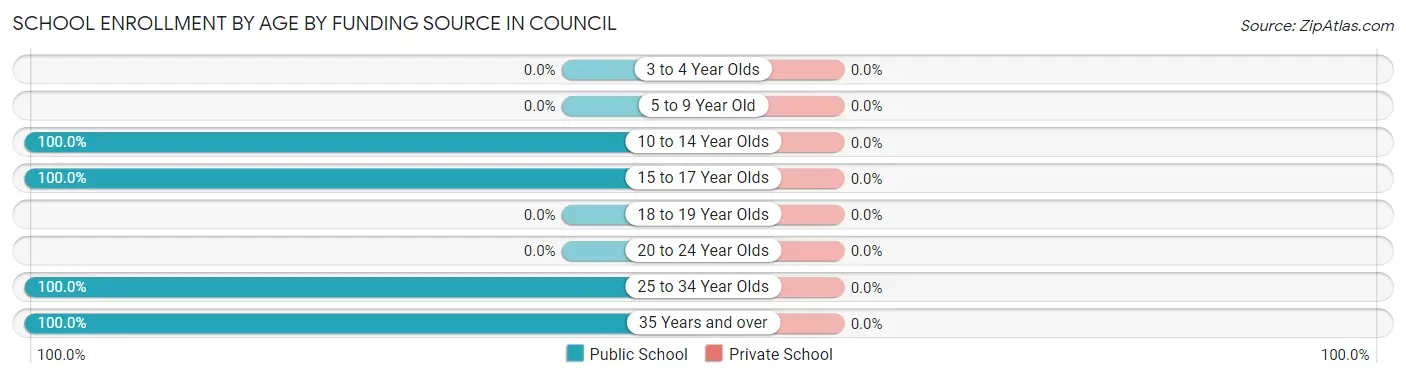
| Age Bracket | Public School | Private School |
| 3 to 4 Year Olds | 0 (0.0%) | 0 (0.0%) |
| 5 to 9 Year Old | 0 (0.0%) | 0 (0.0%) |
| 10 to 14 Year Olds | 46 (100.0%) | 0 (0.0%) |
| 15 to 17 Year Olds | 20 (100.0%) | 0 (0.0%) |
| 18 to 19 Year Olds | 0 (0.0%) | 0 (0.0%) |
| 20 to 24 Year Olds | 0 (0.0%) | 0 (0.0%) |
| 25 to 34 Year Olds | 5 (100.0%) | 0 (0.0%) |
| 35 Years and over | 3 (100.0%) | 0 (0.0%) |
| Total | 74 (100.0%) | 0 (0.0%) |
Educational Attainment by Field of Study in Council
Bio, nature & agricultural (24 | 29.3%), social sciences (11 | 13.4%), education (11 | 13.4%), science & technology (10 | 12.2%), and computers & mathematics (9 | 11.0%) are the most common fields of study among 82 individuals in Council who have obtained a bachelor's degree or higher.
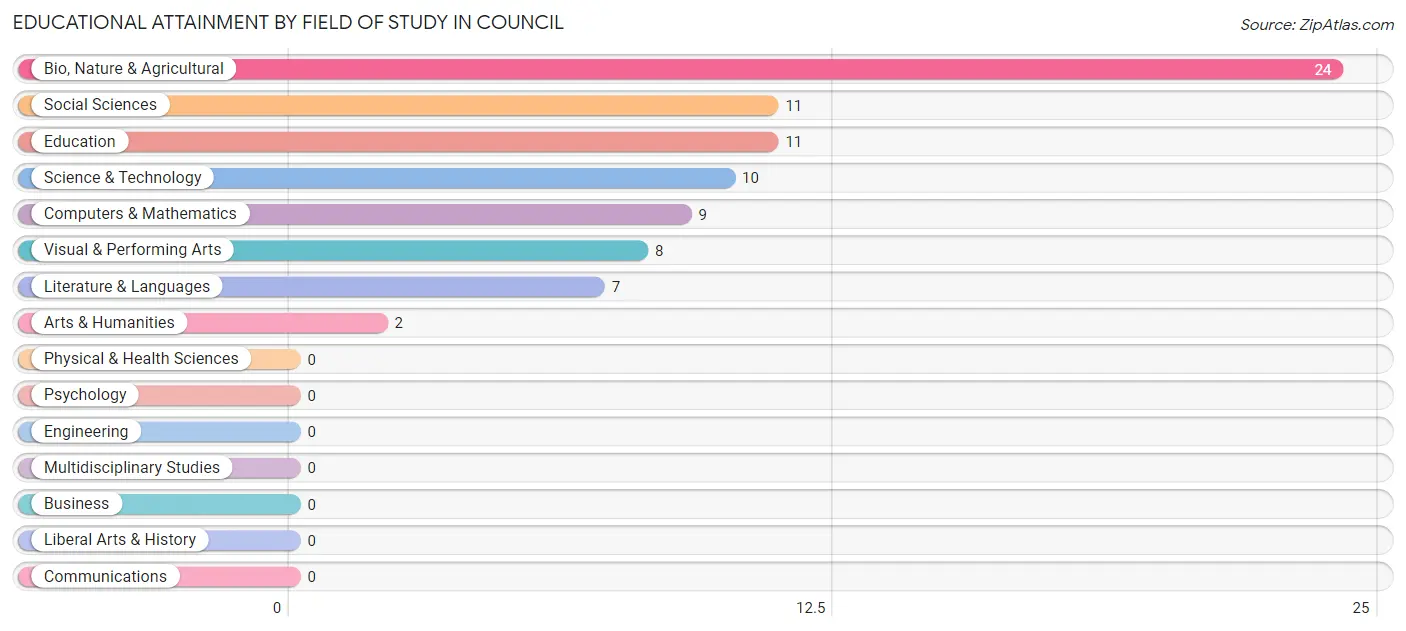
| Field of Study | # Graduates | % Graduates |
| Computers & Mathematics | 9 | 11.0% |
| Bio, Nature & Agricultural | 24 | 29.3% |
| Physical & Health Sciences | 0 | 0.0% |
| Psychology | 0 | 0.0% |
| Social Sciences | 11 | 13.4% |
| Engineering | 0 | 0.0% |
| Multidisciplinary Studies | 0 | 0.0% |
| Science & Technology | 10 | 12.2% |
| Business | 0 | 0.0% |
| Education | 11 | 13.4% |
| Literature & Languages | 7 | 8.5% |
| Liberal Arts & History | 0 | 0.0% |
| Visual & Performing Arts | 8 | 9.8% |
| Communications | 0 | 0.0% |
| Arts & Humanities | 2 | 2.4% |
| Total | 82 | 100.0% |
Transportation & Commute in Council
Vehicle Availability by Sex in Council
The most prevalent vehicle ownership categories in Council are males with 2 vehicles (77, accounting for 78.6%) and females with 2 vehicles (20, making up 160.4%).
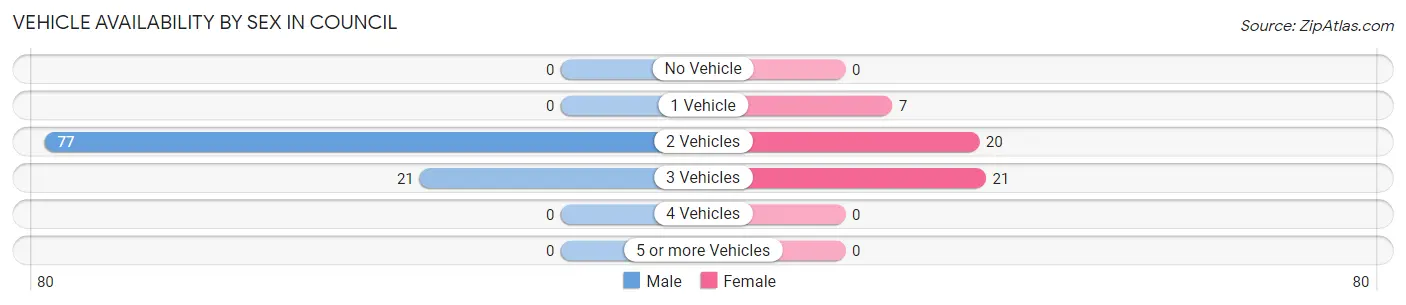
| Vehicles Available | Male | Female |
| No Vehicle | 0 (0.0%) | 0 (0.0%) |
| 1 Vehicle | 0 (0.0%) | 7 (14.6%) |
| 2 Vehicles | 77 (78.6%) | 20 (41.7%) |
| 3 Vehicles | 21 (21.4%) | 21 (43.8%) |
| 4 Vehicles | 0 (0.0%) | 0 (0.0%) |
| 5 or more Vehicles | 0 (0.0%) | 0 (0.0%) |
| Total | 98 (100.0%) | 48 (100.0%) |
Commute Time in Council
The most frequently occuring commute durations in Council are less than 5 minutes (41 commuters, 38.7%), 5 to 9 minutes (30 commuters, 28.3%), and 25 to 29 minutes (12 commuters, 11.3%).
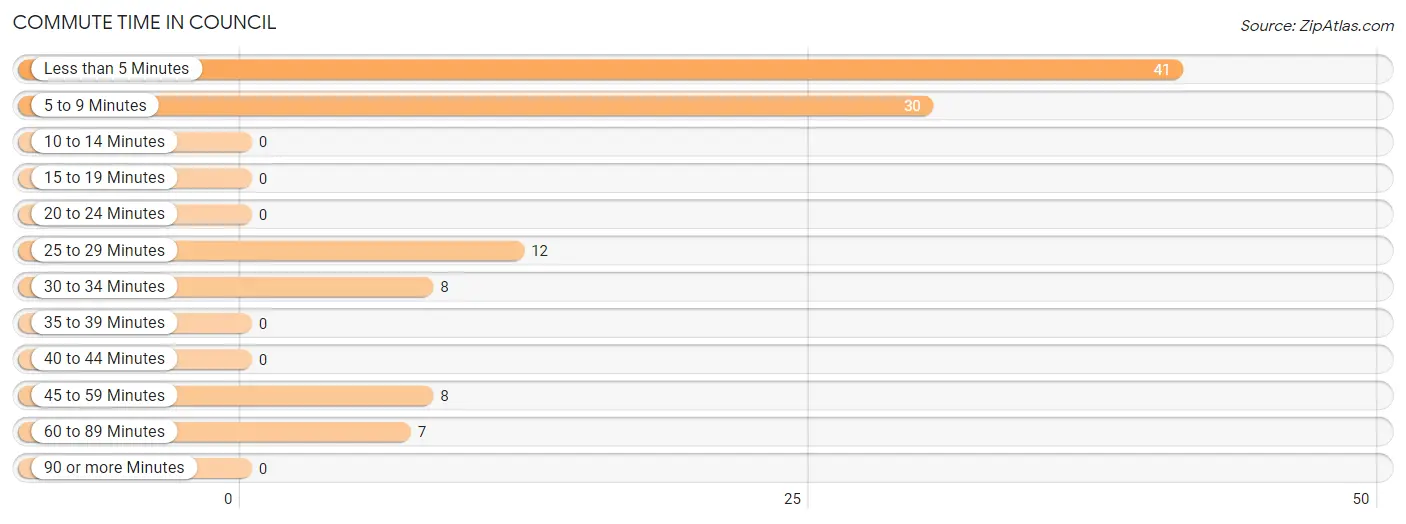
| Commute Time | # Commuters | % Commuters |
| Less than 5 Minutes | 41 | 38.7% |
| 5 to 9 Minutes | 30 | 28.3% |
| 10 to 14 Minutes | 0 | 0.0% |
| 15 to 19 Minutes | 0 | 0.0% |
| 20 to 24 Minutes | 0 | 0.0% |
| 25 to 29 Minutes | 12 | 11.3% |
| 30 to 34 Minutes | 8 | 7.5% |
| 35 to 39 Minutes | 0 | 0.0% |
| 40 to 44 Minutes | 0 | 0.0% |
| 45 to 59 Minutes | 8 | 7.5% |
| 60 to 89 Minutes | 7 | 6.6% |
| 90 or more Minutes | 0 | 0.0% |
Commute Time by Sex in Council
The most common commute times in Council are 5 to 9 minutes (23 commuters, 35.9%) for males and less than 5 minutes (25 commuters, 59.5%) for females.
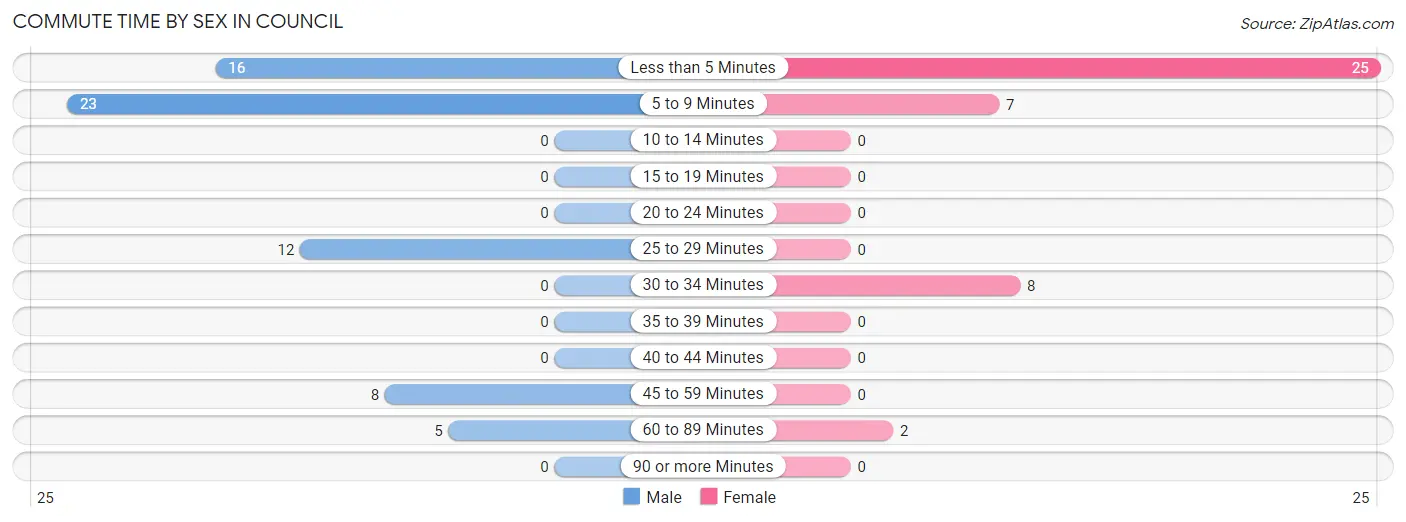
| Commute Time | Male | Female |
| Less than 5 Minutes | 16 (25.0%) | 25 (59.5%) |
| 5 to 9 Minutes | 23 (35.9%) | 7 (16.7%) |
| 10 to 14 Minutes | 0 (0.0%) | 0 (0.0%) |
| 15 to 19 Minutes | 0 (0.0%) | 0 (0.0%) |
| 20 to 24 Minutes | 0 (0.0%) | 0 (0.0%) |
| 25 to 29 Minutes | 12 (18.8%) | 0 (0.0%) |
| 30 to 34 Minutes | 0 (0.0%) | 8 (19.1%) |
| 35 to 39 Minutes | 0 (0.0%) | 0 (0.0%) |
| 40 to 44 Minutes | 0 (0.0%) | 0 (0.0%) |
| 45 to 59 Minutes | 8 (12.5%) | 0 (0.0%) |
| 60 to 89 Minutes | 5 (7.8%) | 2 (4.8%) |
| 90 or more Minutes | 0 (0.0%) | 0 (0.0%) |
Time of Departure to Work by Sex in Council
The most frequent times of departure to work in Council are 6:30 AM to 6:59 AM (29, 45.3%) for males and 12:00 PM to 3:59 PM (11, 26.2%) for females.
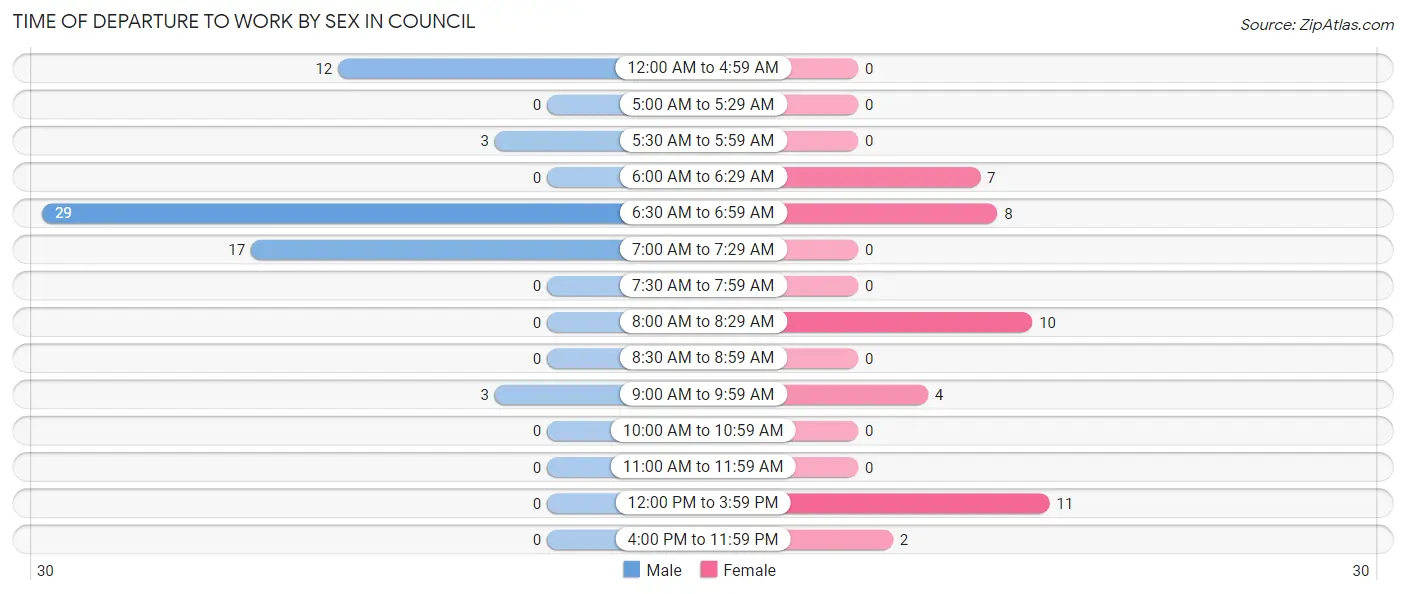
| Time of Departure | Male | Female |
| 12:00 AM to 4:59 AM | 12 (18.8%) | 0 (0.0%) |
| 5:00 AM to 5:29 AM | 0 (0.0%) | 0 (0.0%) |
| 5:30 AM to 5:59 AM | 3 (4.7%) | 0 (0.0%) |
| 6:00 AM to 6:29 AM | 0 (0.0%) | 7 (16.7%) |
| 6:30 AM to 6:59 AM | 29 (45.3%) | 8 (19.1%) |
| 7:00 AM to 7:29 AM | 17 (26.6%) | 0 (0.0%) |
| 7:30 AM to 7:59 AM | 0 (0.0%) | 0 (0.0%) |
| 8:00 AM to 8:29 AM | 0 (0.0%) | 10 (23.8%) |
| 8:30 AM to 8:59 AM | 0 (0.0%) | 0 (0.0%) |
| 9:00 AM to 9:59 AM | 3 (4.7%) | 4 (9.5%) |
| 10:00 AM to 10:59 AM | 0 (0.0%) | 0 (0.0%) |
| 11:00 AM to 11:59 AM | 0 (0.0%) | 0 (0.0%) |
| 12:00 PM to 3:59 PM | 0 (0.0%) | 11 (26.2%) |
| 4:00 PM to 11:59 PM | 0 (0.0%) | 2 (4.8%) |
| Total | 64 (100.0%) | 42 (100.0%) |
Housing Occupancy in Council
Occupancy by Ownership in Council
Of the total 288 dwellings in Council, owner-occupied units account for 180 (62.5%), while renter-occupied units make up 108 (37.5%).
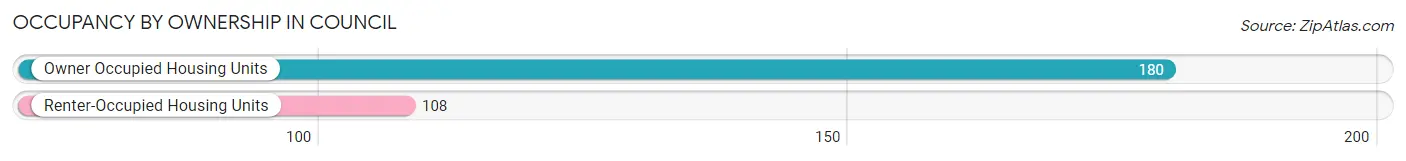
| Occupancy | # Housing Units | % Housing Units |
| Owner Occupied Housing Units | 180 | 62.5% |
| Renter-Occupied Housing Units | 108 | 37.5% |
| Total Occupied Housing Units | 288 | 100.0% |
Occupancy by Household Size in Council
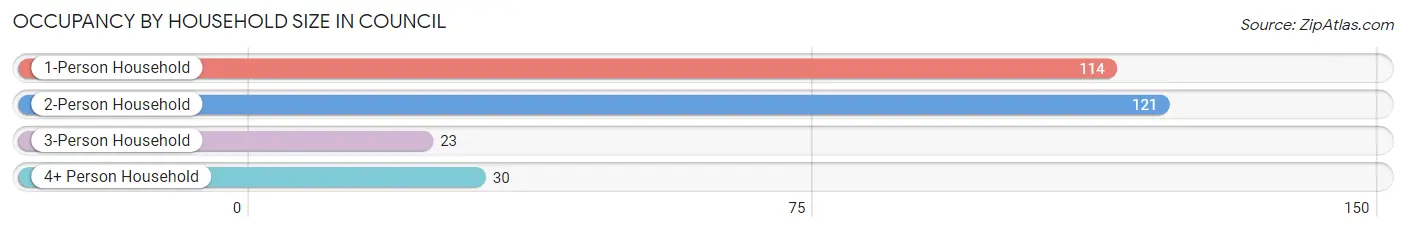
| Household Size | # Housing Units | % Housing Units |
| 1-Person Household | 114 | 39.6% |
| 2-Person Household | 121 | 42.0% |
| 3-Person Household | 23 | 8.0% |
| 4+ Person Household | 30 | 10.4% |
| Total Housing Units | 288 | 100.0% |
Occupancy by Ownership by Household Size in Council
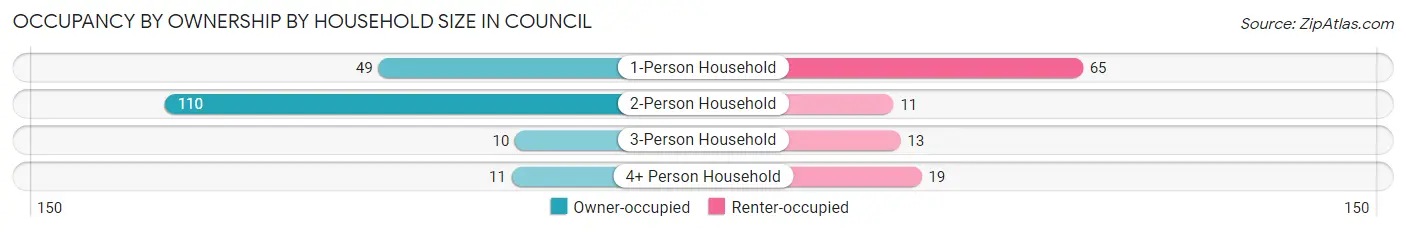
| Household Size | Owner-occupied | Renter-occupied |
| 1-Person Household | 49 (43.0%) | 65 (57.0%) |
| 2-Person Household | 110 (90.9%) | 11 (9.1%) |
| 3-Person Household | 10 (43.5%) | 13 (56.5%) |
| 4+ Person Household | 11 (36.7%) | 19 (63.3%) |
| Total Housing Units | 180 (62.5%) | 108 (37.5%) |
Occupancy by Educational Attainment in Council
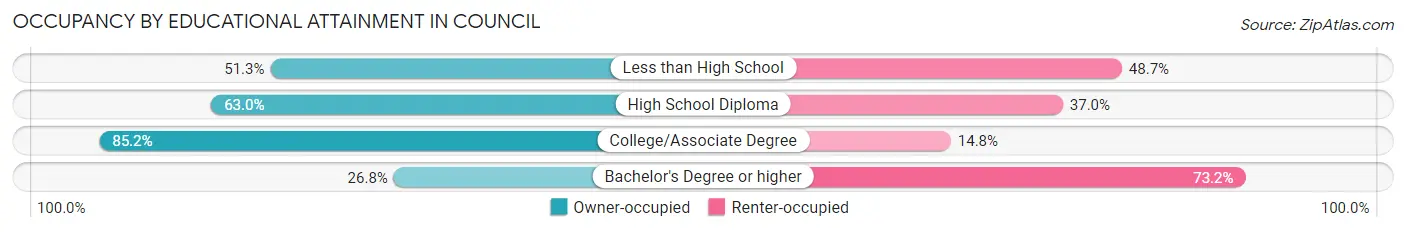
| Household Size | Owner-occupied | Renter-occupied |
| Less than High School | 20 (51.3%) | 19 (48.7%) |
| High School Diploma | 80 (63.0%) | 47 (37.0%) |
| College/Associate Degree | 69 (85.2%) | 12 (14.8%) |
| Bachelor's Degree or higher | 11 (26.8%) | 30 (73.2%) |
Occupancy by Age of Householder in Council
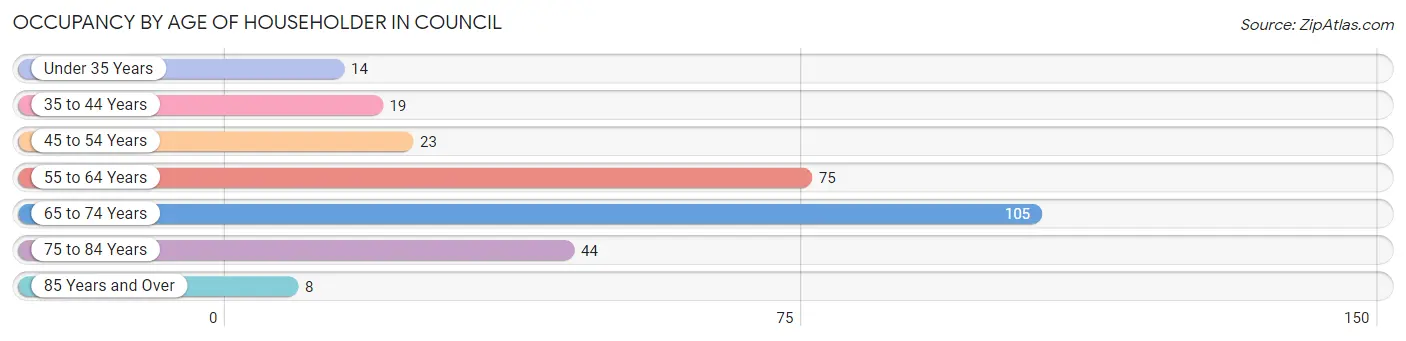
| Age Bracket | # Households | % Households |
| Under 35 Years | 14 | 4.9% |
| 35 to 44 Years | 19 | 6.6% |
| 45 to 54 Years | 23 | 8.0% |
| 55 to 64 Years | 75 | 26.0% |
| 65 to 74 Years | 105 | 36.5% |
| 75 to 84 Years | 44 | 15.3% |
| 85 Years and Over | 8 | 2.8% |
| Total | 288 | 100.0% |
Housing Finances in Council
Median Income by Occupancy in Council
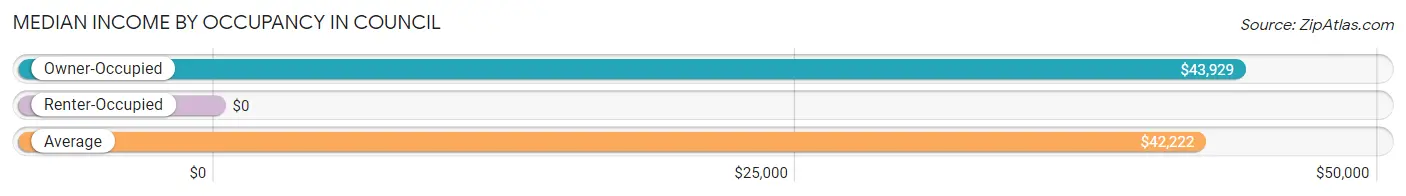
| Occupancy Type | # Households | Median Income |
| Owner-Occupied | 180 (62.5%) | $43,929 |
| Renter-Occupied | 108 (37.5%) | $0 |
| Average | 288 (100.0%) | $42,222 |
Occupancy by Householder Income Bracket in Council
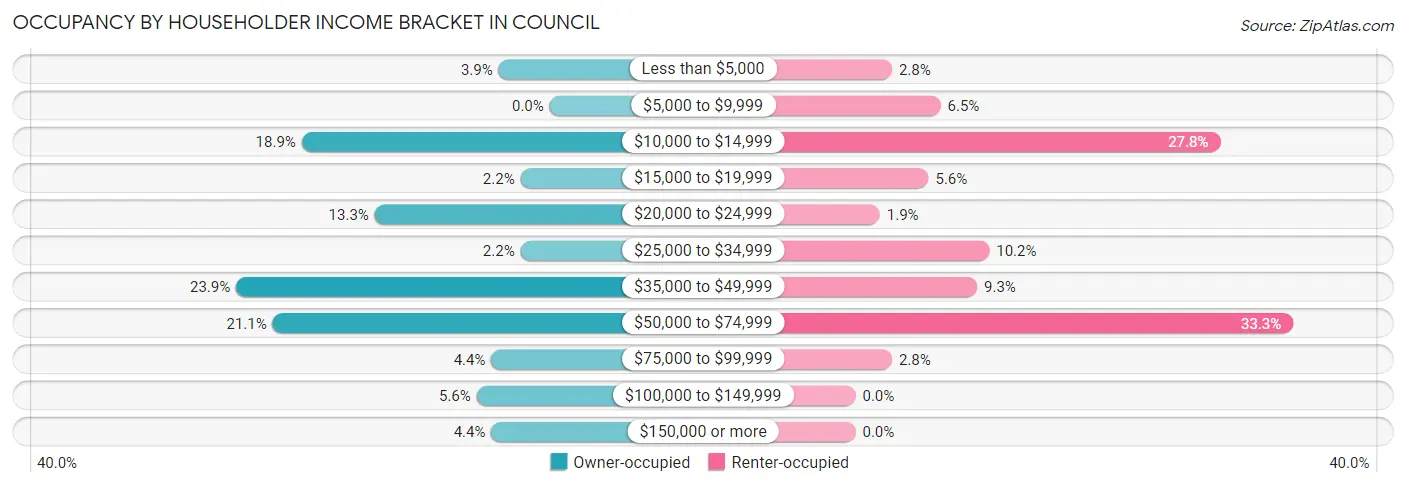
| Income Bracket | Owner-occupied | Renter-occupied |
| Less than $5,000 | 7 (3.9%) | 3 (2.8%) |
| $5,000 to $9,999 | 0 (0.0%) | 7 (6.5%) |
| $10,000 to $14,999 | 34 (18.9%) | 30 (27.8%) |
| $15,000 to $19,999 | 4 (2.2%) | 6 (5.6%) |
| $20,000 to $24,999 | 24 (13.3%) | 2 (1.8%) |
| $25,000 to $34,999 | 4 (2.2%) | 11 (10.2%) |
| $35,000 to $49,999 | 43 (23.9%) | 10 (9.3%) |
| $50,000 to $74,999 | 38 (21.1%) | 36 (33.3%) |
| $75,000 to $99,999 | 8 (4.4%) | 3 (2.8%) |
| $100,000 to $149,999 | 10 (5.6%) | 0 (0.0%) |
| $150,000 or more | 8 (4.4%) | 0 (0.0%) |
| Total | 180 (100.0%) | 108 (100.0%) |
Monthly Housing Cost Tiers in Council
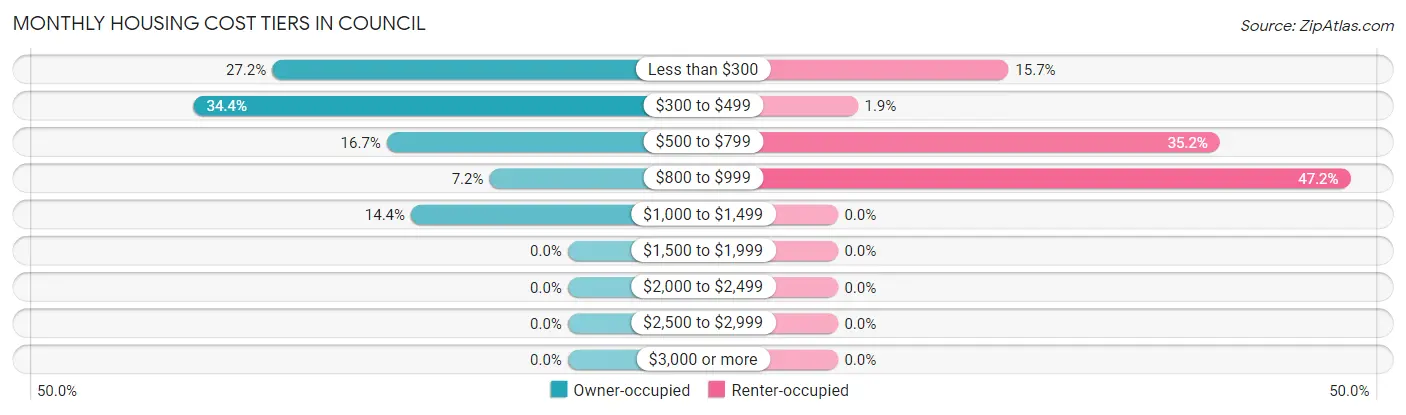
| Monthly Cost | Owner-occupied | Renter-occupied |
| Less than $300 | 49 (27.2%) | 17 (15.7%) |
| $300 to $499 | 62 (34.4%) | 2 (1.8%) |
| $500 to $799 | 30 (16.7%) | 38 (35.2%) |
| $800 to $999 | 13 (7.2%) | 51 (47.2%) |
| $1,000 to $1,499 | 26 (14.4%) | 0 (0.0%) |
| $1,500 to $1,999 | 0 (0.0%) | 0 (0.0%) |
| $2,000 to $2,499 | 0 (0.0%) | 0 (0.0%) |
| $2,500 to $2,999 | 0 (0.0%) | 0 (0.0%) |
| $3,000 or more | 0 (0.0%) | 0 (0.0%) |
| Total | 180 (100.0%) | 108 (100.0%) |
Physical Housing Characteristics in Council
Housing Structures in Council
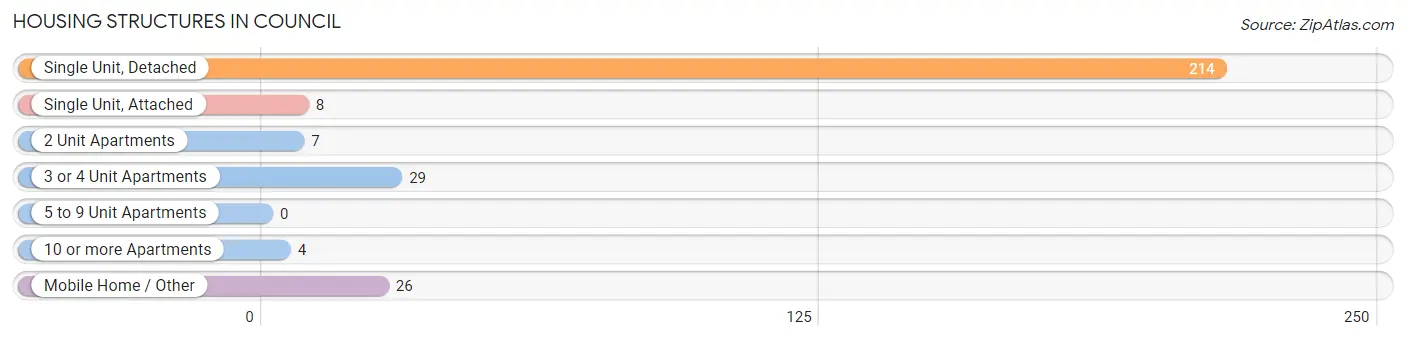
| Structure Type | # Housing Units | % Housing Units |
| Single Unit, Detached | 214 | 74.3% |
| Single Unit, Attached | 8 | 2.8% |
| 2 Unit Apartments | 7 | 2.4% |
| 3 or 4 Unit Apartments | 29 | 10.1% |
| 5 to 9 Unit Apartments | 0 | 0.0% |
| 10 or more Apartments | 4 | 1.4% |
| Mobile Home / Other | 26 | 9.0% |
| Total | 288 | 100.0% |
Housing Structures by Occupancy in Council
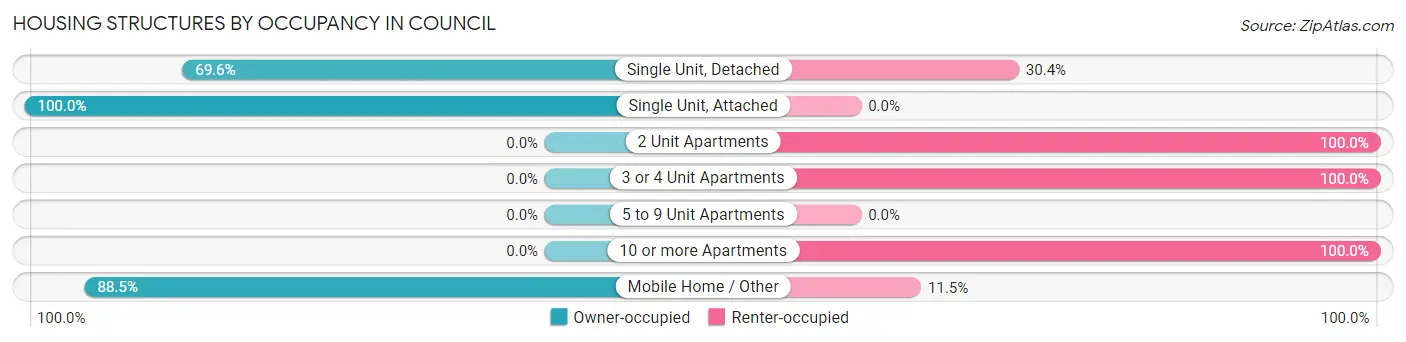
| Structure Type | Owner-occupied | Renter-occupied |
| Single Unit, Detached | 149 (69.6%) | 65 (30.4%) |
| Single Unit, Attached | 8 (100.0%) | 0 (0.0%) |
| 2 Unit Apartments | 0 (0.0%) | 7 (100.0%) |
| 3 or 4 Unit Apartments | 0 (0.0%) | 29 (100.0%) |
| 5 to 9 Unit Apartments | 0 (0.0%) | 0 (0.0%) |
| 10 or more Apartments | 0 (0.0%) | 4 (100.0%) |
| Mobile Home / Other | 23 (88.5%) | 3 (11.5%) |
| Total | 180 (62.5%) | 108 (37.5%) |
Housing Structures by Number of Rooms in Council
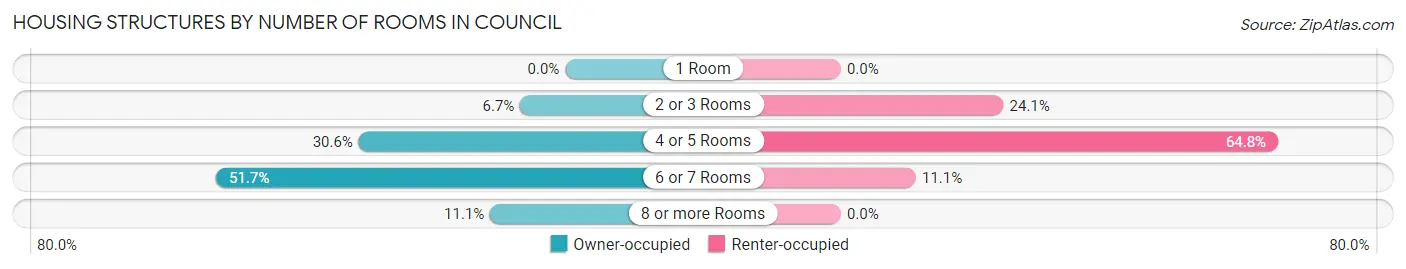
| Number of Rooms | Owner-occupied | Renter-occupied |
| 1 Room | 0 (0.0%) | 0 (0.0%) |
| 2 or 3 Rooms | 12 (6.7%) | 26 (24.1%) |
| 4 or 5 Rooms | 55 (30.6%) | 70 (64.8%) |
| 6 or 7 Rooms | 93 (51.7%) | 12 (11.1%) |
| 8 or more Rooms | 20 (11.1%) | 0 (0.0%) |
| Total | 180 (100.0%) | 108 (100.0%) |
Housing Structure by Heating Type in Council
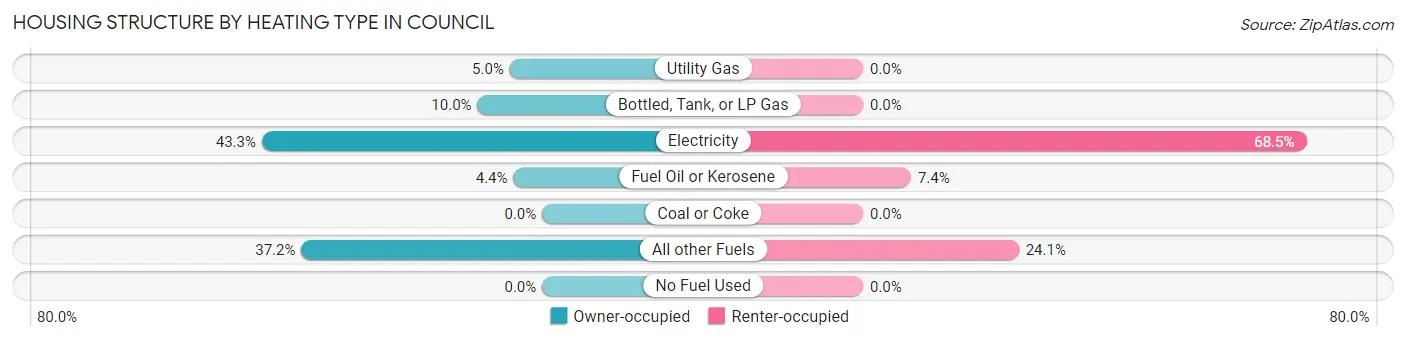
| Heating Type | Owner-occupied | Renter-occupied |
| Utility Gas | 9 (5.0%) | 0 (0.0%) |
| Bottled, Tank, or LP Gas | 18 (10.0%) | 0 (0.0%) |
| Electricity | 78 (43.3%) | 74 (68.5%) |
| Fuel Oil or Kerosene | 8 (4.4%) | 8 (7.4%) |
| Coal or Coke | 0 (0.0%) | 0 (0.0%) |
| All other Fuels | 67 (37.2%) | 26 (24.1%) |
| No Fuel Used | 0 (0.0%) | 0 (0.0%) |
| Total | 180 (100.0%) | 108 (100.0%) |
Household Vehicle Usage in Council
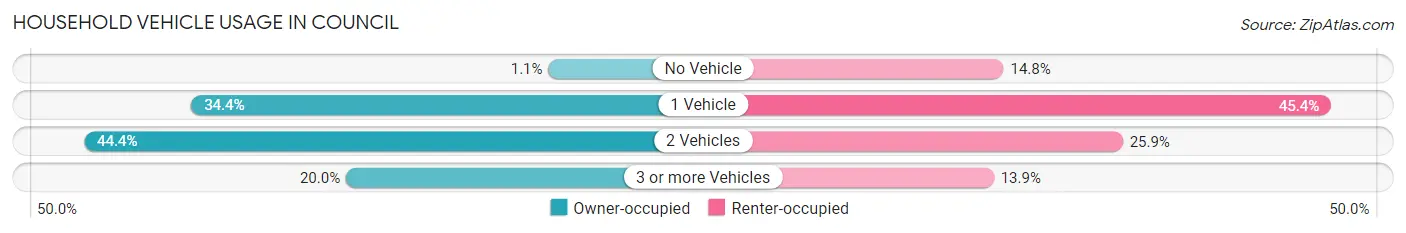
| Vehicles per Household | Owner-occupied | Renter-occupied |
| No Vehicle | 2 (1.1%) | 16 (14.8%) |
| 1 Vehicle | 62 (34.4%) | 49 (45.4%) |
| 2 Vehicles | 80 (44.4%) | 28 (25.9%) |
| 3 or more Vehicles | 36 (20.0%) | 15 (13.9%) |
| Total | 180 (100.0%) | 108 (100.0%) |
Real Estate & Mortgages in Council
Real Estate and Mortgage Overview in Council
| Characteristic | Without Mortgage | With Mortgage |
| Housing Units | 133 | 47 |
| Median Property Value | $174,000 | $108,600 |
| Median Household Income | $41,806 | $0 |
| Monthly Housing Costs | $328 | $0 |
| Real Estate Taxes | $736 | $2 |
Property Value by Mortgage Status in Council
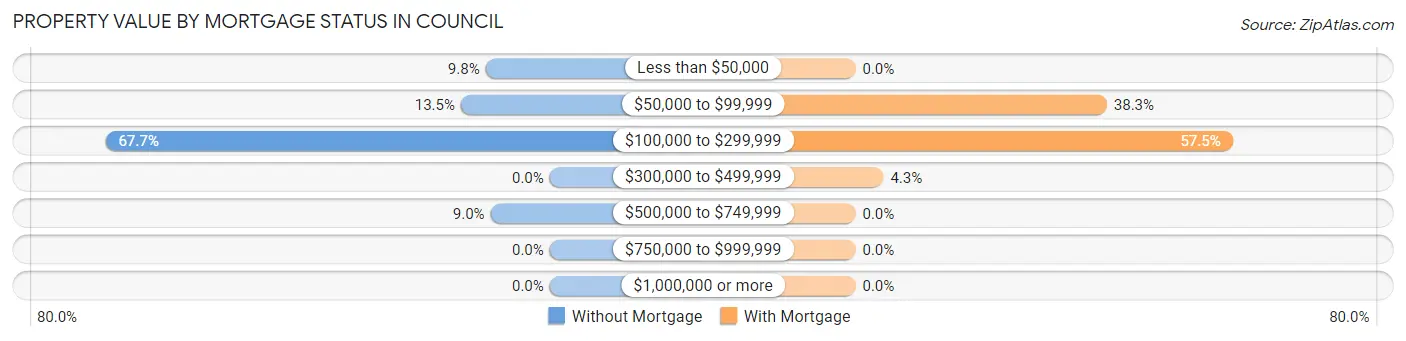
| Property Value | Without Mortgage | With Mortgage |
| Less than $50,000 | 13 (9.8%) | 0 (0.0%) |
| $50,000 to $99,999 | 18 (13.5%) | 18 (38.3%) |
| $100,000 to $299,999 | 90 (67.7%) | 27 (57.5%) |
| $300,000 to $499,999 | 0 (0.0%) | 2 (4.3%) |
| $500,000 to $749,999 | 12 (9.0%) | 0 (0.0%) |
| $750,000 to $999,999 | 0 (0.0%) | 0 (0.0%) |
| $1,000,000 or more | 0 (0.0%) | 0 (0.0%) |
| Total | 133 (100.0%) | 47 (100.0%) |
Household Income by Mortgage Status in Council
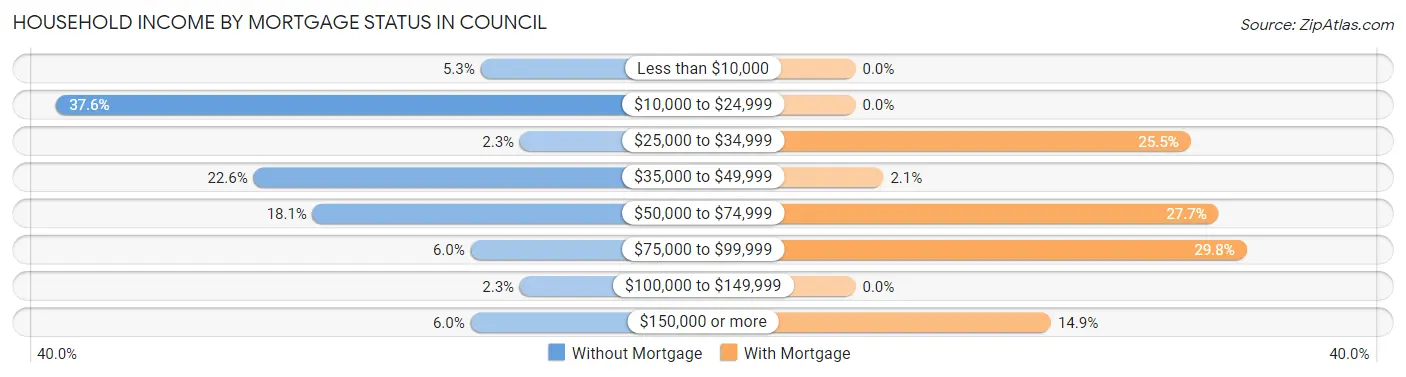
| Household Income | Without Mortgage | With Mortgage |
| Less than $10,000 | 7 (5.3%) | 0 (0.0%) |
| $10,000 to $24,999 | 50 (37.6%) | 0 (0.0%) |
| $25,000 to $34,999 | 3 (2.3%) | 12 (25.5%) |
| $35,000 to $49,999 | 30 (22.6%) | 1 (2.1%) |
| $50,000 to $74,999 | 24 (18.0%) | 13 (27.7%) |
| $75,000 to $99,999 | 8 (6.0%) | 14 (29.8%) |
| $100,000 to $149,999 | 3 (2.3%) | 0 (0.0%) |
| $150,000 or more | 8 (6.0%) | 7 (14.9%) |
| Total | 133 (100.0%) | 47 (100.0%) |
Property Value to Household Income Ratio in Council
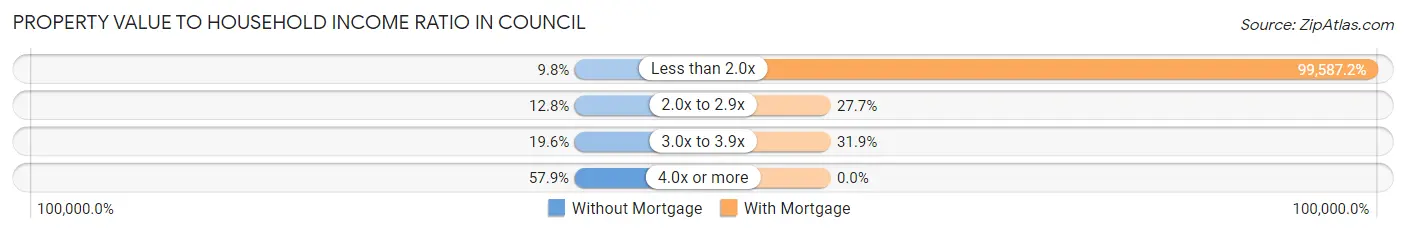
| Value-to-Income Ratio | Without Mortgage | With Mortgage |
| Less than 2.0x | 13 (9.8%) | 46,806 (99,587.2%) |
| 2.0x to 2.9x | 17 (12.8%) | 13 (27.7%) |
| 3.0x to 3.9x | 26 (19.6%) | 15 (31.9%) |
| 4.0x or more | 77 (57.9%) | 0 (0.0%) |
| Total | 133 (100.0%) | 47 (100.0%) |
Real Estate Taxes by Mortgage Status in Council
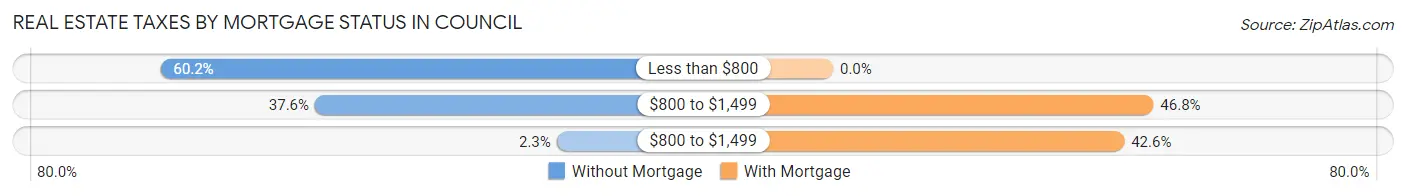
| Property Taxes | Without Mortgage | With Mortgage |
| Less than $800 | 80 (60.2%) | 0 (0.0%) |
| $800 to $1,499 | 50 (37.6%) | 22 (46.8%) |
| $800 to $1,499 | 3 (2.3%) | 20 (42.5%) |
| Total | 133 (100.0%) | 47 (100.0%) |
Health & Disability in Council
Health Insurance Coverage by Age in Council
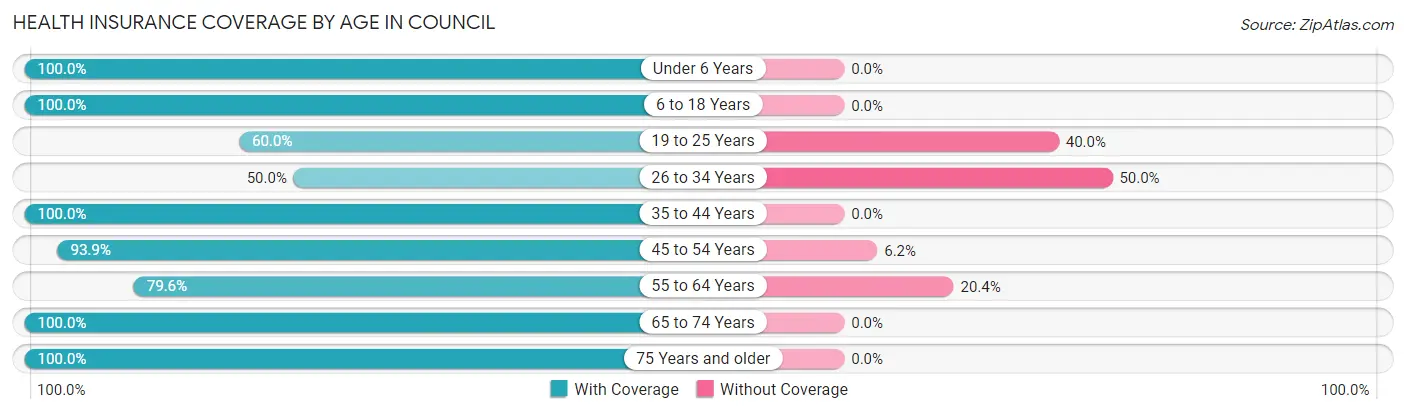
| Age Bracket | With Coverage | Without Coverage |
| Under 6 Years | 25 (100.0%) | 0 (0.0%) |
| 6 to 18 Years | 66 (100.0%) | 0 (0.0%) |
| 19 to 25 Years | 18 (60.0%) | 12 (40.0%) |
| 26 to 34 Years | 25 (50.0%) | 25 (50.0%) |
| 35 to 44 Years | 21 (100.0%) | 0 (0.0%) |
| 45 to 54 Years | 61 (93.9%) | 4 (6.1%) |
| 55 to 64 Years | 129 (79.6%) | 33 (20.4%) |
| 65 to 74 Years | 137 (100.0%) | 0 (0.0%) |
| 75 Years and older | 75 (100.0%) | 0 (0.0%) |
| Total | 557 (88.3%) | 74 (11.7%) |
Health Insurance Coverage by Citizenship Status in Council
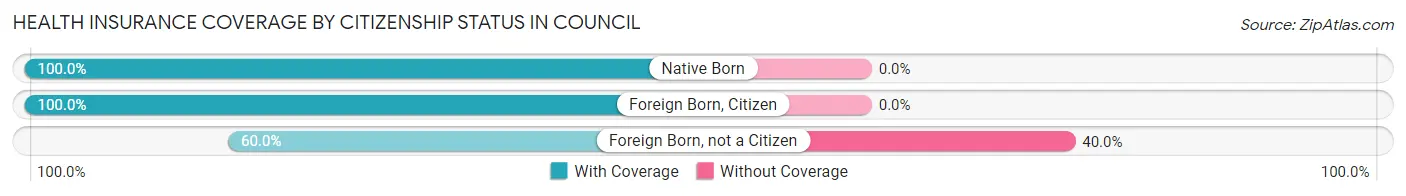
| Citizenship Status | With Coverage | Without Coverage |
| Native Born | 25 (100.0%) | 0 (0.0%) |
| Foreign Born, Citizen | 66 (100.0%) | 0 (0.0%) |
| Foreign Born, not a Citizen | 18 (60.0%) | 12 (40.0%) |
Health Insurance Coverage by Household Income in Council
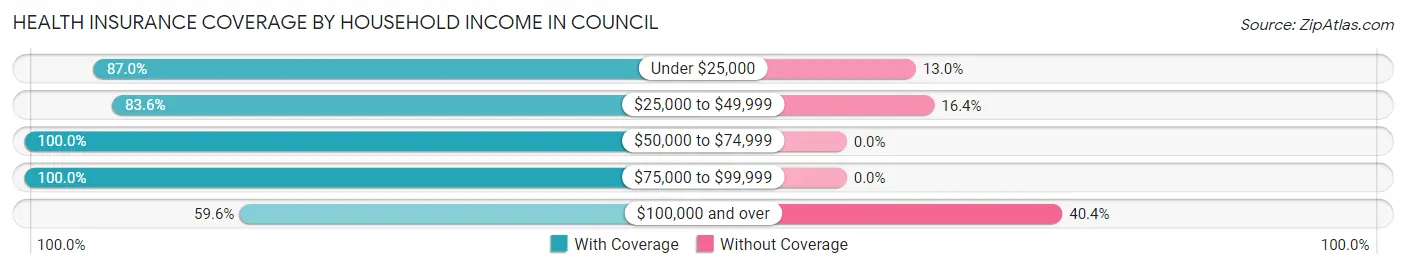
| Household Income | With Coverage | Without Coverage |
| Under $25,000 | 141 (87.0%) | 21 (13.0%) |
| $25,000 to $49,999 | 163 (83.6%) | 32 (16.4%) |
| $50,000 to $74,999 | 173 (100.0%) | 0 (0.0%) |
| $75,000 to $99,999 | 49 (100.0%) | 0 (0.0%) |
| $100,000 and over | 31 (59.6%) | 21 (40.4%) |
Public vs Private Health Insurance Coverage by Age in Council
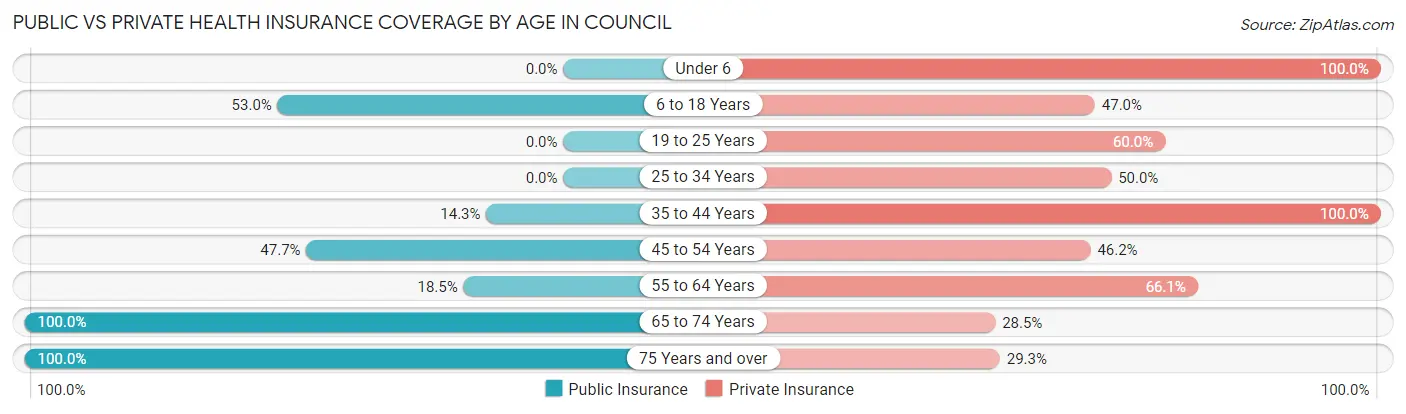
| Age Bracket | Public Insurance | Private Insurance |
| Under 6 | 0 (0.0%) | 25 (100.0%) |
| 6 to 18 Years | 35 (53.0%) | 31 (47.0%) |
| 19 to 25 Years | 0 (0.0%) | 18 (60.0%) |
| 25 to 34 Years | 0 (0.0%) | 25 (50.0%) |
| 35 to 44 Years | 3 (14.3%) | 21 (100.0%) |
| 45 to 54 Years | 31 (47.7%) | 30 (46.2%) |
| 55 to 64 Years | 30 (18.5%) | 107 (66.0%) |
| 65 to 74 Years | 137 (100.0%) | 39 (28.5%) |
| 75 Years and over | 75 (100.0%) | 22 (29.3%) |
| Total | 311 (49.3%) | 318 (50.4%) |
Disability Status by Sex by Age in Council
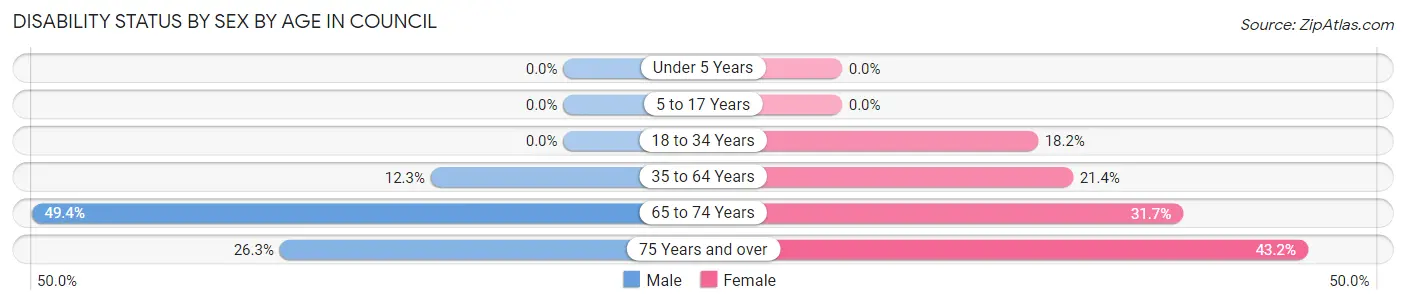
| Age Bracket | Male | Female |
| Under 5 Years | 0 (0.0%) | 0 (0.0%) |
| 5 to 17 Years | 0 (0.0%) | 0 (0.0%) |
| 18 to 34 Years | 0 (0.0%) | 12 (18.2%) |
| 35 to 64 Years | 15 (12.3%) | 27 (21.4%) |
| 65 to 74 Years | 38 (49.3%) | 19 (31.7%) |
| 75 Years and over | 10 (26.3%) | 16 (43.2%) |
Disability Class by Sex by Age in Council
Disability Class: Hearing Difficulty
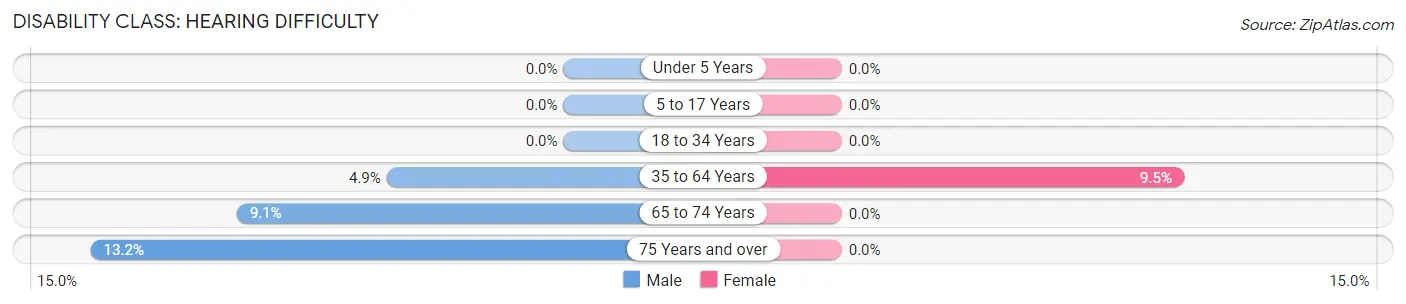
| Age Bracket | Male | Female |
| Under 5 Years | 0 (0.0%) | 0 (0.0%) |
| 5 to 17 Years | 0 (0.0%) | 0 (0.0%) |
| 18 to 34 Years | 0 (0.0%) | 0 (0.0%) |
| 35 to 64 Years | 6 (4.9%) | 12 (9.5%) |
| 65 to 74 Years | 7 (9.1%) | 0 (0.0%) |
| 75 Years and over | 5 (13.2%) | 0 (0.0%) |
Disability Class: Vision Difficulty
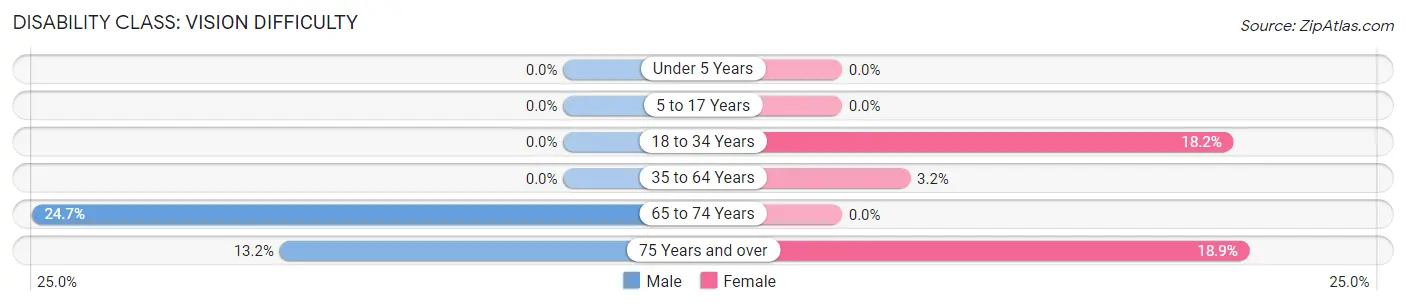
| Age Bracket | Male | Female |
| Under 5 Years | 0 (0.0%) | 0 (0.0%) |
| 5 to 17 Years | 0 (0.0%) | 0 (0.0%) |
| 18 to 34 Years | 0 (0.0%) | 12 (18.2%) |
| 35 to 64 Years | 0 (0.0%) | 4 (3.2%) |
| 65 to 74 Years | 19 (24.7%) | 0 (0.0%) |
| 75 Years and over | 5 (13.2%) | 7 (18.9%) |
Disability Class: Cognitive Difficulty
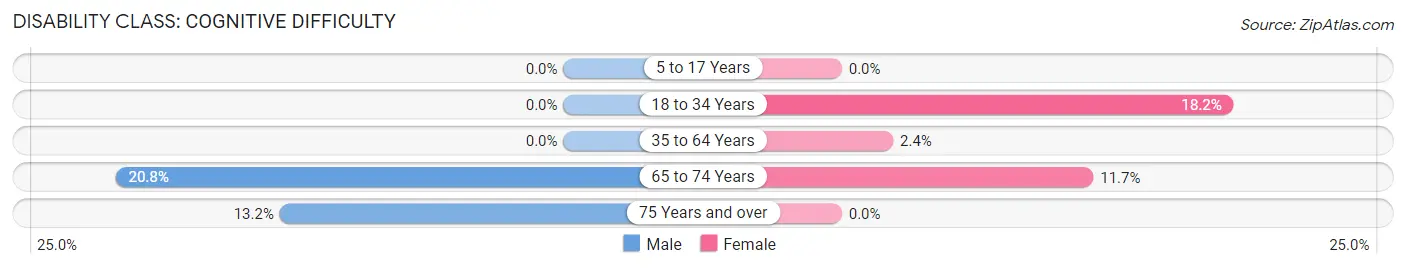
| Age Bracket | Male | Female |
| 5 to 17 Years | 0 (0.0%) | 0 (0.0%) |
| 18 to 34 Years | 0 (0.0%) | 12 (18.2%) |
| 35 to 64 Years | 0 (0.0%) | 3 (2.4%) |
| 65 to 74 Years | 16 (20.8%) | 7 (11.7%) |
| 75 Years and over | 5 (13.2%) | 0 (0.0%) |
Disability Class: Ambulatory Difficulty
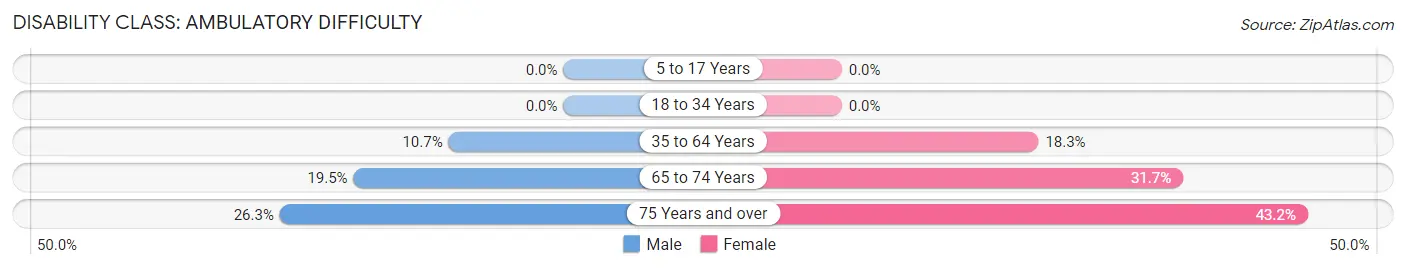
| Age Bracket | Male | Female |
| 5 to 17 Years | 0 (0.0%) | 0 (0.0%) |
| 18 to 34 Years | 0 (0.0%) | 0 (0.0%) |
| 35 to 64 Years | 13 (10.7%) | 23 (18.2%) |
| 65 to 74 Years | 15 (19.5%) | 19 (31.7%) |
| 75 Years and over | 10 (26.3%) | 16 (43.2%) |
Disability Class: Self-Care Difficulty
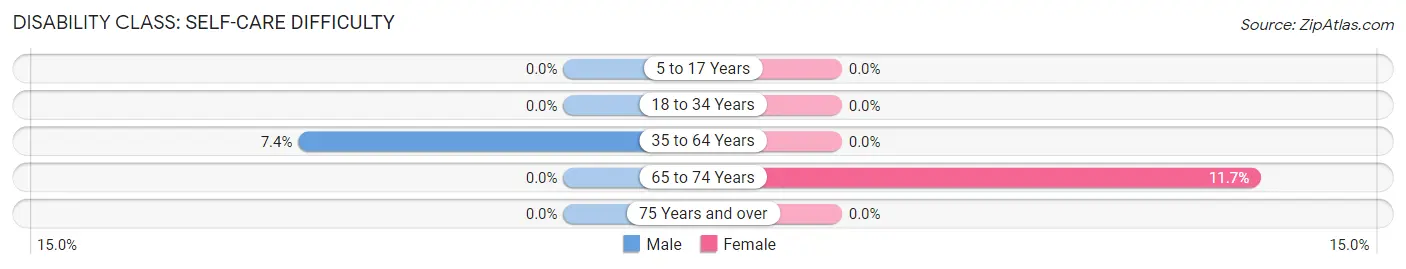
| Age Bracket | Male | Female |
| 5 to 17 Years | 0 (0.0%) | 0 (0.0%) |
| 18 to 34 Years | 0 (0.0%) | 0 (0.0%) |
| 35 to 64 Years | 9 (7.4%) | 0 (0.0%) |
| 65 to 74 Years | 0 (0.0%) | 7 (11.7%) |
| 75 Years and over | 0 (0.0%) | 0 (0.0%) |
Technology Access in Council
Computing Device Access in Council
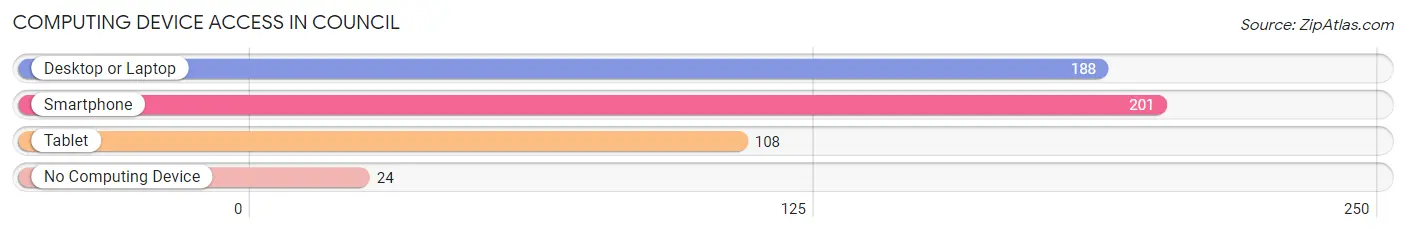
| Device Type | # Households | % Households |
| Desktop or Laptop | 188 | 65.3% |
| Smartphone | 201 | 69.8% |
| Tablet | 108 | 37.5% |
| No Computing Device | 24 | 8.3% |
| Total | 288 | 100.0% |
Internet Access in Council
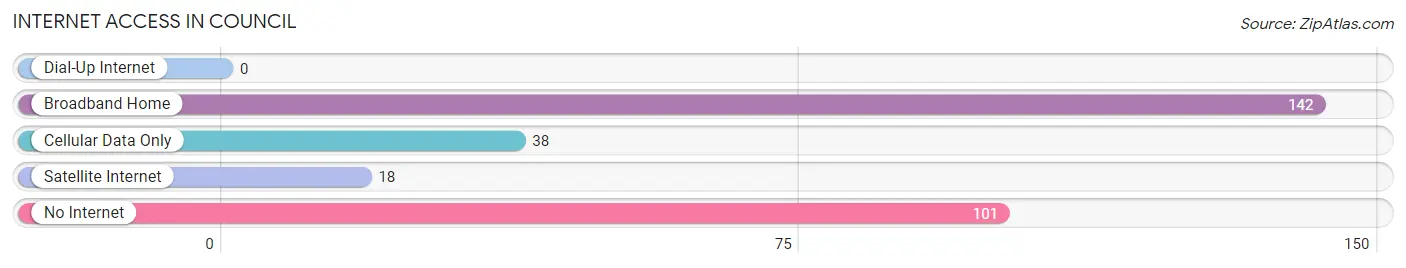
| Internet Type | # Households | % Households |
| Dial-Up Internet | 0 | 0.0% |
| Broadband Home | 142 | 49.3% |
| Cellular Data Only | 38 | 13.2% |
| Satellite Internet | 18 | 6.2% |
| No Internet | 101 | 35.1% |
| Total | 288 | 100.0% |
Council Summary
Introduction
The City of London is the capital of England and the United Kingdom, and is one of the world’s most important financial and cultural centres. It is a global city, with a population of over 8 million people, and is home to some of the world’s most iconic landmarks, such as the Tower of London, the Houses of Parliament and Buckingham Palace. The City of London is a unique and vibrant place, with a rich history, diverse culture and vibrant economy. This essay will explore the history, geography, economy and demographics of the City of London.
History
The City of London has a long and rich history, stretching back to Roman times. The Romans founded the city in AD 43, and it quickly became an important trading centre. The city was also the site of the coronation of William the Conqueror in 1066, and the Tower of London was built in 1078. The city was also the site of the Great Fire of London in 1666, which destroyed much of the city. The city was rebuilt in the following years, and the modern City of London was established in the 19th century.
Geography
The City of London is located in the south-east of England, on the River Thames. It is bordered by the boroughs of Camden, Islington, Hackney, Tower Hamlets, Southwark and Westminster. The City of London covers an area of 1.12 square miles, making it the smallest city in England. The City of London is divided into 25 wards, each of which is represented by an elected councillor.
Economy
The City of London is one of the world’s most important financial centres, and is home to the London Stock Exchange, the Bank of England and the headquarters of many of the world’s largest banks and financial institutions. The City of London is also home to a number of other industries, such as media, technology, legal services and tourism. The City of London is a major centre for business and commerce, and is one of the world’s most important economic hubs.
Demographics
The City of London has a population of over 8 million people, making it one of the most populous cities in the world. The population is diverse, with people from a variety of backgrounds and cultures. The majority of the population is of British origin, but there are also large numbers of people from other European countries, as well as from Asia, Africa and the Americas. The City of London is also home to a large number of immigrants, with over 40% of the population born outside of the UK.
Conclusion
The City of London is a unique and vibrant city, with a rich history, diverse culture and vibrant economy. It is one of the world’s most important financial and cultural centres, and is home to some of the world’s most iconic landmarks. The City of London is also home to a diverse population, with people from a variety of backgrounds and cultures. The City of London is an important economic hub, and is one of the world’s most important cities.
Common Questions
What is Per Capita Income in Council?
Per Capita income in Council is $21,527.
What is the Median Family Income in Council?
Median Family Income in Council is $46,250.
What is the Median Household income in Council?
Median Household Income in Council is $42,222.
What is Family Income Deficit in Council?
Family Income Deficit in Council is $9,133.
Families that are below poverty line in Council earn $9,133 less on average than the poverty threshold level.
What is Inequality or Gini Index in Council?
Inequality or Gini Index in Council is 0.42.
What is the Total Population of Council?
Total Population of Council is 655.
What is the Total Male Population of Council?
Total Male Population of Council is 300.
What is the Total Female Population of Council?
Total Female Population of Council is 355.
What is the Ratio of Males per 100 Females in Council?
There are 84.51 Males per 100 Females in Council.
What is the Ratio of Females per 100 Males in Council?
There are 118.33 Females per 100 Males in Council.
What is the Median Population Age in Council?
Median Population Age in Council is 59.4 Years.
What is the Average Family Size in Council
Average Family Size in Council is 2.9 People.
What is the Average Household Size in Council
Average Household Size in Council is 2.2 People.
How Large is the Labor Force in Council?
There are 182 People in the Labor Forcein in Council.
What is the Percentage of People in the Labor Force in Council?
32.3% of People are in the Labor Force in Council.
What is the Unemployment Rate in Council?
Unemployment Rate in Council is 15.9%.