Richland, GA Map & Demographics
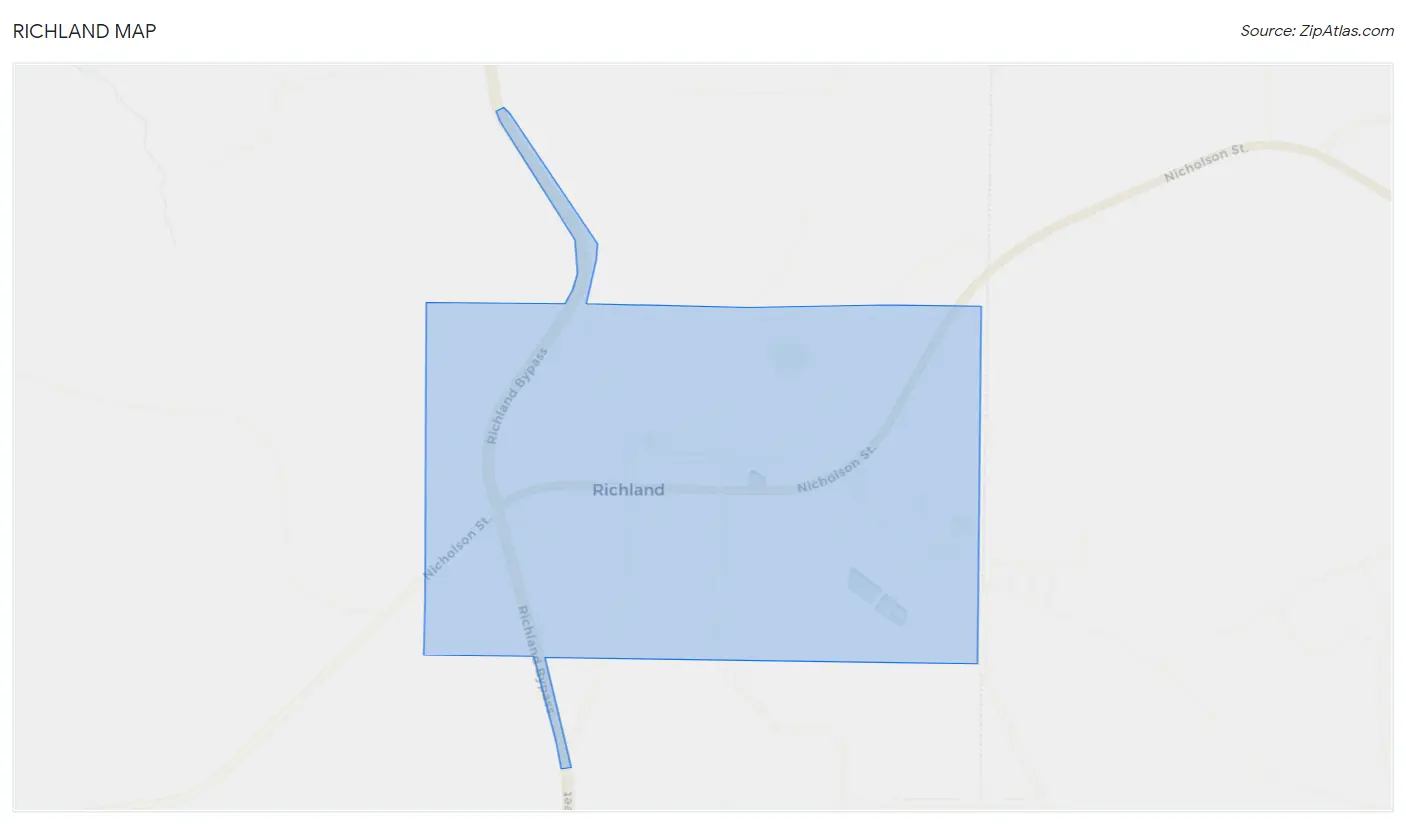
Richland Map
Richland Overview
$22,166
PER CAPITA INCOME
$62,762
AVG FAMILY INCOME
$41,458
AVG HOUSEHOLD INCOME
27.1%
WAGE / INCOME GAP [ % ]
72.9¢/ $1
WAGE / INCOME GAP [ $ ]
0.41
INEQUALITY / GINI INDEX
1,290
TOTAL POPULATION
732
MALE POPULATION
558
FEMALE POPULATION
131.18
MALES / 100 FEMALES
76.23
FEMALES / 100 MALES
39.7
MEDIAN AGE
2.2
AVG FAMILY SIZE
1.8
AVG HOUSEHOLD SIZE
569
LABOR FORCE [ PEOPLE ]
50.4%
PERCENT IN LABOR FORCE
5.4%
UNEMPLOYMENT RATE
Richland Zip Codes
Richland Area Codes
Income in Richland
Income Overview in Richland
Per Capita Income in Richland is $22,166, while median incomes of families and households are $62,762 and $41,458 respectively.
| Characteristic | Number | Measure |
| Per Capita Income | 1,290 | $22,166 |
| Median Family Income | 422 | $62,762 |
| Mean Family Income | 422 | $61,350 |
| Median Household Income | 648 | $41,458 |
| Mean Household Income | 648 | $44,873 |
| Income Deficit | 422 | $0 |
| Wage / Income Gap (%) | 1,290 | 27.08% |
| Wage / Income Gap ($) | 1,290 | 72.92¢ per $1 |
| Gini / Inequality Index | 1,290 | 0.41 |
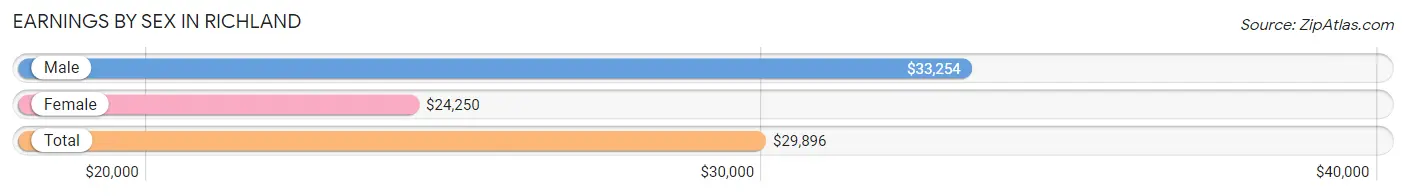
Earnings by Sex in Richland
Average Earnings in Richland are $29,896, $33,254 for men and $24,250 for women, a difference of 27.1%.
| Sex | Number | Average Earnings |
| Male | 366 (64.4%) | $33,254 |
| Female | 202 (35.6%) | $24,250 |
| Total | 568 (100.0%) | $29,896 |
Earnings by Sex by Income Bracket in Richland
The most common earnings brackets in Richland are $30,000 to $34,999 for men (128 | 35.0%) and $25,000 to $29,999 for women (42 | 20.8%).
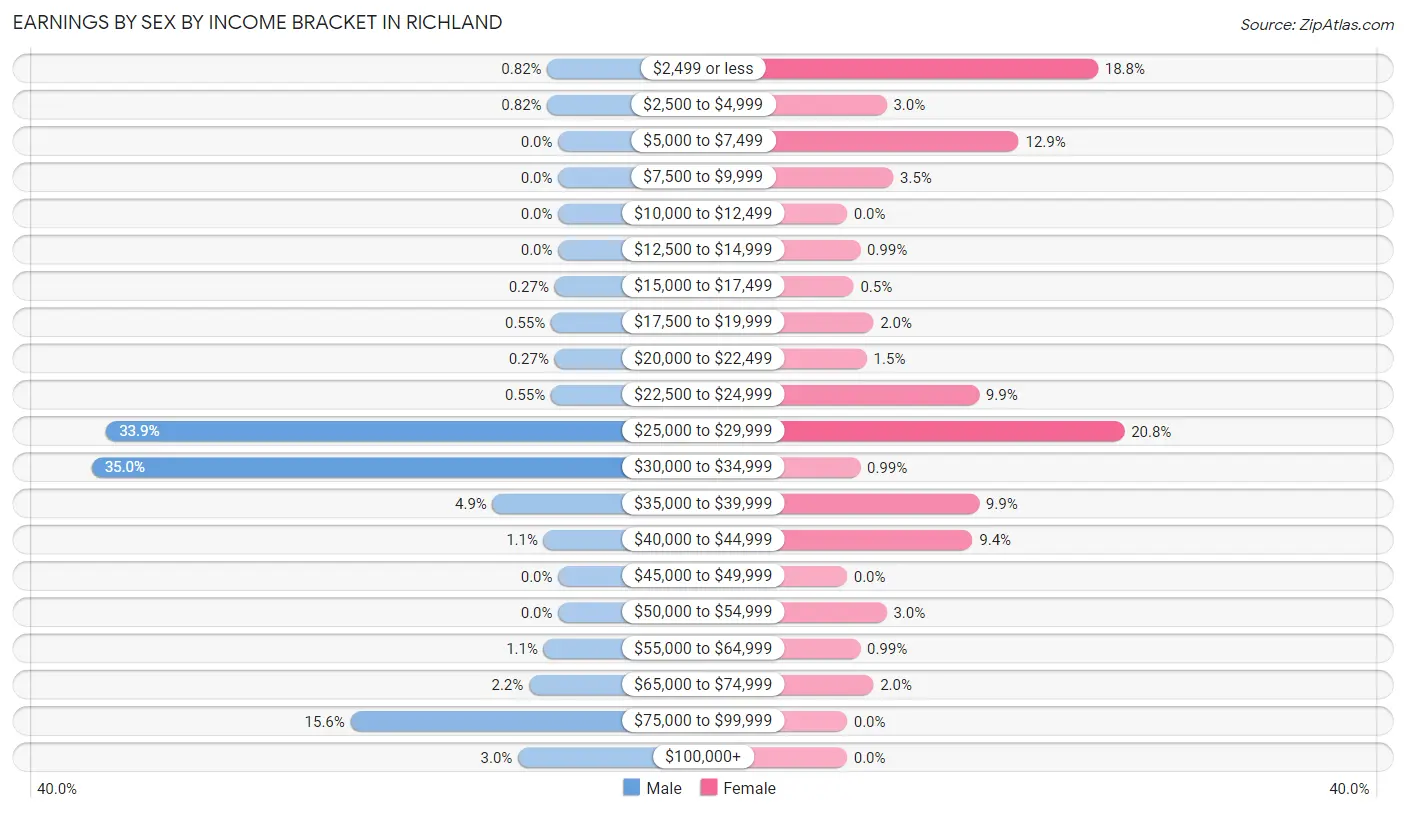
| Income | Male | Female |
| $2,499 or less | 3 (0.8%) | 38 (18.8%) |
| $2,500 to $4,999 | 3 (0.8%) | 6 (3.0%) |
| $5,000 to $7,499 | 0 (0.0%) | 26 (12.9%) |
| $7,500 to $9,999 | 0 (0.0%) | 7 (3.5%) |
| $10,000 to $12,499 | 0 (0.0%) | 0 (0.0%) |
| $12,500 to $14,999 | 0 (0.0%) | 2 (1.0%) |
| $15,000 to $17,499 | 1 (0.3%) | 1 (0.5%) |
| $17,500 to $19,999 | 2 (0.5%) | 4 (2.0%) |
| $20,000 to $22,499 | 1 (0.3%) | 3 (1.5%) |
| $22,500 to $24,999 | 2 (0.5%) | 20 (9.9%) |
| $25,000 to $29,999 | 124 (33.9%) | 42 (20.8%) |
| $30,000 to $34,999 | 128 (35.0%) | 2 (1.0%) |
| $35,000 to $39,999 | 18 (4.9%) | 20 (9.9%) |
| $40,000 to $44,999 | 4 (1.1%) | 19 (9.4%) |
| $45,000 to $49,999 | 0 (0.0%) | 0 (0.0%) |
| $50,000 to $54,999 | 0 (0.0%) | 6 (3.0%) |
| $55,000 to $64,999 | 4 (1.1%) | 2 (1.0%) |
| $65,000 to $74,999 | 8 (2.2%) | 4 (2.0%) |
| $75,000 to $99,999 | 57 (15.6%) | 0 (0.0%) |
| $100,000+ | 11 (3.0%) | 0 (0.0%) |
| Total | 366 (100.0%) | 202 (100.0%) |
Earnings by Sex by Educational Attainment in Richland
Average earnings in Richland are $33,384 for men and $24,438 for women, a difference of 26.8%. Men with an educational attainment of college or associate's degree enjoy the highest average annual earnings of $83,465, while those with bachelor's degree education earn the least with $26,261. Women with an educational attainment of high school diploma earn the most with the average annual earnings of $24,063, while those with high school diploma education have the smallest earnings of $24,063.
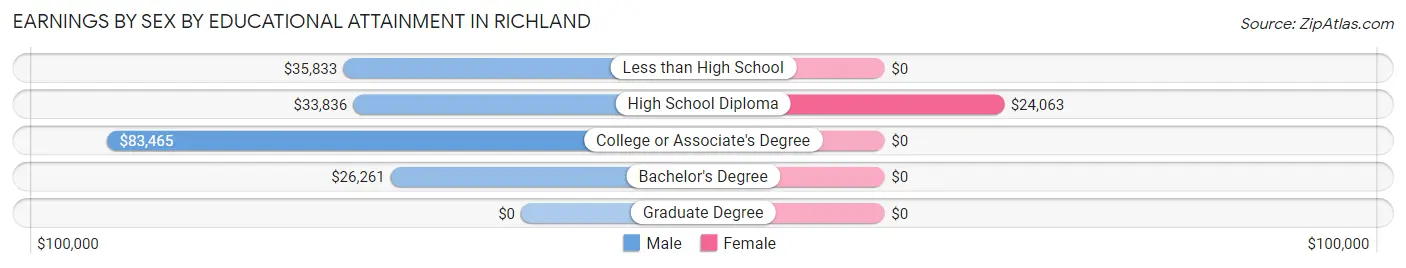
| Educational Attainment | Male Income | Female Income |
| Less than High School | $35,833 | $0 |
| High School Diploma | $33,836 | $24,063 |
| College or Associate's Degree | $83,465 | $0 |
| Bachelor's Degree | $26,261 | $0 |
| Graduate Degree | - | - |
| Total | $33,384 | $24,438 |
Family Income in Richland
Family Income Brackets in Richland
According to the Richland family income data, there are 181 families falling into the $50,000 to $74,999 income range, which is the most common income bracket and makes up 42.9% of all families. Conversely, the less than $10,000 income bracket is the least frequent group with only 3 families (0.7%) belonging to this category.
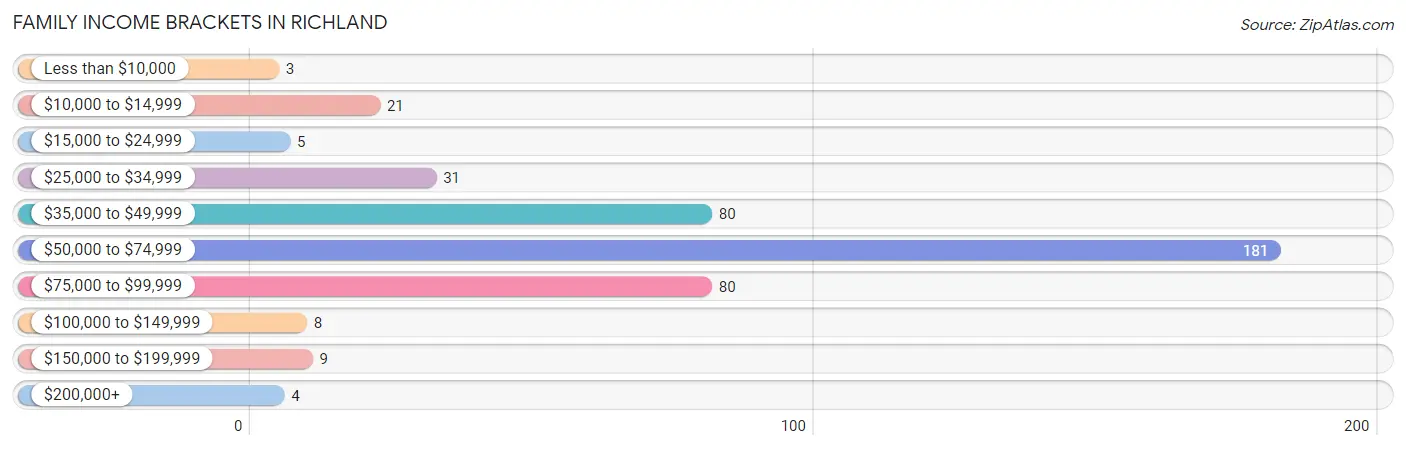
| Income Bracket | # Families | % Families |
| Less than $10,000 | 3 | 0.7% |
| $10,000 to $14,999 | 21 | 5.0% |
| $15,000 to $24,999 | 5 | 1.2% |
| $25,000 to $34,999 | 31 | 7.3% |
| $35,000 to $49,999 | 80 | 19.0% |
| $50,000 to $74,999 | 181 | 42.9% |
| $75,000 to $99,999 | 80 | 19.0% |
| $100,000 to $149,999 | 8 | 1.9% |
| $150,000 to $199,999 | 9 | 2.1% |
| $200,000+ | 4 | 0.9% |
Family Income by Famaliy Size in Richland
2-person families (316 | 74.9%) account for the highest median family income in Richland with $63,204 per family, while 2-person families (316 | 74.9%) have the highest median income of $31,602 per family member.
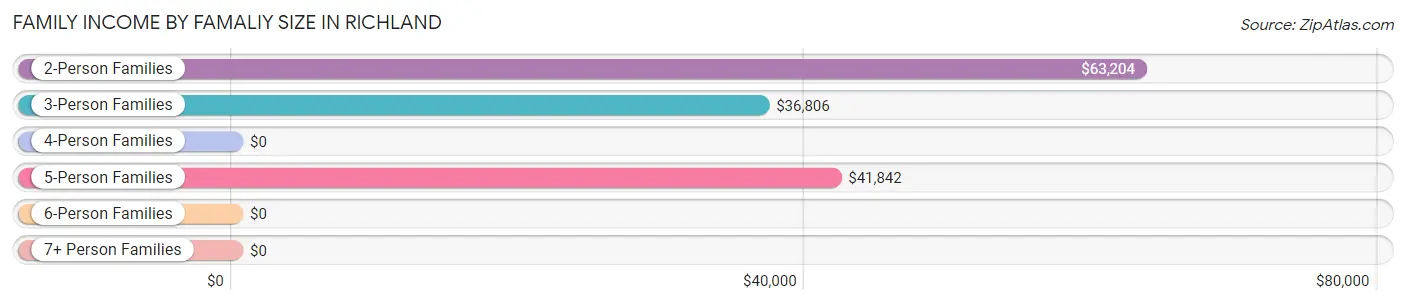
| Income Bracket | # Families | Median Income |
| 2-Person Families | 316 (74.9%) | $63,204 |
| 3-Person Families | 61 (14.4%) | $36,806 |
| 4-Person Families | 5 (1.2%) | $0 |
| 5-Person Families | 28 (6.6%) | $41,842 |
| 6-Person Families | 12 (2.8%) | $0 |
| 7+ Person Families | 0 (0.0%) | $0 |
| Total | 422 (100.0%) | $62,762 |
Family Income by Number of Earners in Richland
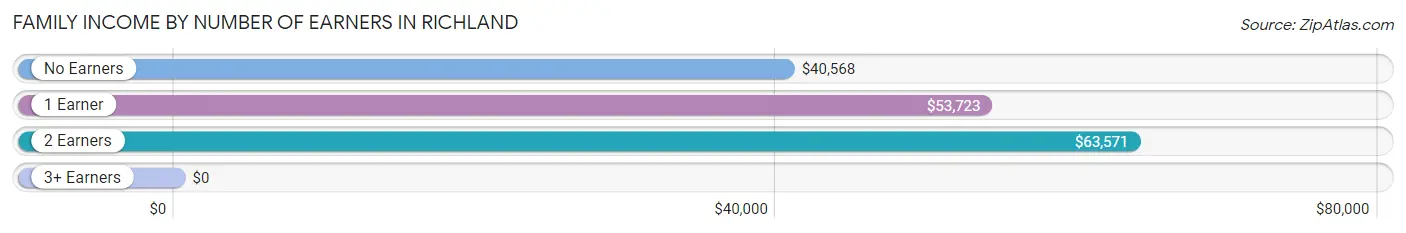
| Number of Earners | # Families | Median Income |
| No Earners | 41 (9.7%) | $40,568 |
| 1 Earner | 184 (43.6%) | $53,723 |
| 2 Earners | 194 (46.0%) | $63,571 |
| 3+ Earners | 3 (0.7%) | $0 |
| Total | 422 (100.0%) | $62,762 |
Household Income in Richland
Household Income Brackets in Richland
With 186 households falling in the category, the $50,000 to $74,999 income range is the most frequent in Richland, accounting for 28.7% of all households. In contrast, only 4 households (0.6%) fall into the $200,000+ income bracket, making it the least populous group.
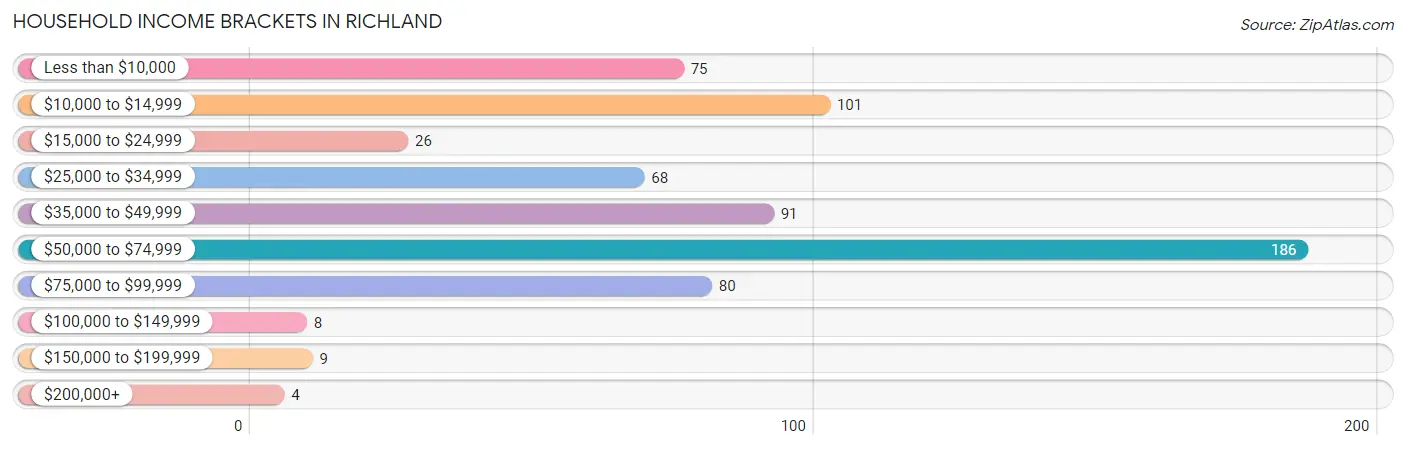
| Income Bracket | # Households | % Households |
| Less than $10,000 | 75 | 11.6% |
| $10,000 to $14,999 | 101 | 15.6% |
| $15,000 to $24,999 | 26 | 4.0% |
| $25,000 to $34,999 | 68 | 10.5% |
| $35,000 to $49,999 | 91 | 14.0% |
| $50,000 to $74,999 | 186 | 28.7% |
| $75,000 to $99,999 | 80 | 12.3% |
| $100,000 to $149,999 | 8 | 1.2% |
| $150,000 to $199,999 | 9 | 1.4% |
| $200,000+ | 4 | 0.6% |
Household Income by Householder Age in Richland
The median household income in Richland is $41,458, with the highest median household income of $62,561 found in the 25 to 44 years age bracket for the primary householder. A total of 357 households (55.1%) fall into this category. Meanwhile, the 15 to 24 years age bracket for the primary householder has the lowest median household income of $0, with 52 households (8.0%) in this group.
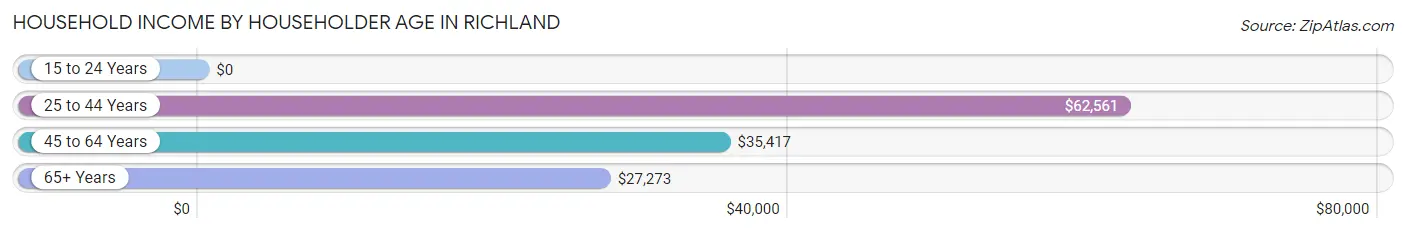
| Income Bracket | # Households | Median Income |
| 15 to 24 Years | 52 (8.0%) | $0 |
| 25 to 44 Years | 357 (55.1%) | $62,561 |
| 45 to 64 Years | 115 (17.7%) | $35,417 |
| 65+ Years | 124 (19.1%) | $27,273 |
| Total | 648 (100.0%) | $41,458 |
Poverty in Richland
Income Below Poverty by Sex and Age in Richland
With 22.7% poverty level for males and 13.4% for females among the residents of Richland, 18 to 24 year old males and 55 to 64 year old females are the most vulnerable to poverty, with 50 males (80.6%) and 15 females (31.9%) in their respective age groups living below the poverty level.
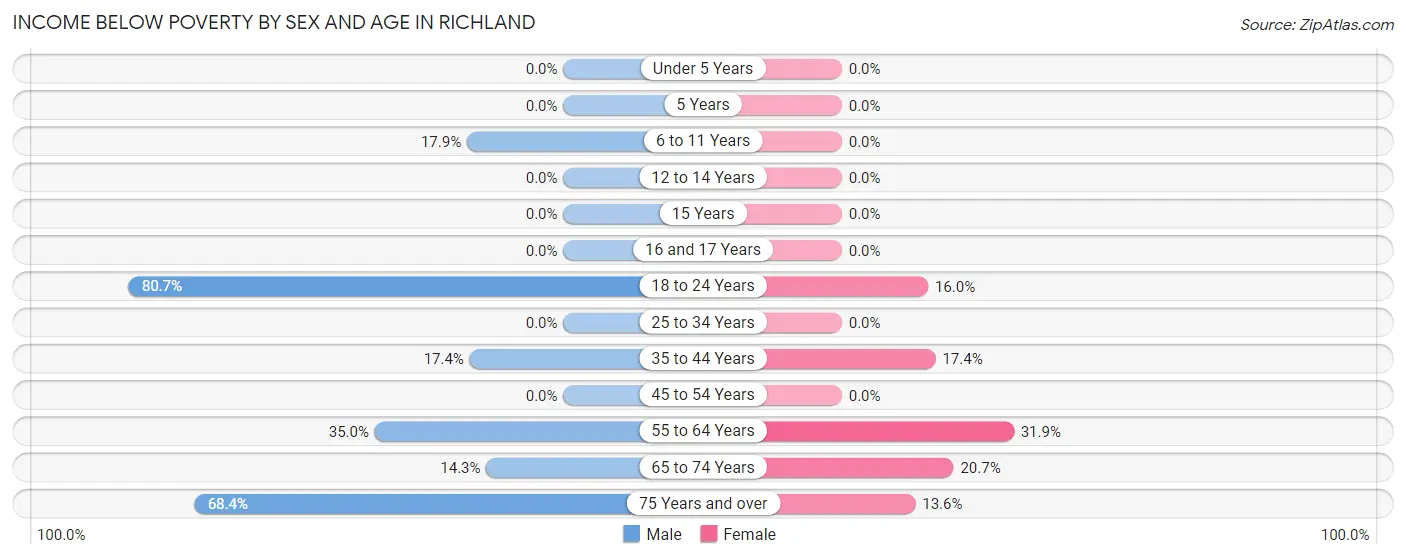
| Age Bracket | Male | Female |
| Under 5 Years | 0 (0.0%) | 0 (0.0%) |
| 5 Years | 0 (0.0%) | 0 (0.0%) |
| 6 to 11 Years | 17 (17.9%) | 0 (0.0%) |
| 12 to 14 Years | 0 (0.0%) | 0 (0.0%) |
| 15 Years | 0 (0.0%) | 0 (0.0%) |
| 16 and 17 Years | 0 (0.0%) | 0 (0.0%) |
| 18 to 24 Years | 50 (80.6%) | 4 (16.0%) |
| 25 to 34 Years | 0 (0.0%) | 0 (0.0%) |
| 35 to 44 Years | 53 (17.4%) | 16 (17.4%) |
| 45 to 54 Years | 0 (0.0%) | 0 (0.0%) |
| 55 to 64 Years | 21 (35.0%) | 15 (31.9%) |
| 65 to 74 Years | 3 (14.3%) | 17 (20.7%) |
| 75 Years and over | 13 (68.4%) | 9 (13.6%) |
| Total | 157 (22.7%) | 61 (13.4%) |
Income Above Poverty by Sex and Age in Richland
According to the poverty statistics in Richland, males aged under 5 years and females aged under 5 years are the age groups that are most secure financially, with 100.0% of males and 100.0% of females in these age groups living above the poverty line.
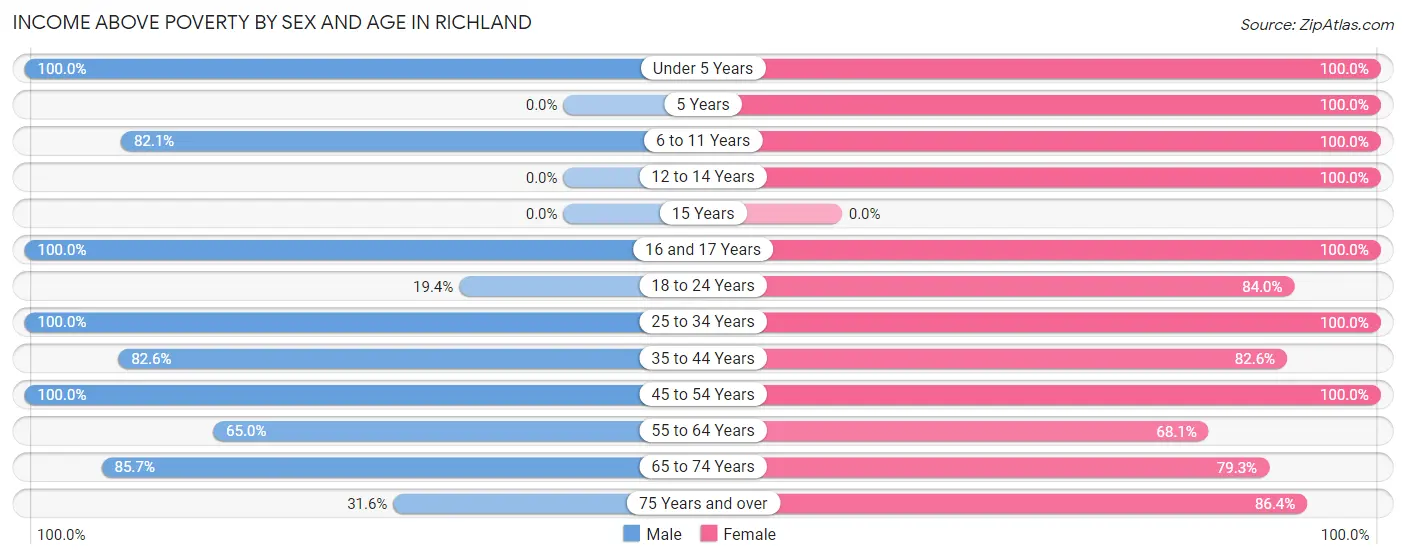
| Age Bracket | Male | Female |
| Under 5 Years | 4 (100.0%) | 19 (100.0%) |
| 5 Years | 0 (0.0%) | 17 (100.0%) |
| 6 to 11 Years | 78 (82.1%) | 24 (100.0%) |
| 12 to 14 Years | 0 (0.0%) | 3 (100.0%) |
| 15 Years | 0 (0.0%) | 0 (0.0%) |
| 16 and 17 Years | 16 (100.0%) | 9 (100.0%) |
| 18 to 24 Years | 12 (19.4%) | 21 (84.0%) |
| 25 to 34 Years | 86 (100.0%) | 40 (100.0%) |
| 35 to 44 Years | 252 (82.6%) | 76 (82.6%) |
| 45 to 54 Years | 24 (100.0%) | 31 (100.0%) |
| 55 to 64 Years | 39 (65.0%) | 32 (68.1%) |
| 65 to 74 Years | 18 (85.7%) | 65 (79.3%) |
| 75 Years and over | 6 (31.6%) | 57 (86.4%) |
| Total | 535 (77.3%) | 394 (86.6%) |
Income Below Poverty Among Married-Couple Families in Richland
The poverty statistics for married-couple families in Richland show that 0.9% or 2 of the total 223 families live below the poverty line. Families with no children have the highest poverty rate of 1.1%, comprising of 2 families. On the other hand, families with 1 or 2 children have the lowest poverty rate of 0.0%, which includes 0 families.
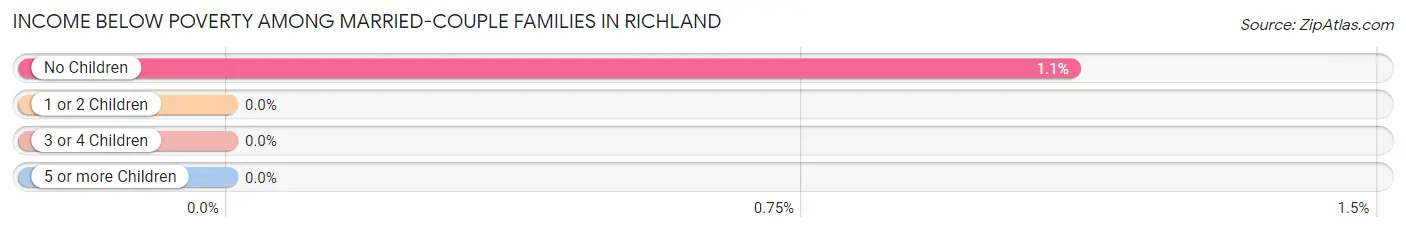
| Children | Above Poverty | Below Poverty |
| No Children | 180 (98.9%) | 2 (1.1%) |
| 1 or 2 Children | 22 (100.0%) | 0 (0.0%) |
| 3 or 4 Children | 19 (100.0%) | 0 (0.0%) |
| 5 or more Children | 0 (0.0%) | 0 (0.0%) |
| Total | 221 (99.1%) | 2 (0.9%) |
Income Below Poverty Among Single-Parent Households in Richland
According to the poverty data in Richland, 2.8% or 3 single-father households and 20.6% or 19 single-mother households are living below the poverty line. Among single-father households, those with no children have the highest poverty rate, with 3 households (6.0%) experiencing poverty. Likewise, among single-mother households, those with 1 or 2 children have the highest poverty rate, with 16 households (55.2%) falling below the poverty line.
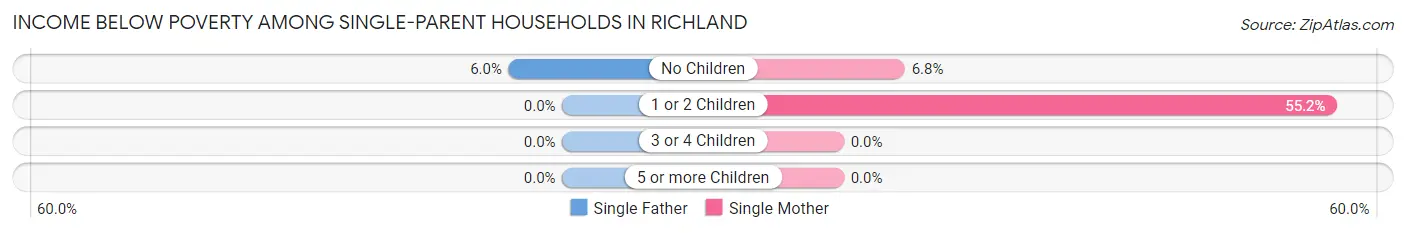
| Children | Single Father | Single Mother |
| No Children | 3 (6.0%) | 3 (6.8%) |
| 1 or 2 Children | 0 (0.0%) | 16 (55.2%) |
| 3 or 4 Children | 0 (0.0%) | 0 (0.0%) |
| 5 or more Children | 0 (0.0%) | 0 (0.0%) |
| Total | 3 (2.8%) | 19 (20.6%) |
Income Below Poverty Among Married-Couple vs Single-Parent Households in Richland
The poverty data for Richland shows that 2 of the married-couple family households (0.9%) and 22 of the single-parent households (11.1%) are living below the poverty level. Within the married-couple family households, those with no children have the highest poverty rate, with 2 households (1.1%) falling below the poverty line. Among the single-parent households, those with 1 or 2 children have the highest poverty rate, with 16 household (18.6%) living below poverty.
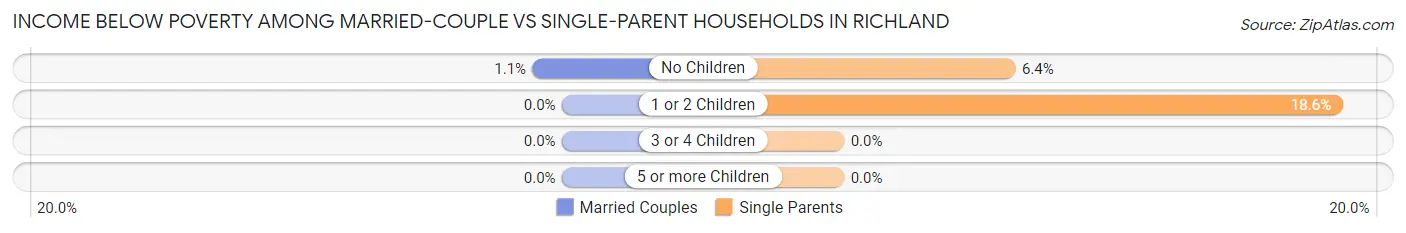
| Children | Married-Couple Families | Single-Parent Households |
| No Children | 2 (1.1%) | 6 (6.4%) |
| 1 or 2 Children | 0 (0.0%) | 16 (18.6%) |
| 3 or 4 Children | 0 (0.0%) | 0 (0.0%) |
| 5 or more Children | 0 (0.0%) | 0 (0.0%) |
| Total | 2 (0.9%) | 22 (11.1%) |
Race in Richland
The most populous races in Richland are Black / African American (923 | 71.6%), White / Caucasian (306 | 23.7%), and Asian (61 | 4.7%).
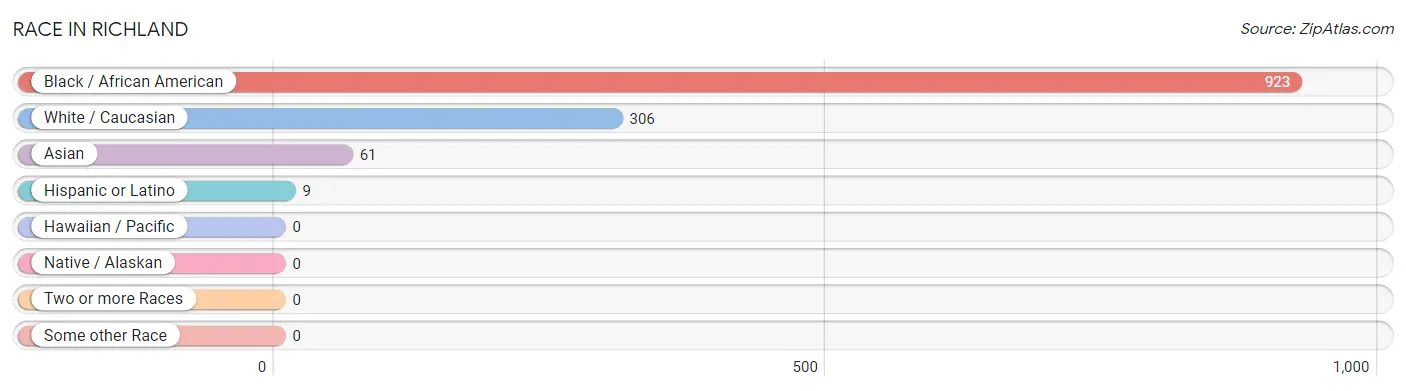
| Race | # Population | % Population |
| Asian | 61 | 4.7% |
| Black / African American | 923 | 71.6% |
| Hawaiian / Pacific | 0 | 0.0% |
| Hispanic or Latino | 9 | 0.7% |
| Native / Alaskan | 0 | 0.0% |
| White / Caucasian | 306 | 23.7% |
| Two or more Races | 0 | 0.0% |
| Some other Race | 0 | 0.0% |
| Total | 1,290 | 100.0% |
Ancestry in Richland
The most populous ancestries reported in Richland are American (114 | 8.8%), English (70 | 5.4%), Korean (61 | 4.7%), German (28 | 2.2%), and Irish (27 | 2.1%), together accounting for 23.3% of all Richland residents.
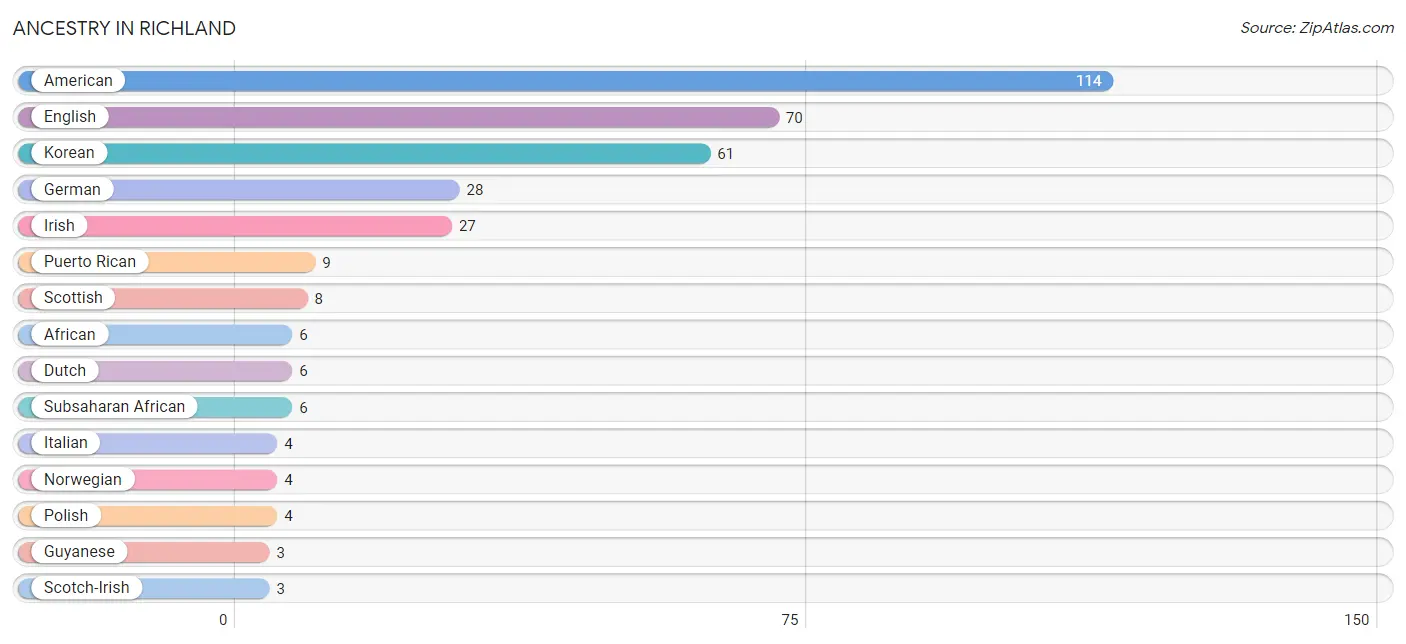
| Ancestry | # Population | % Population |
| African | 6 | 0.5% |
| American | 114 | 8.8% |
| Dutch | 6 | 0.5% |
| English | 70 | 5.4% |
| French | 1 | 0.1% |
| French Canadian | 2 | 0.2% |
| German | 28 | 2.2% |
| Guyanese | 3 | 0.2% |
| Irish | 27 | 2.1% |
| Italian | 4 | 0.3% |
| Korean | 61 | 4.7% |
| Lithuanian | 2 | 0.2% |
| Norwegian | 4 | 0.3% |
| Polish | 4 | 0.3% |
| Puerto Rican | 9 | 0.7% |
| Scotch-Irish | 3 | 0.2% |
| Scottish | 8 | 0.6% |
| Subsaharan African | 6 | 0.5% | View All 18 Rows |
Immigrants in Richland
The most numerous immigrant groups reported in Richland came from Asia (14 | 1.1%), Philippines (14 | 1.1%), South Eastern Asia (14 | 1.1%), Guyana (3 | 0.2%), and Latin America (3 | 0.2%), together accounting for 3.7% of all Richland residents.
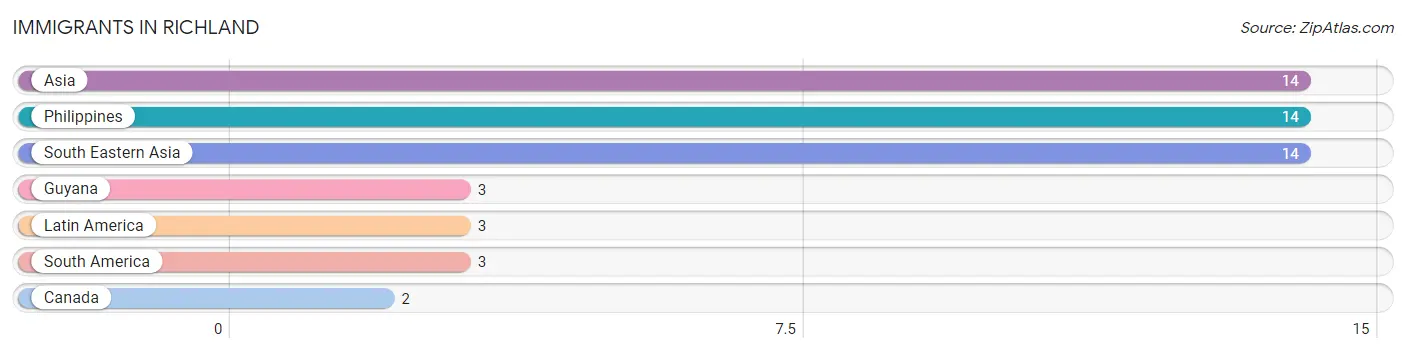
| Immigration Origin | # Population | % Population |
| Asia | 14 | 1.1% |
| Canada | 2 | 0.2% |
| Guyana | 3 | 0.2% |
| Latin America | 3 | 0.2% |
| Philippines | 14 | 1.1% |
| South America | 3 | 0.2% |
| South Eastern Asia | 14 | 1.1% | View All 7 Rows |
Sex and Age in Richland
Sex and Age in Richland
The most populous age groups in Richland are 35 to 39 Years (220 | 30.0%) for men and 85 Years and over (79 | 14.2%) for women.
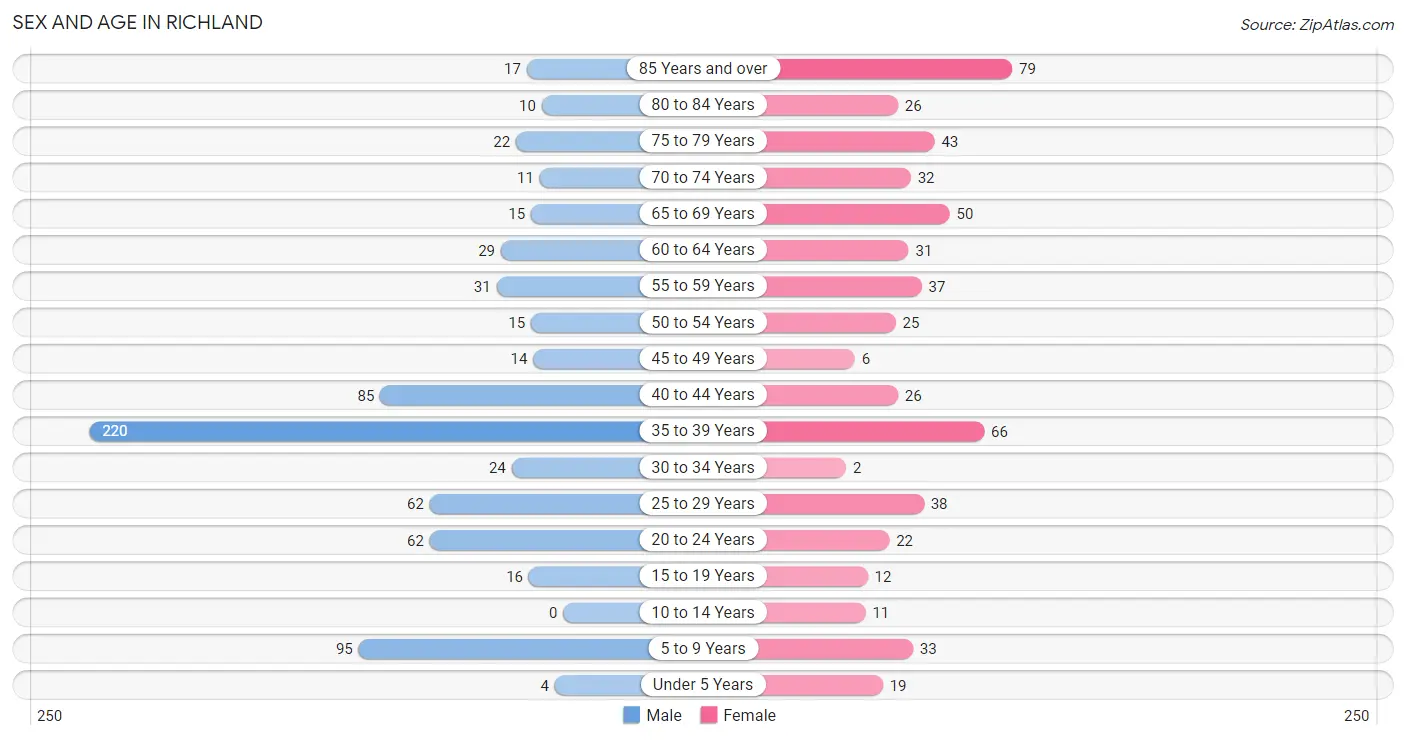
| Age Bracket | Male | Female |
| Under 5 Years | 4 (0.5%) | 19 (3.4%) |
| 5 to 9 Years | 95 (13.0%) | 33 (5.9%) |
| 10 to 14 Years | 0 (0.0%) | 11 (2.0%) |
| 15 to 19 Years | 16 (2.2%) | 12 (2.1%) |
| 20 to 24 Years | 62 (8.5%) | 22 (3.9%) |
| 25 to 29 Years | 62 (8.5%) | 38 (6.8%) |
| 30 to 34 Years | 24 (3.3%) | 2 (0.4%) |
| 35 to 39 Years | 220 (30.0%) | 66 (11.8%) |
| 40 to 44 Years | 85 (11.6%) | 26 (4.7%) |
| 45 to 49 Years | 14 (1.9%) | 6 (1.1%) |
| 50 to 54 Years | 15 (2.1%) | 25 (4.5%) |
| 55 to 59 Years | 31 (4.2%) | 37 (6.6%) |
| 60 to 64 Years | 29 (4.0%) | 31 (5.6%) |
| 65 to 69 Years | 15 (2.1%) | 50 (9.0%) |
| 70 to 74 Years | 11 (1.5%) | 32 (5.7%) |
| 75 to 79 Years | 22 (3.0%) | 43 (7.7%) |
| 80 to 84 Years | 10 (1.4%) | 26 (4.7%) |
| 85 Years and over | 17 (2.3%) | 79 (14.2%) |
| Total | 732 (100.0%) | 558 (100.0%) |
Families and Households in Richland
Median Family Size in Richland
The median family size in Richland is 2.18 persons per family, with single female/mother families (92 | 21.8%) accounting for the largest median family size of 3.73 persons per family. On the other hand, single male/father families (107 | 25.4%) represent the smallest median family size with 1.25 persons per family.
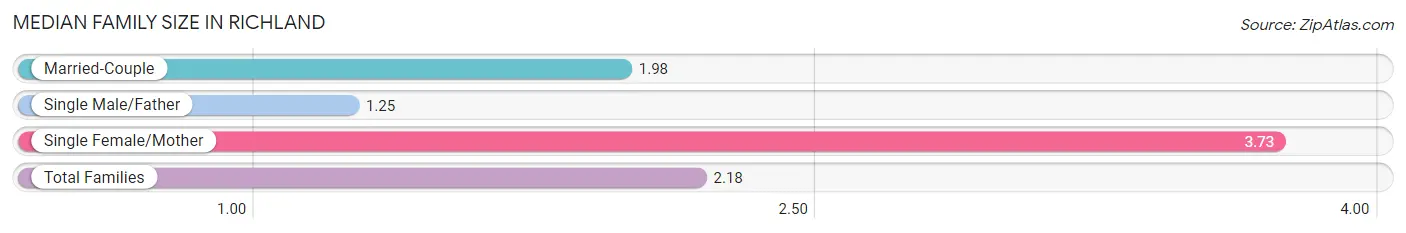
| Family Type | # Families | Family Size |
| Married-Couple | 223 (52.8%) | 1.98 |
| Single Male/Father | 107 (25.4%) | 1.25 |
| Single Female/Mother | 92 (21.8%) | 3.73 |
| Total Families | 422 (100.0%) | 2.18 |
Median Household Size in Richland
The median household size in Richland is 1.77 persons per household, with single female/mother households (92 | 14.2%) accounting for the largest median household size of 3.73 persons per household. non-family households (226 | 34.9%) represent the smallest median household size with 1.01 persons per household.
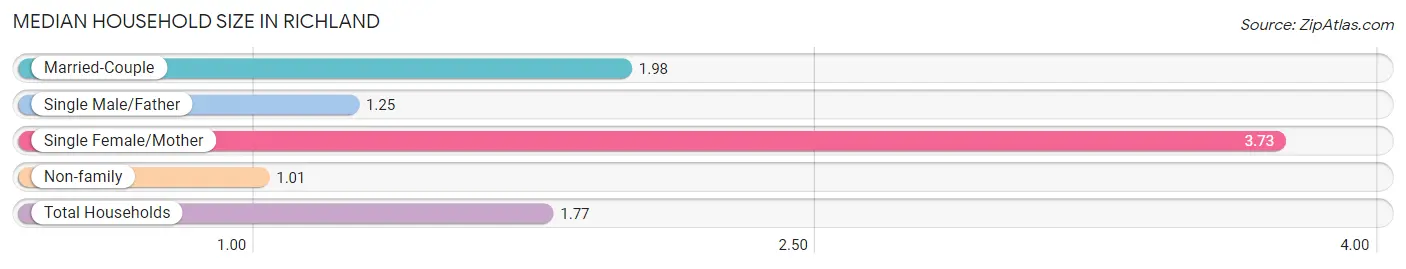
| Household Type | # Households | Household Size |
| Married-Couple | 223 (34.4%) | 1.98 |
| Single Male/Father | 107 (16.5%) | 1.25 |
| Single Female/Mother | 92 (14.2%) | 3.73 |
| Non-family | 226 (34.9%) | 1.01 |
| Total Households | 648 (100.0%) | 1.77 |
Household Size by Marriage Status in Richland
Out of a total of 648 households in Richland, 422 (65.1%) are family households, while 226 (34.9%) are nonfamily households. The most numerous type of family households are 2-person households, comprising 316, and the most common type of nonfamily households are 1-person households, comprising 210.
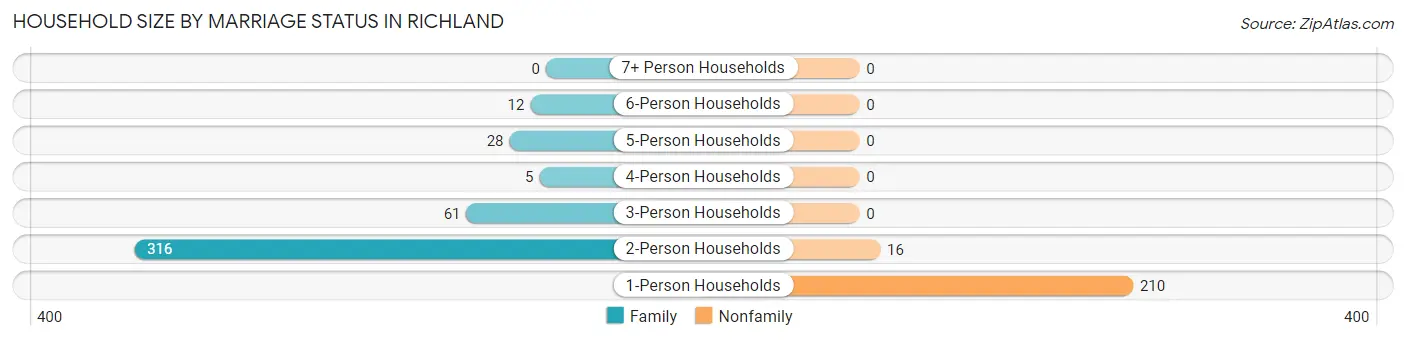
| Household Size | Family Households | Nonfamily Households |
| 1-Person Households | - | 210 (32.4%) |
| 2-Person Households | 316 (48.8%) | 16 (2.5%) |
| 3-Person Households | 61 (9.4%) | 0 (0.0%) |
| 4-Person Households | 5 (0.8%) | 0 (0.0%) |
| 5-Person Households | 28 (4.3%) | 0 (0.0%) |
| 6-Person Households | 12 (1.8%) | 0 (0.0%) |
| 7+ Person Households | 0 (0.0%) | 0 (0.0%) |
| Total | 422 (65.1%) | 226 (34.9%) |
Female Fertility in Richland
Fertility by Age in Richland
Average fertility rate in Richland is 87.0 births per 1,000 women. Women in the age bracket of 20 to 34 years have the highest fertility rate with 242.0 births per 1,000 women. Women in the age bracket of 20 to 34 years acount for 100.0% of all women with births.
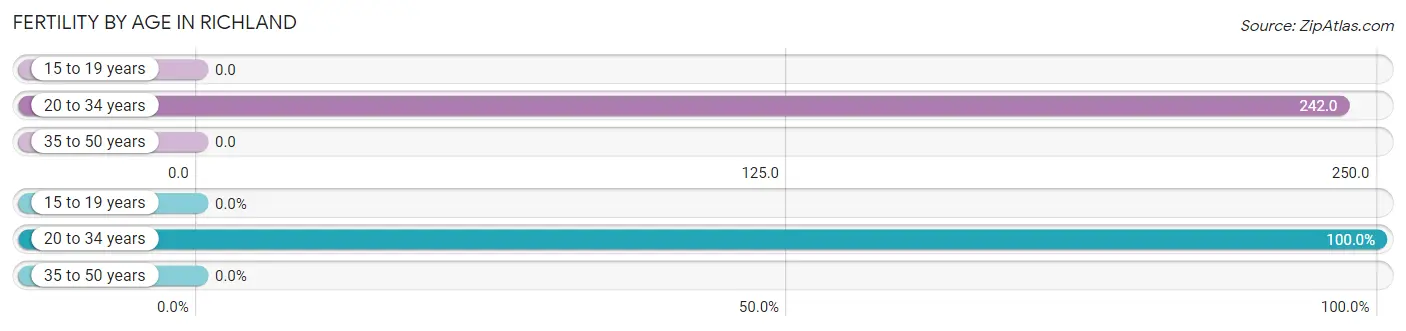
| Age Bracket | Women with Births | Births / 1,000 Women |
| 15 to 19 years | 0 (0.0%) | 0.0 |
| 20 to 34 years | 15 (100.0%) | 242.0 |
| 35 to 50 years | 0 (0.0%) | 0.0 |
| Total | 15 (100.0%) | 87.0 |
Fertility by Age by Marriage Status in Richland
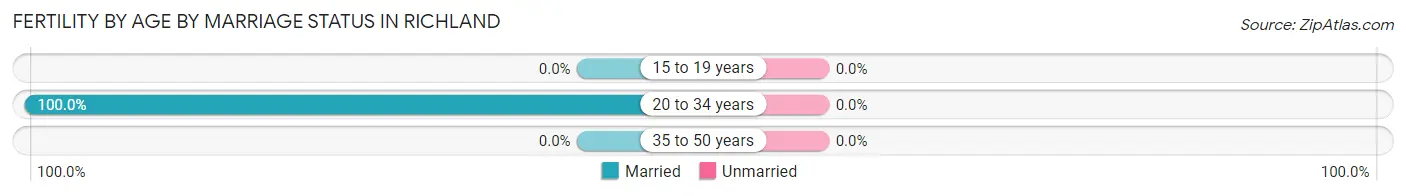
| Age Bracket | Married | Unmarried |
| 15 to 19 years | 0 (0.0%) | 0 (0.0%) |
| 20 to 34 years | 15 (100.0%) | 0 (0.0%) |
| 35 to 50 years | 0 (0.0%) | 0 (0.0%) |
| Total | 15 (100.0%) | 0 (0.0%) |
Fertility by Education in Richland
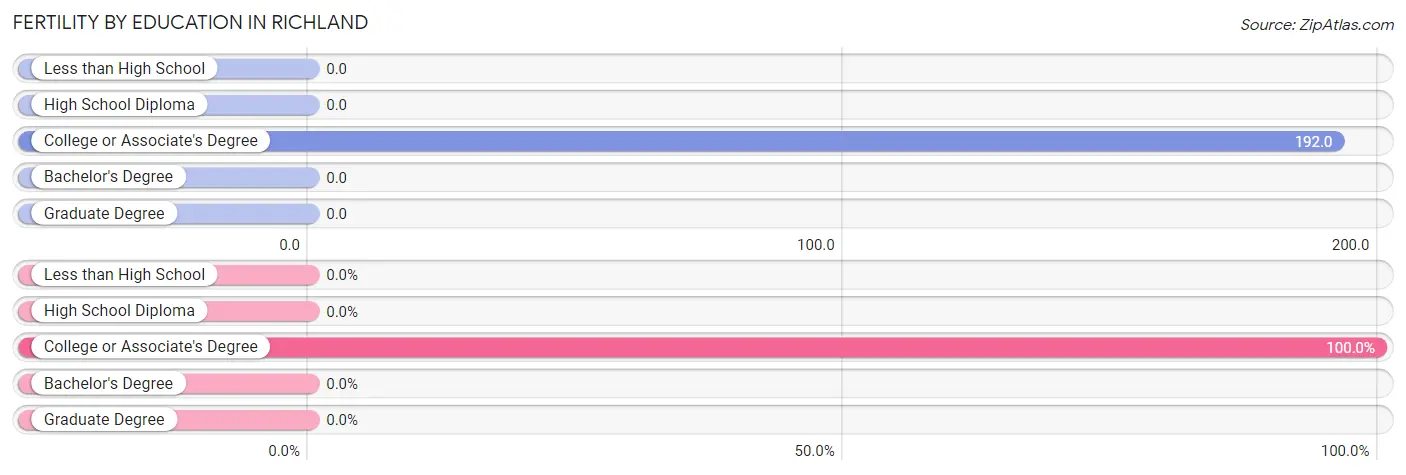
| Educational Attainment | Women with Births | Births / 1,000 Women |
| Less than High School | 0 (0.0%) | 0.0 |
| High School Diploma | 0 (0.0%) | 0.0 |
| College or Associate's Degree | 15 (100.0%) | 192.0 |
| Bachelor's Degree | 0 (0.0%) | 0.0 |
| Graduate Degree | 0 (0.0%) | 0.0 |
| Total | 15 (100.0%) | 87.0 |
Fertility by Education by Marriage Status in Richland
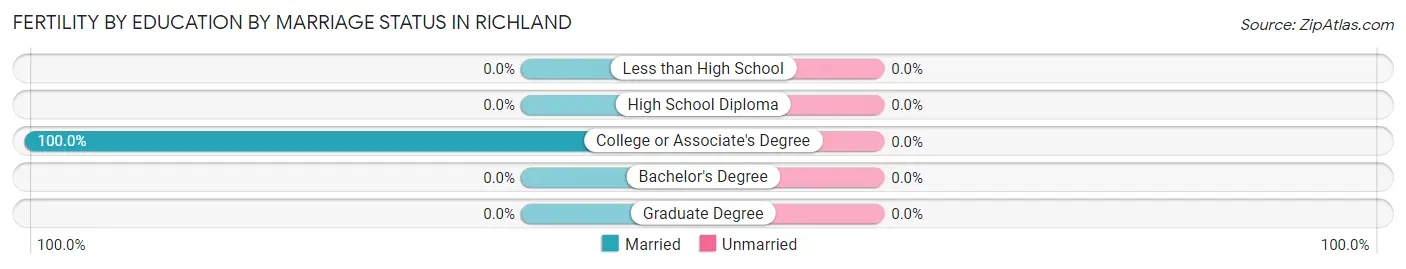
| Educational Attainment | Married | Unmarried |
| Less than High School | 0 (0.0%) | 0 (0.0%) |
| High School Diploma | 0 (0.0%) | 0 (0.0%) |
| College or Associate's Degree | 15 (100.0%) | 0 (0.0%) |
| Bachelor's Degree | 0 (0.0%) | 0 (0.0%) |
| Graduate Degree | 0 (0.0%) | 0 (0.0%) |
| Total | 15 (100.0%) | 0 (0.0%) |
Employment Characteristics in Richland
Employment by Class of Employer in Richland
Among the 510 employed individuals in Richland, private company employees (373 | 73.1%), local government employees (68 | 13.3%), and federal government employees (33 | 6.5%) make up the most common classes of employment.
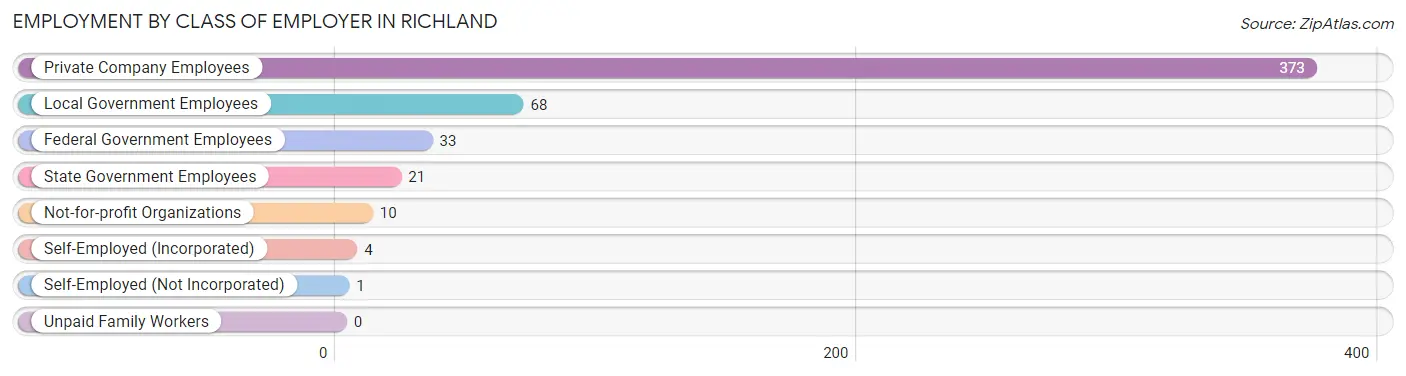
| Employer Class | # Employees | % Employees |
| Private Company Employees | 373 | 73.1% |
| Self-Employed (Incorporated) | 4 | 0.8% |
| Self-Employed (Not Incorporated) | 1 | 0.2% |
| Not-for-profit Organizations | 10 | 2.0% |
| Local Government Employees | 68 | 13.3% |
| State Government Employees | 21 | 4.1% |
| Federal Government Employees | 33 | 6.5% |
| Unpaid Family Workers | 0 | 0.0% |
| Total | 510 | 100.0% |
Employment Status by Age in Richland
According to the labor force statistics for Richland, out of the total population over 16 years of age (1,128), 50.4% or 569 individuals are in the labor force, with 5.4% or 31 of them unemployed. The age group with the highest labor force participation rate is 25 to 29 years, with 100.0% or 100 individuals in the labor force. Within the labor force, the 35 to 44 years age range has the highest percentage of unemployed individuals, with 7.9% or 25 of them being unemployed.
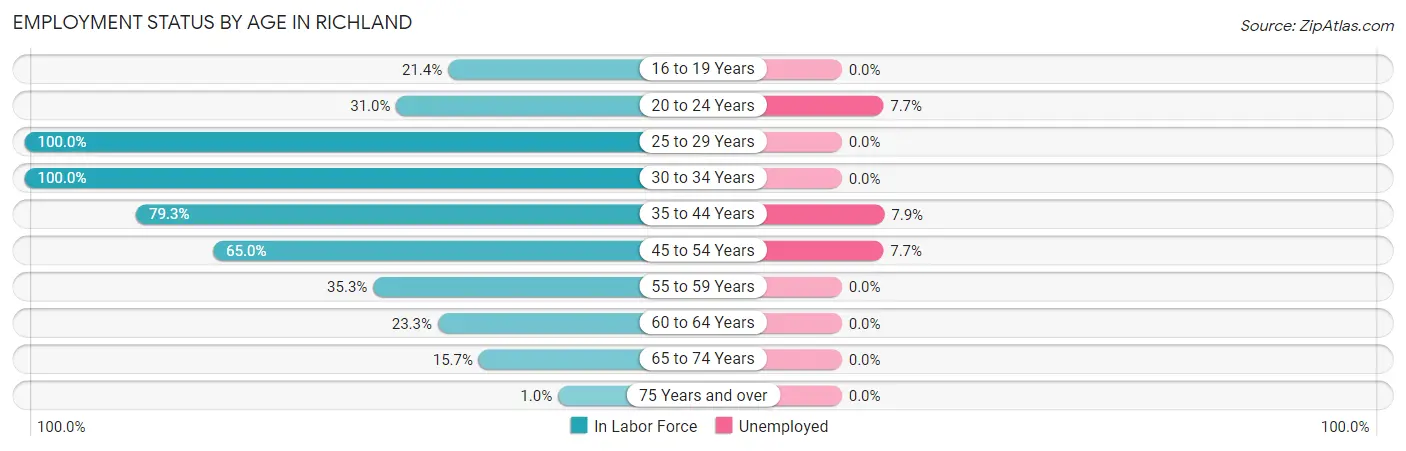
| Age Bracket | In Labor Force | Unemployed |
| 16 to 19 Years | 6 (21.4%) | 0 (0.0%) |
| 20 to 24 Years | 26 (31.0%) | 2 (7.7%) |
| 25 to 29 Years | 100 (100.0%) | 0 (0.0%) |
| 30 to 34 Years | 26 (100.0%) | 0 (0.0%) |
| 35 to 44 Years | 315 (79.3%) | 25 (7.9%) |
| 45 to 54 Years | 39 (65.0%) | 3 (7.7%) |
| 55 to 59 Years | 24 (35.3%) | 0 (0.0%) |
| 60 to 64 Years | 14 (23.3%) | 0 (0.0%) |
| 65 to 74 Years | 17 (15.7%) | 0 (0.0%) |
| 75 Years and over | 2 (1.0%) | 0 (0.0%) |
| Total | 569 (50.4%) | 31 (5.4%) |
Employment Status by Educational Attainment in Richland
According to labor force statistics for Richland, 72.9% of individuals (518) out of the total population between 25 and 64 years of age (711) are in the labor force, with 5.5% or 28 of them being unemployed. The group with the highest labor force participation rate are those with the educational attainment of bachelor's degree or higher, with 97.1% or 132 individuals in the labor force. Within the labor force, individuals with college / associate degree education have the highest percentage of unemployment, with 16.2% or 26 of them being unemployed.
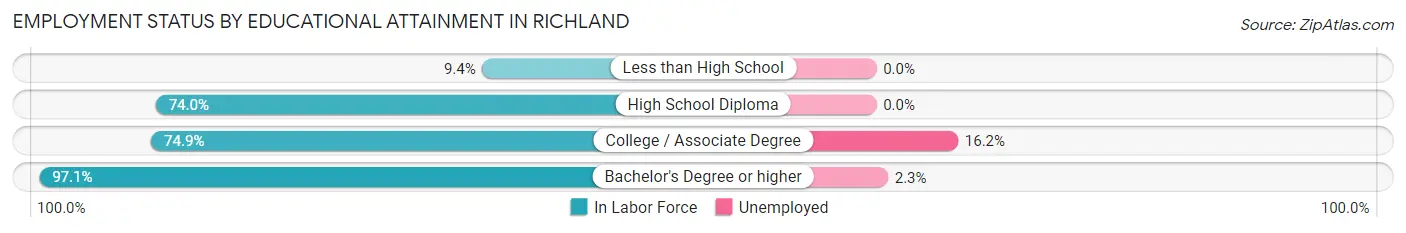
| Educational Attainment | In Labor Force | Unemployed |
| Less than High School | 6 (9.4%) | 0 (0.0%) |
| High School Diploma | 219 (74.0%) | 0 (0.0%) |
| College / Associate Degree | 161 (74.9%) | 35 (16.2%) |
| Bachelor's Degree or higher | 132 (97.1%) | 3 (2.3%) |
| Total | 518 (72.9%) | 39 (5.5%) |
Employment Occupations by Sex in Richland
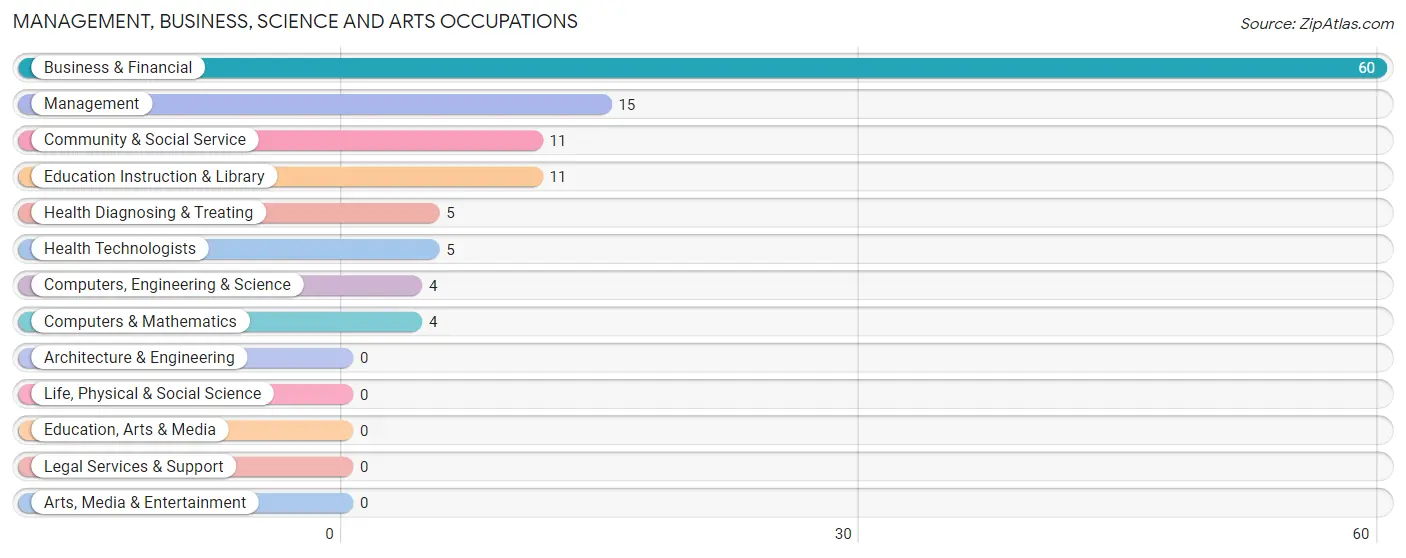
Management, Business, Science and Arts Occupations
The most common Management, Business, Science and Arts occupations in Richland are Business & Financial (60 | 11.3%), Management (15 | 2.8%), Community & Social Service (11 | 2.1%), Education Instruction & Library (11 | 2.1%), and Health Diagnosing & Treating (5 | 0.9%).
Management, Business, Science and Arts Occupations by Sex
Within the Management, Business, Science and Arts occupations in Richland, the most male-oriented occupations are Business & Financial (95.0%), Community & Social Service (45.5%), and Education Instruction & Library (45.5%), while the most female-oriented occupations are Management (100.0%), Computers, Engineering & Science (100.0%), and Computers & Mathematics (100.0%).
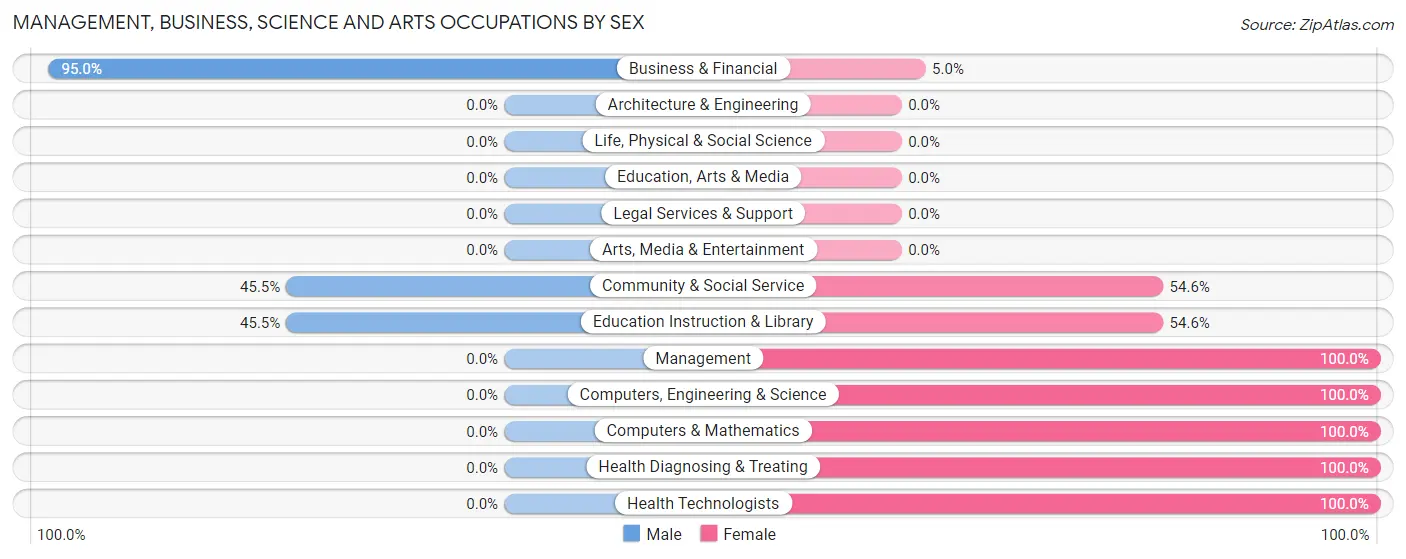
| Occupation | Male | Female |
| Management | 0 (0.0%) | 15 (100.0%) |
| Business & Financial | 57 (95.0%) | 3 (5.0%) |
| Computers, Engineering & Science | 0 (0.0%) | 4 (100.0%) |
| Computers & Mathematics | 0 (0.0%) | 4 (100.0%) |
| Architecture & Engineering | 0 (0.0%) | 0 (0.0%) |
| Life, Physical & Social Science | 0 (0.0%) | 0 (0.0%) |
| Community & Social Service | 5 (45.5%) | 6 (54.5%) |
| Education, Arts & Media | 0 (0.0%) | 0 (0.0%) |
| Legal Services & Support | 0 (0.0%) | 0 (0.0%) |
| Education Instruction & Library | 5 (45.5%) | 6 (54.5%) |
| Arts, Media & Entertainment | 0 (0.0%) | 0 (0.0%) |
| Health Diagnosing & Treating | 0 (0.0%) | 5 (100.0%) |
| Health Technologists | 0 (0.0%) | 5 (100.0%) |
| Total (Category) | 62 (65.3%) | 33 (34.7%) |
| Total (Overall) | 353 (66.6%) | 177 (33.4%) |
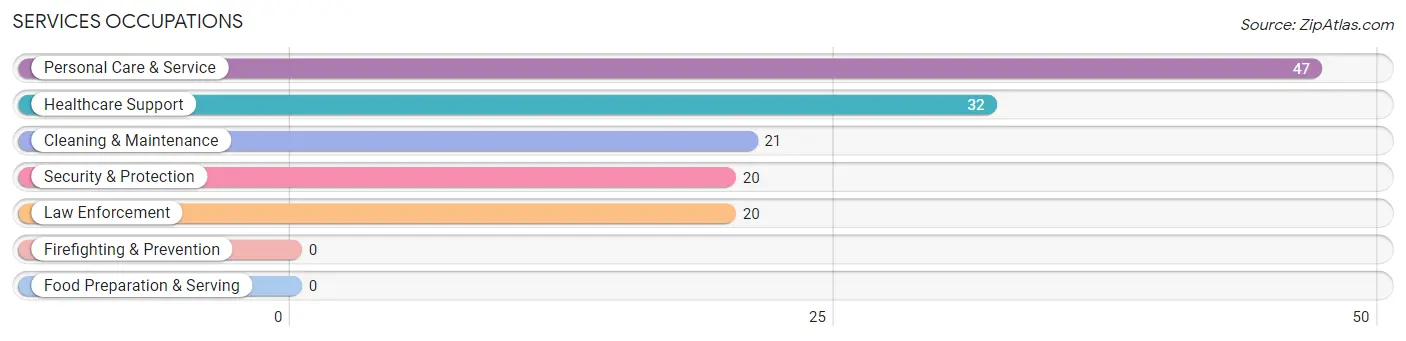
Services Occupations
The most common Services occupations in Richland are Personal Care & Service (47 | 8.9%), Healthcare Support (32 | 6.0%), Cleaning & Maintenance (21 | 4.0%), Security & Protection (20 | 3.8%), and Law Enforcement (20 | 3.8%).
Services Occupations by Sex
Within the Services occupations in Richland, the most male-oriented occupations are Personal Care & Service (100.0%), and Healthcare Support (3.1%), while the most female-oriented occupations are Security & Protection (100.0%), Law Enforcement (100.0%), and Cleaning & Maintenance (100.0%).
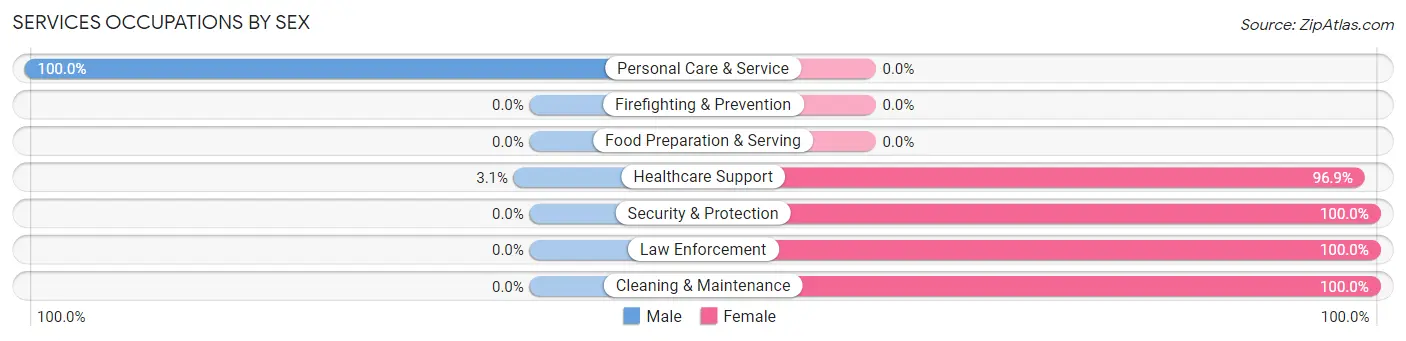
| Occupation | Male | Female |
| Healthcare Support | 1 (3.1%) | 31 (96.9%) |
| Security & Protection | 0 (0.0%) | 20 (100.0%) |
| Firefighting & Prevention | 0 (0.0%) | 0 (0.0%) |
| Law Enforcement | 0 (0.0%) | 20 (100.0%) |
| Food Preparation & Serving | 0 (0.0%) | 0 (0.0%) |
| Cleaning & Maintenance | 0 (0.0%) | 21 (100.0%) |
| Personal Care & Service | 47 (100.0%) | 0 (0.0%) |
| Total (Category) | 48 (40.0%) | 72 (60.0%) |
| Total (Overall) | 353 (66.6%) | 177 (33.4%) |
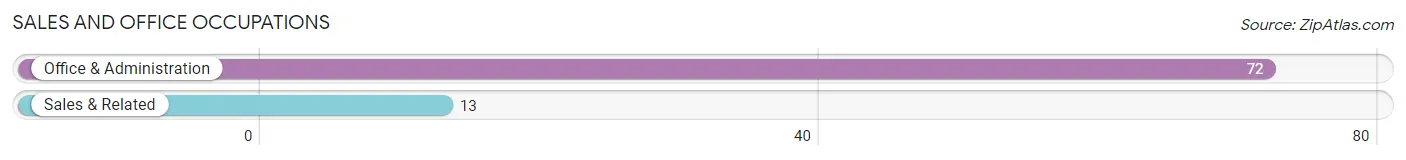
Sales and Office Occupations
The most common Sales and Office occupations in Richland are Office & Administration (72 | 13.6%), and Sales & Related (13 | 2.5%).
Sales and Office Occupations by Sex
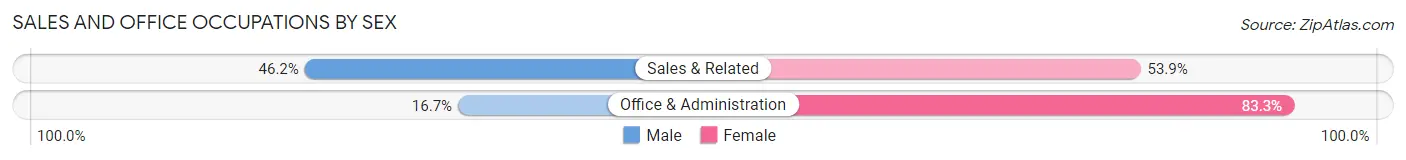
| Occupation | Male | Female |
| Sales & Related | 6 (46.2%) | 7 (53.8%) |
| Office & Administration | 12 (16.7%) | 60 (83.3%) |
| Total (Category) | 18 (21.2%) | 67 (78.8%) |
| Total (Overall) | 353 (66.6%) | 177 (33.4%) |
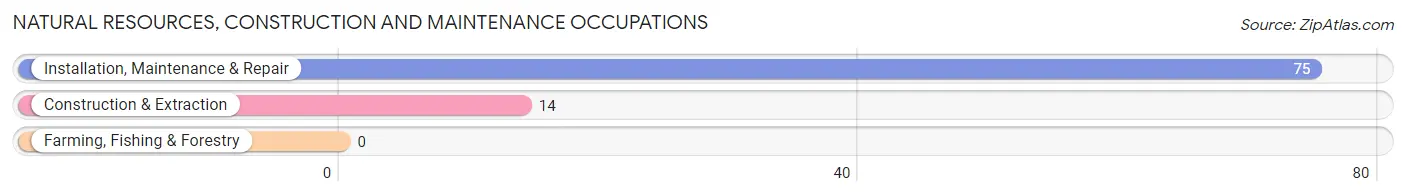
Natural Resources, Construction and Maintenance Occupations
The most common Natural Resources, Construction and Maintenance occupations in Richland are Installation, Maintenance & Repair (75 | 14.1%), and Construction & Extraction (14 | 2.6%).
Natural Resources, Construction and Maintenance Occupations by Sex
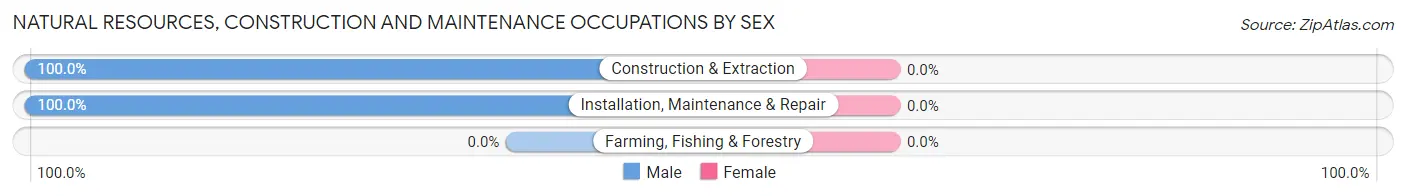
| Occupation | Male | Female |
| Farming, Fishing & Forestry | 0 (0.0%) | 0 (0.0%) |
| Construction & Extraction | 14 (100.0%) | 0 (0.0%) |
| Installation, Maintenance & Repair | 75 (100.0%) | 0 (0.0%) |
| Total (Category) | 89 (100.0%) | 0 (0.0%) |
| Total (Overall) | 353 (66.6%) | 177 (33.4%) |
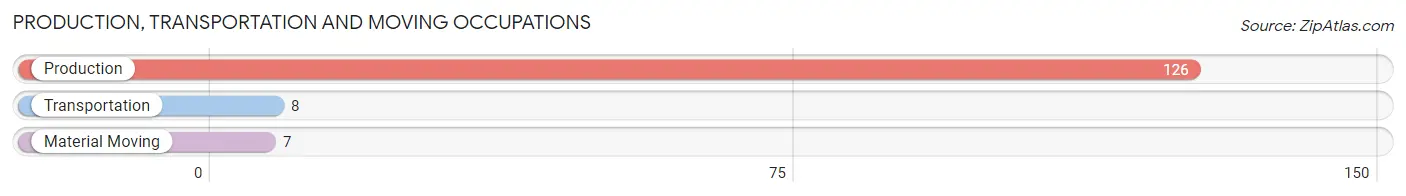
Production, Transportation and Moving Occupations
The most common Production, Transportation and Moving occupations in Richland are Production (126 | 23.8%), Transportation (8 | 1.5%), and Material Moving (7 | 1.3%).
Production, Transportation and Moving Occupations by Sex
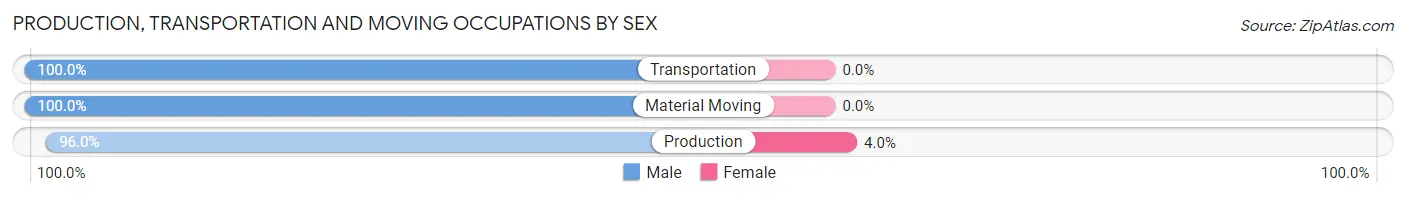
| Occupation | Male | Female |
| Production | 121 (96.0%) | 5 (4.0%) |
| Transportation | 8 (100.0%) | 0 (0.0%) |
| Material Moving | 7 (100.0%) | 0 (0.0%) |
| Total (Category) | 136 (96.5%) | 5 (3.5%) |
| Total (Overall) | 353 (66.6%) | 177 (33.4%) |
Employment Industries by Sex in Richland
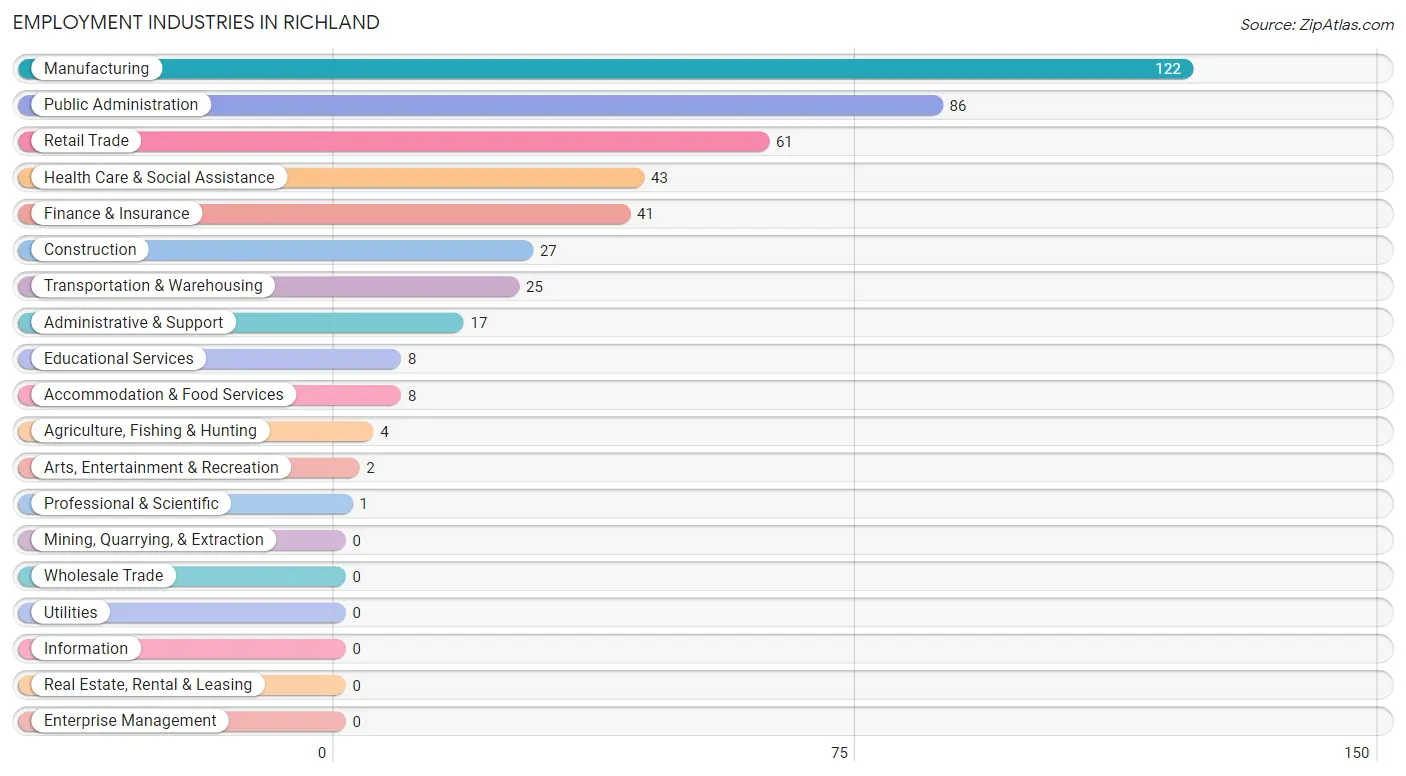
Employment Industries in Richland
The major employment industries in Richland include Manufacturing (122 | 23.0%), Public Administration (86 | 16.2%), Retail Trade (61 | 11.5%), Health Care & Social Assistance (43 | 8.1%), and Finance & Insurance (41 | 7.7%).
Employment Industries by Sex in Richland
The Richland industries that see more men than women are Agriculture, Fishing & Hunting (100.0%), Construction (100.0%), and Transportation & Warehousing (100.0%), whereas the industries that tend to have a higher number of women are Professional & Scientific (100.0%), Administrative & Support (100.0%), and Educational Services (100.0%).
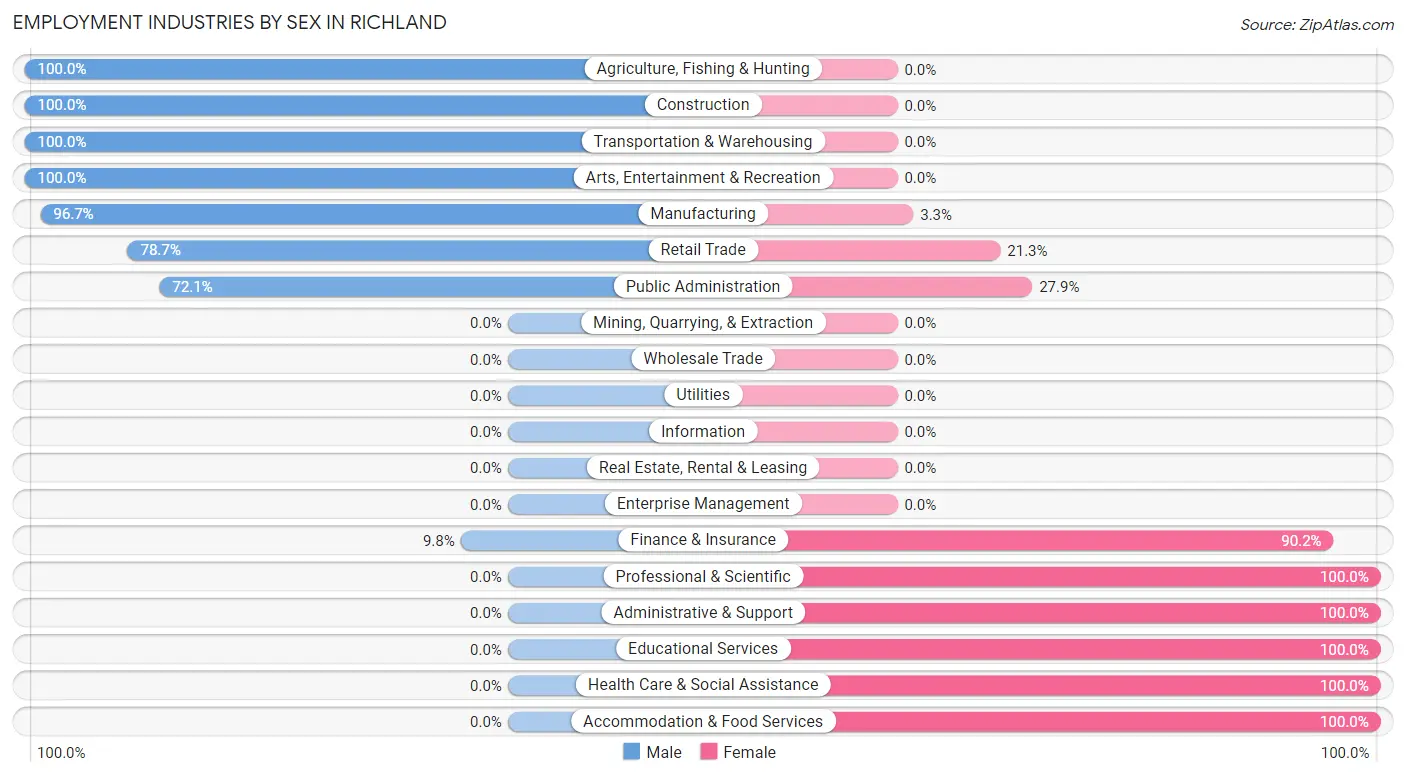
| Industry | Male | Female |
| Agriculture, Fishing & Hunting | 4 (100.0%) | 0 (0.0%) |
| Mining, Quarrying, & Extraction | 0 (0.0%) | 0 (0.0%) |
| Construction | 27 (100.0%) | 0 (0.0%) |
| Manufacturing | 118 (96.7%) | 4 (3.3%) |
| Wholesale Trade | 0 (0.0%) | 0 (0.0%) |
| Retail Trade | 48 (78.7%) | 13 (21.3%) |
| Transportation & Warehousing | 25 (100.0%) | 0 (0.0%) |
| Utilities | 0 (0.0%) | 0 (0.0%) |
| Information | 0 (0.0%) | 0 (0.0%) |
| Finance & Insurance | 4 (9.8%) | 37 (90.2%) |
| Real Estate, Rental & Leasing | 0 (0.0%) | 0 (0.0%) |
| Professional & Scientific | 0 (0.0%) | 1 (100.0%) |
| Enterprise Management | 0 (0.0%) | 0 (0.0%) |
| Administrative & Support | 0 (0.0%) | 17 (100.0%) |
| Educational Services | 0 (0.0%) | 8 (100.0%) |
| Health Care & Social Assistance | 0 (0.0%) | 43 (100.0%) |
| Arts, Entertainment & Recreation | 2 (100.0%) | 0 (0.0%) |
| Accommodation & Food Services | 0 (0.0%) | 8 (100.0%) |
| Public Administration | 62 (72.1%) | 24 (27.9%) |
| Total | 353 (66.6%) | 177 (33.4%) |
Education in Richland
School Enrollment in Richland
The most common levels of schooling among the 238 students in Richland are elementary school (107 | 45.0%), college / undergraduate (91 | 38.2%), and high school (25 | 10.5%).
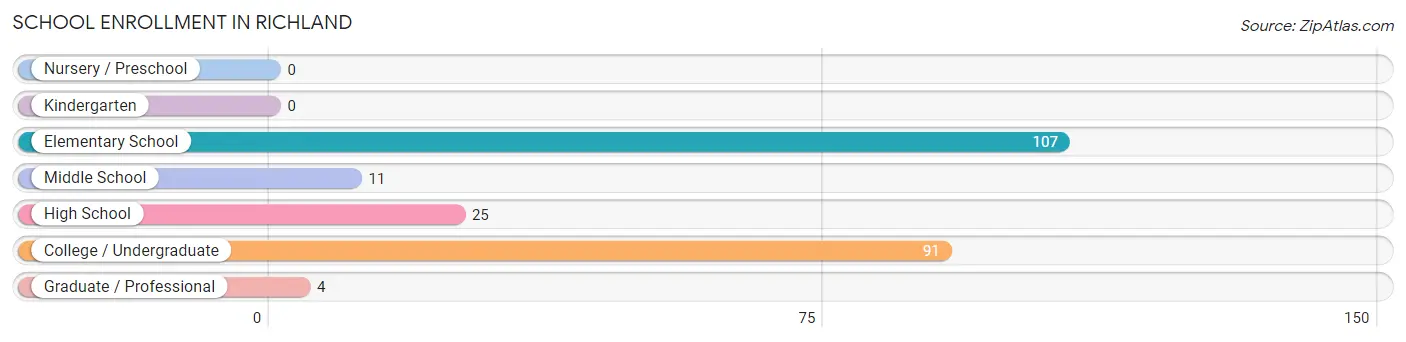
| School Level | # Students | % Students |
| Nursery / Preschool | 0 | 0.0% |
| Kindergarten | 0 | 0.0% |
| Elementary School | 107 | 45.0% |
| Middle School | 11 | 4.6% |
| High School | 25 | 10.5% |
| College / Undergraduate | 91 | 38.2% |
| Graduate / Professional | 4 | 1.7% |
| Total | 238 | 100.0% |
School Enrollment by Age by Funding Source in Richland
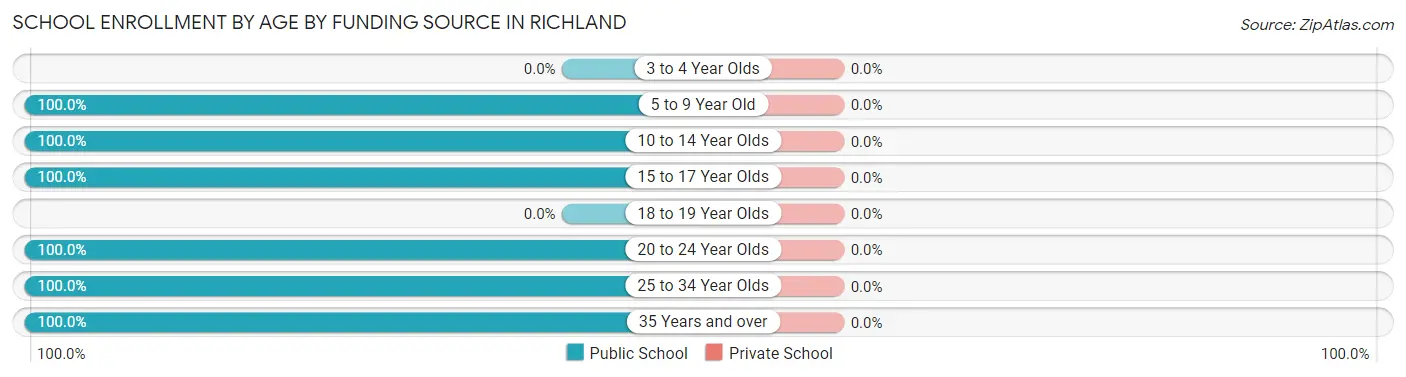
| Age Bracket | Public School | Private School |
| 3 to 4 Year Olds | 0 (0.0%) | 0 (0.0%) |
| 5 to 9 Year Old | 107 (100.0%) | 0 (0.0%) |
| 10 to 14 Year Olds | 11 (100.0%) | 0 (0.0%) |
| 15 to 17 Year Olds | 25 (100.0%) | 0 (0.0%) |
| 18 to 19 Year Olds | 0 (0.0%) | 0 (0.0%) |
| 20 to 24 Year Olds | 6 (100.0%) | 0 (0.0%) |
| 25 to 34 Year Olds | 38 (100.0%) | 0 (0.0%) |
| 35 Years and over | 51 (100.0%) | 0 (0.0%) |
| Total | 238 (100.0%) | 0 (0.0%) |
Educational Attainment by Field of Study in Richland
Business (81 | 38.8%), arts & humanities (62 | 29.7%), education (27 | 12.9%), science & technology (21 | 10.1%), and psychology (14 | 6.7%) are the most common fields of study among 209 individuals in Richland who have obtained a bachelor's degree or higher.
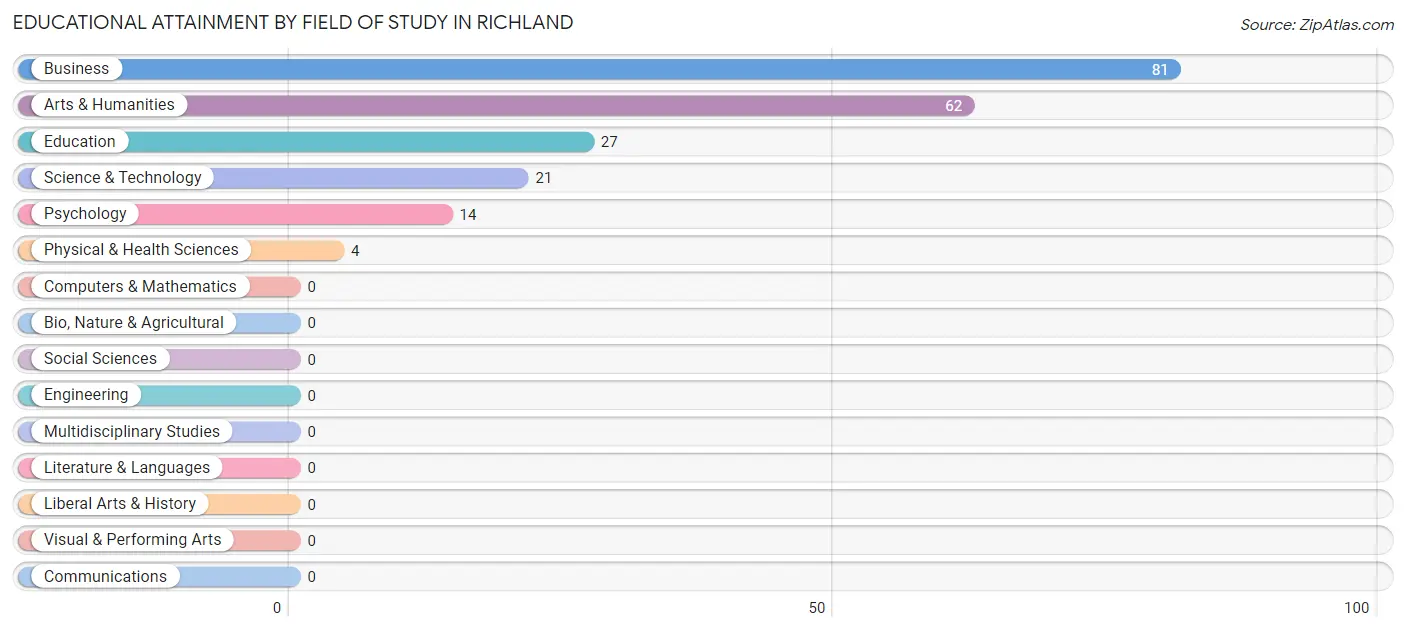
| Field of Study | # Graduates | % Graduates |
| Computers & Mathematics | 0 | 0.0% |
| Bio, Nature & Agricultural | 0 | 0.0% |
| Physical & Health Sciences | 4 | 1.9% |
| Psychology | 14 | 6.7% |
| Social Sciences | 0 | 0.0% |
| Engineering | 0 | 0.0% |
| Multidisciplinary Studies | 0 | 0.0% |
| Science & Technology | 21 | 10.1% |
| Business | 81 | 38.8% |
| Education | 27 | 12.9% |
| Literature & Languages | 0 | 0.0% |
| Liberal Arts & History | 0 | 0.0% |
| Visual & Performing Arts | 0 | 0.0% |
| Communications | 0 | 0.0% |
| Arts & Humanities | 62 | 29.7% |
| Total | 209 | 100.0% |
Transportation & Commute in Richland
Vehicle Availability by Sex in Richland
The most prevalent vehicle ownership categories in Richland are males with 2 vehicles (184, accounting for 52.7%) and females with 2 vehicles (113, making up 114.3%).
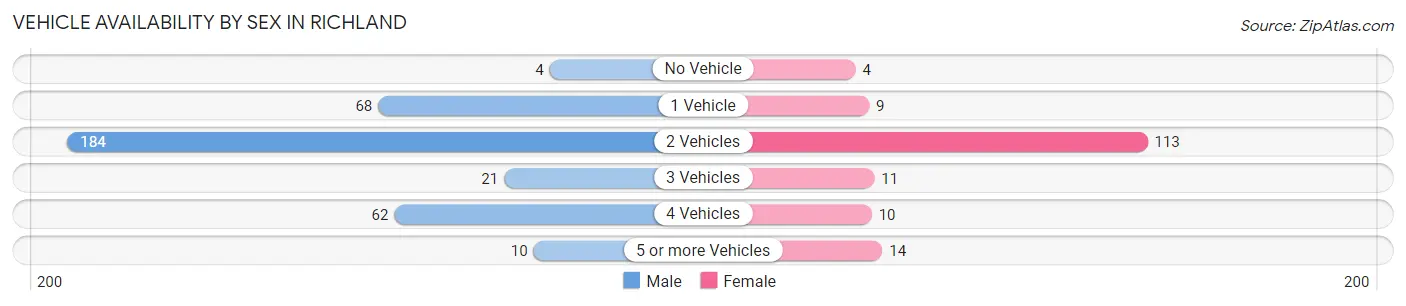
| Vehicles Available | Male | Female |
| No Vehicle | 4 (1.1%) | 4 (2.5%) |
| 1 Vehicle | 68 (19.5%) | 9 (5.6%) |
| 2 Vehicles | 184 (52.7%) | 113 (70.2%) |
| 3 Vehicles | 21 (6.0%) | 11 (6.8%) |
| 4 Vehicles | 62 (17.8%) | 10 (6.2%) |
| 5 or more Vehicles | 10 (2.9%) | 14 (8.7%) |
| Total | 349 (100.0%) | 161 (100.0%) |
Commute Time in Richland
The most frequently occuring commute durations in Richland are 60 to 89 minutes (222 commuters, 43.9%), 15 to 19 minutes (66 commuters, 13.0%), and 45 to 59 minutes (43 commuters, 8.5%).
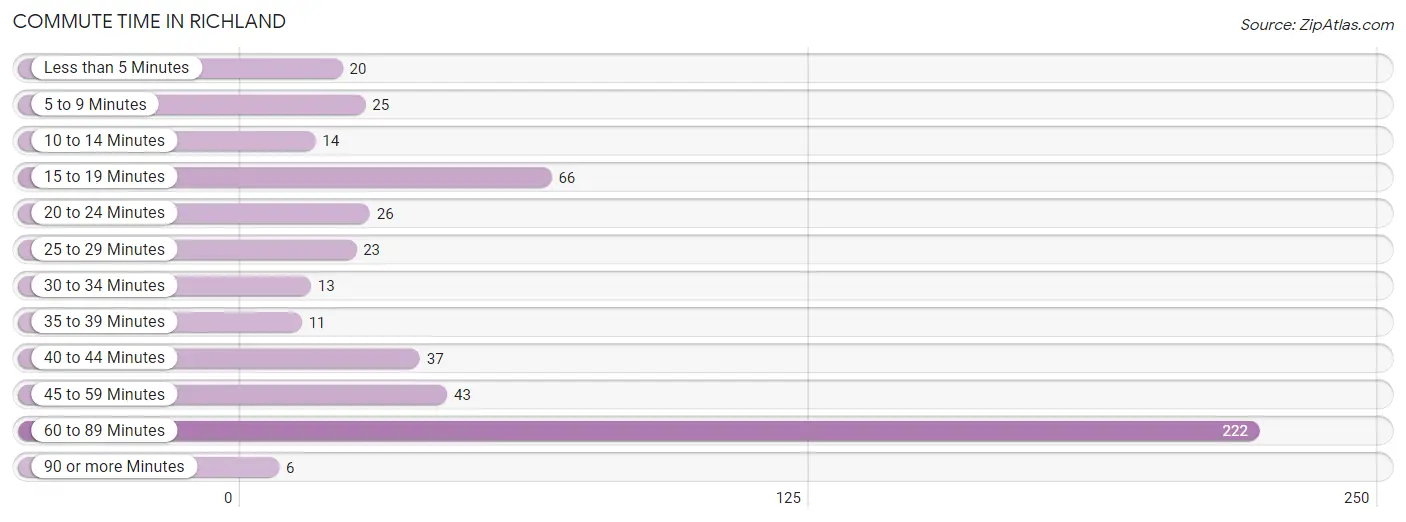
| Commute Time | # Commuters | % Commuters |
| Less than 5 Minutes | 20 | 4.0% |
| 5 to 9 Minutes | 25 | 4.9% |
| 10 to 14 Minutes | 14 | 2.8% |
| 15 to 19 Minutes | 66 | 13.0% |
| 20 to 24 Minutes | 26 | 5.1% |
| 25 to 29 Minutes | 23 | 4.5% |
| 30 to 34 Minutes | 13 | 2.6% |
| 35 to 39 Minutes | 11 | 2.2% |
| 40 to 44 Minutes | 37 | 7.3% |
| 45 to 59 Minutes | 43 | 8.5% |
| 60 to 89 Minutes | 222 | 43.9% |
| 90 or more Minutes | 6 | 1.2% |
Commute Time by Sex in Richland
The most common commute times in Richland are 60 to 89 minutes (214 commuters, 61.3%) for males and 45 to 59 minutes (35 commuters, 22.3%) for females.
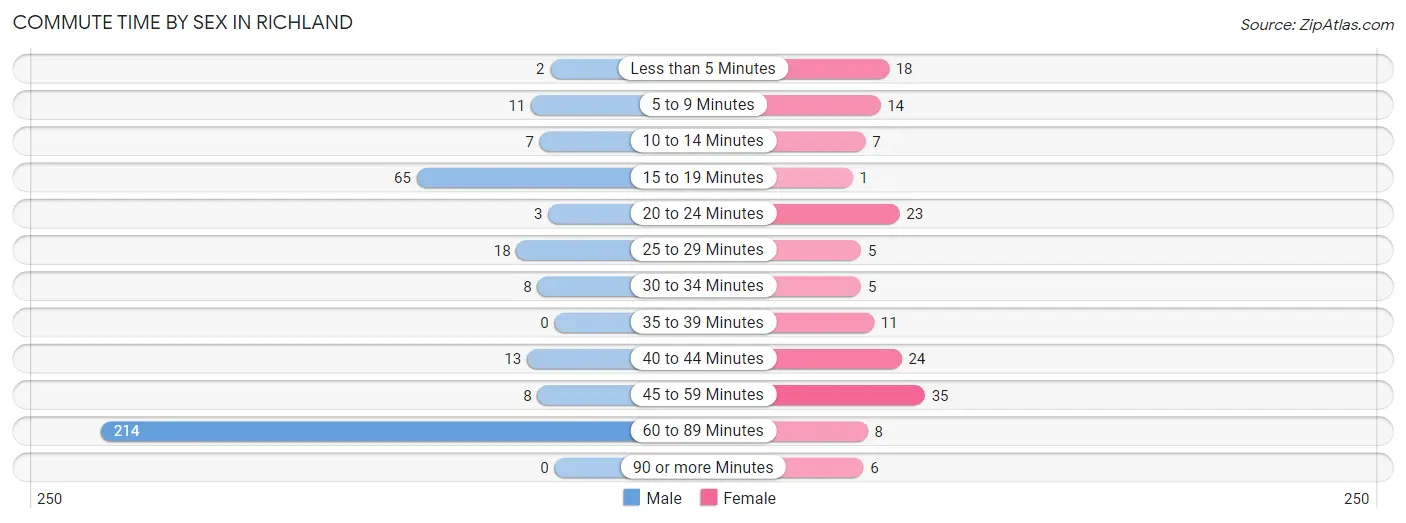
| Commute Time | Male | Female |
| Less than 5 Minutes | 2 (0.6%) | 18 (11.5%) |
| 5 to 9 Minutes | 11 (3.2%) | 14 (8.9%) |
| 10 to 14 Minutes | 7 (2.0%) | 7 (4.5%) |
| 15 to 19 Minutes | 65 (18.6%) | 1 (0.6%) |
| 20 to 24 Minutes | 3 (0.9%) | 23 (14.6%) |
| 25 to 29 Minutes | 18 (5.2%) | 5 (3.2%) |
| 30 to 34 Minutes | 8 (2.3%) | 5 (3.2%) |
| 35 to 39 Minutes | 0 (0.0%) | 11 (7.0%) |
| 40 to 44 Minutes | 13 (3.7%) | 24 (15.3%) |
| 45 to 59 Minutes | 8 (2.3%) | 35 (22.3%) |
| 60 to 89 Minutes | 214 (61.3%) | 8 (5.1%) |
| 90 or more Minutes | 0 (0.0%) | 6 (3.8%) |
Time of Departure to Work by Sex in Richland
The most frequent times of departure to work in Richland are 6:30 AM to 6:59 AM (107, 30.7%) for males and 6:00 AM to 6:29 AM (45, 28.7%) for females.
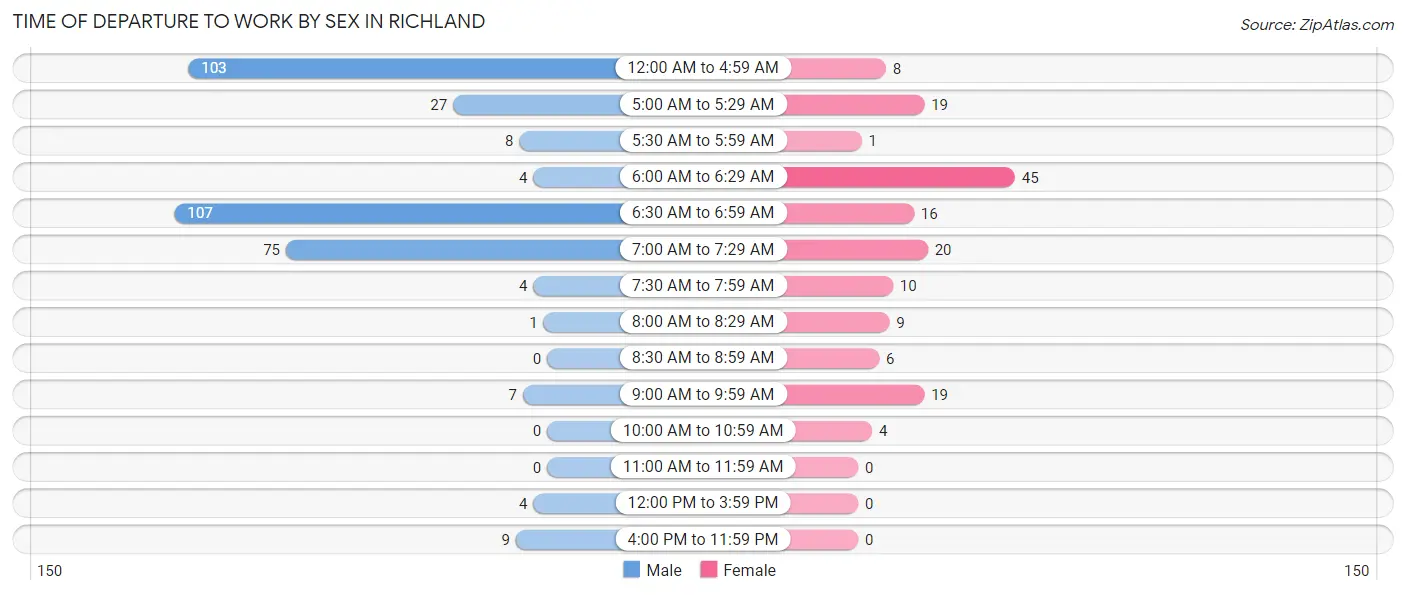
| Time of Departure | Male | Female |
| 12:00 AM to 4:59 AM | 103 (29.5%) | 8 (5.1%) |
| 5:00 AM to 5:29 AM | 27 (7.7%) | 19 (12.1%) |
| 5:30 AM to 5:59 AM | 8 (2.3%) | 1 (0.6%) |
| 6:00 AM to 6:29 AM | 4 (1.1%) | 45 (28.7%) |
| 6:30 AM to 6:59 AM | 107 (30.7%) | 16 (10.2%) |
| 7:00 AM to 7:29 AM | 75 (21.5%) | 20 (12.7%) |
| 7:30 AM to 7:59 AM | 4 (1.1%) | 10 (6.4%) |
| 8:00 AM to 8:29 AM | 1 (0.3%) | 9 (5.7%) |
| 8:30 AM to 8:59 AM | 0 (0.0%) | 6 (3.8%) |
| 9:00 AM to 9:59 AM | 7 (2.0%) | 19 (12.1%) |
| 10:00 AM to 10:59 AM | 0 (0.0%) | 4 (2.5%) |
| 11:00 AM to 11:59 AM | 0 (0.0%) | 0 (0.0%) |
| 12:00 PM to 3:59 PM | 4 (1.1%) | 0 (0.0%) |
| 4:00 PM to 11:59 PM | 9 (2.6%) | 0 (0.0%) |
| Total | 349 (100.0%) | 157 (100.0%) |
Housing Occupancy in Richland
Occupancy by Ownership in Richland
Of the total 648 dwellings in Richland, owner-occupied units account for 335 (51.7%), while renter-occupied units make up 313 (48.3%).
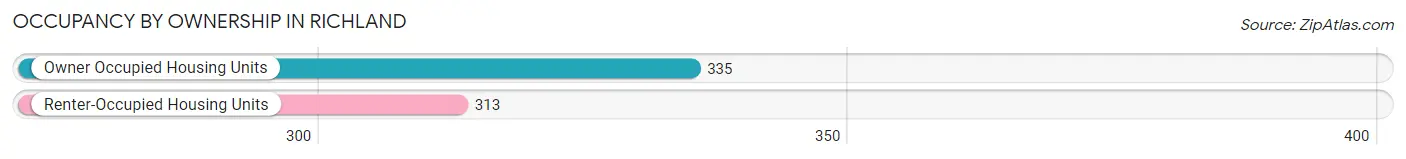
| Occupancy | # Housing Units | % Housing Units |
| Owner Occupied Housing Units | 335 | 51.7% |
| Renter-Occupied Housing Units | 313 | 48.3% |
| Total Occupied Housing Units | 648 | 100.0% |
Occupancy by Household Size in Richland
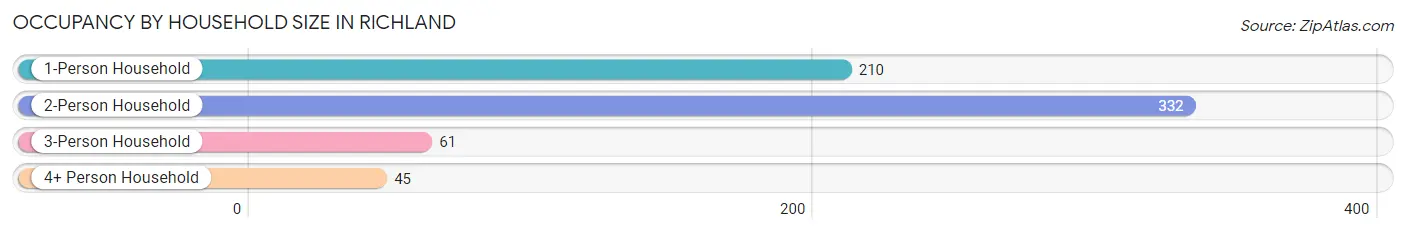
| Household Size | # Housing Units | % Housing Units |
| 1-Person Household | 210 | 32.4% |
| 2-Person Household | 332 | 51.2% |
| 3-Person Household | 61 | 9.4% |
| 4+ Person Household | 45 | 6.9% |
| Total Housing Units | 648 | 100.0% |
Occupancy by Ownership by Household Size in Richland
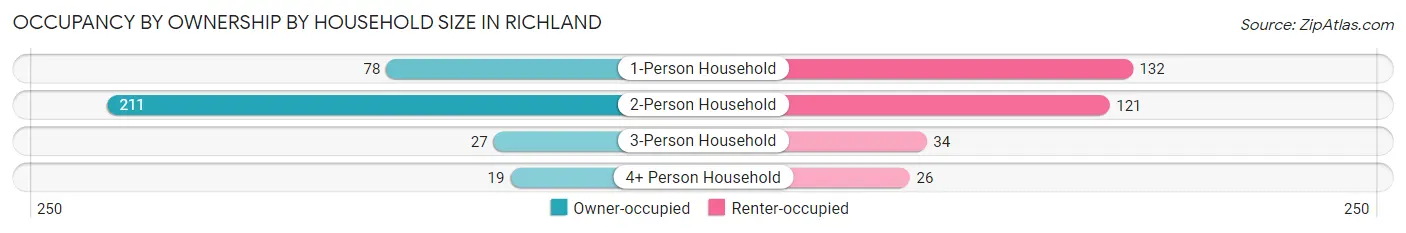
| Household Size | Owner-occupied | Renter-occupied |
| 1-Person Household | 78 (37.1%) | 132 (62.9%) |
| 2-Person Household | 211 (63.5%) | 121 (36.4%) |
| 3-Person Household | 27 (44.3%) | 34 (55.7%) |
| 4+ Person Household | 19 (42.2%) | 26 (57.8%) |
| Total Housing Units | 335 (51.7%) | 313 (48.3%) |
Occupancy by Educational Attainment in Richland
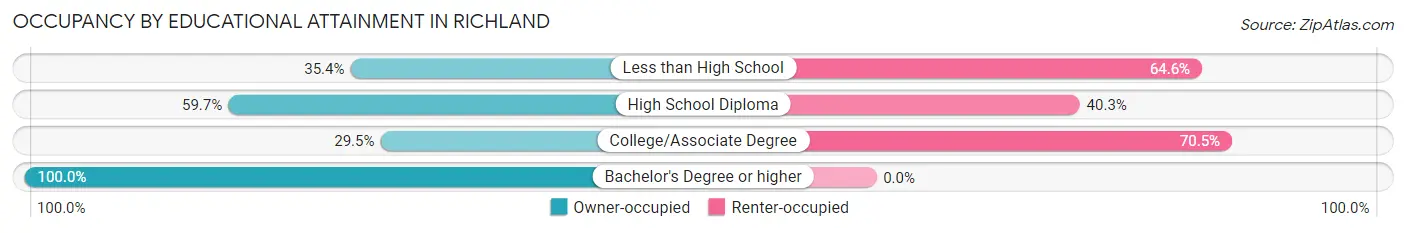
| Household Size | Owner-occupied | Renter-occupied |
| Less than High School | 34 (35.4%) | 62 (64.6%) |
| High School Diploma | 173 (59.7%) | 117 (40.3%) |
| College/Associate Degree | 56 (29.5%) | 134 (70.5%) |
| Bachelor's Degree or higher | 72 (100.0%) | 0 (0.0%) |
Occupancy by Age of Householder in Richland
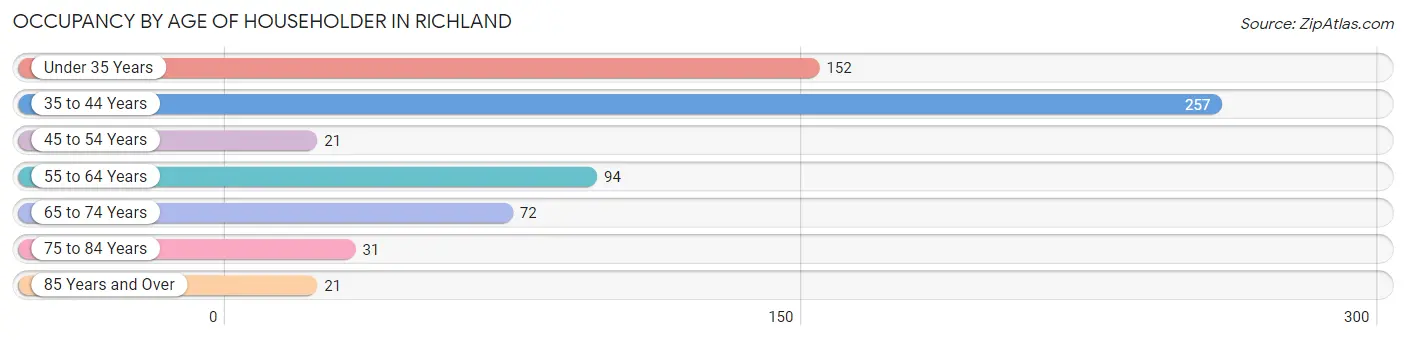
| Age Bracket | # Households | % Households |
| Under 35 Years | 152 | 23.5% |
| 35 to 44 Years | 257 | 39.7% |
| 45 to 54 Years | 21 | 3.2% |
| 55 to 64 Years | 94 | 14.5% |
| 65 to 74 Years | 72 | 11.1% |
| 75 to 84 Years | 31 | 4.8% |
| 85 Years and Over | 21 | 3.2% |
| Total | 648 | 100.0% |
Housing Finances in Richland
Median Income by Occupancy in Richland
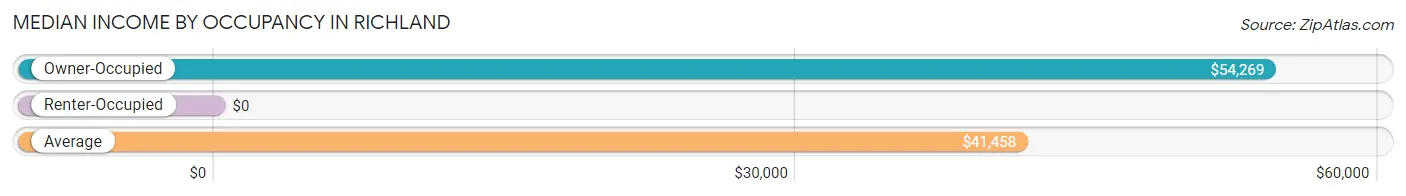
| Occupancy Type | # Households | Median Income |
| Owner-Occupied | 335 (51.7%) | $54,269 |
| Renter-Occupied | 313 (48.3%) | $0 |
| Average | 648 (100.0%) | $41,458 |
Occupancy by Householder Income Bracket in Richland
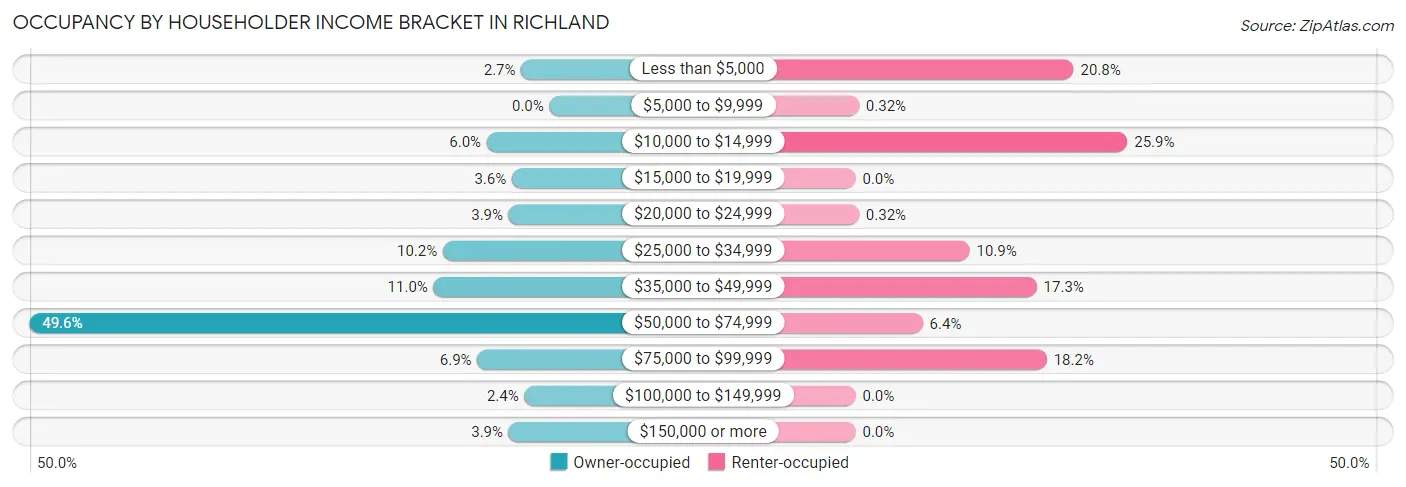
| Income Bracket | Owner-occupied | Renter-occupied |
| Less than $5,000 | 9 (2.7%) | 65 (20.8%) |
| $5,000 to $9,999 | 0 (0.0%) | 1 (0.3%) |
| $10,000 to $14,999 | 20 (6.0%) | 81 (25.9%) |
| $15,000 to $19,999 | 12 (3.6%) | 0 (0.0%) |
| $20,000 to $24,999 | 13 (3.9%) | 1 (0.3%) |
| $25,000 to $34,999 | 34 (10.2%) | 34 (10.9%) |
| $35,000 to $49,999 | 37 (11.0%) | 54 (17.2%) |
| $50,000 to $74,999 | 166 (49.5%) | 20 (6.4%) |
| $75,000 to $99,999 | 23 (6.9%) | 57 (18.2%) |
| $100,000 to $149,999 | 8 (2.4%) | 0 (0.0%) |
| $150,000 or more | 13 (3.9%) | 0 (0.0%) |
| Total | 335 (100.0%) | 313 (100.0%) |
Monthly Housing Cost Tiers in Richland
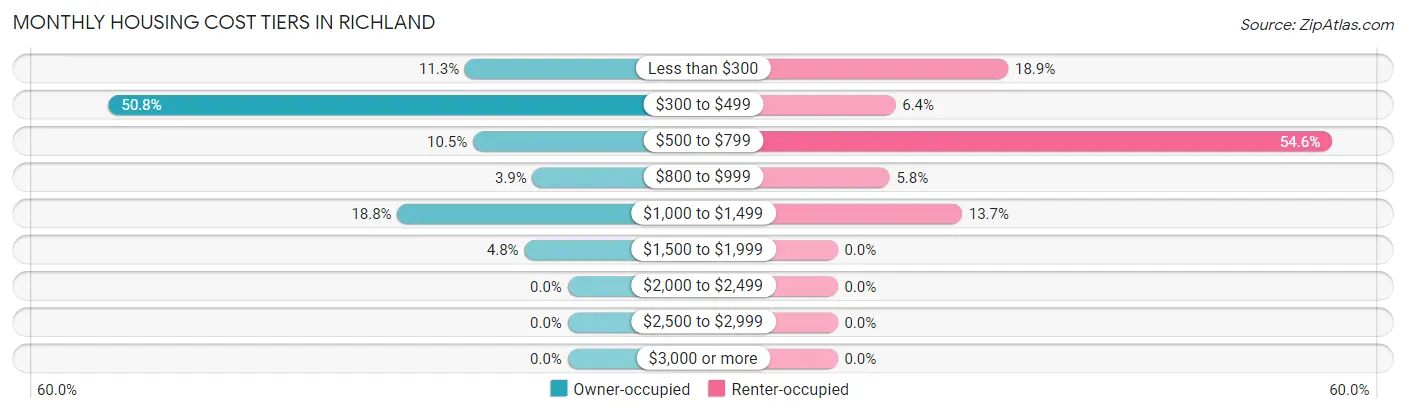
| Monthly Cost | Owner-occupied | Renter-occupied |
| Less than $300 | 38 (11.3%) | 59 (18.9%) |
| $300 to $499 | 170 (50.7%) | 20 (6.4%) |
| $500 to $799 | 35 (10.4%) | 171 (54.6%) |
| $800 to $999 | 13 (3.9%) | 18 (5.8%) |
| $1,000 to $1,499 | 63 (18.8%) | 43 (13.7%) |
| $1,500 to $1,999 | 16 (4.8%) | 0 (0.0%) |
| $2,000 to $2,499 | 0 (0.0%) | 0 (0.0%) |
| $2,500 to $2,999 | 0 (0.0%) | 0 (0.0%) |
| $3,000 or more | 0 (0.0%) | 0 (0.0%) |
| Total | 335 (100.0%) | 313 (100.0%) |
Physical Housing Characteristics in Richland
Housing Structures in Richland
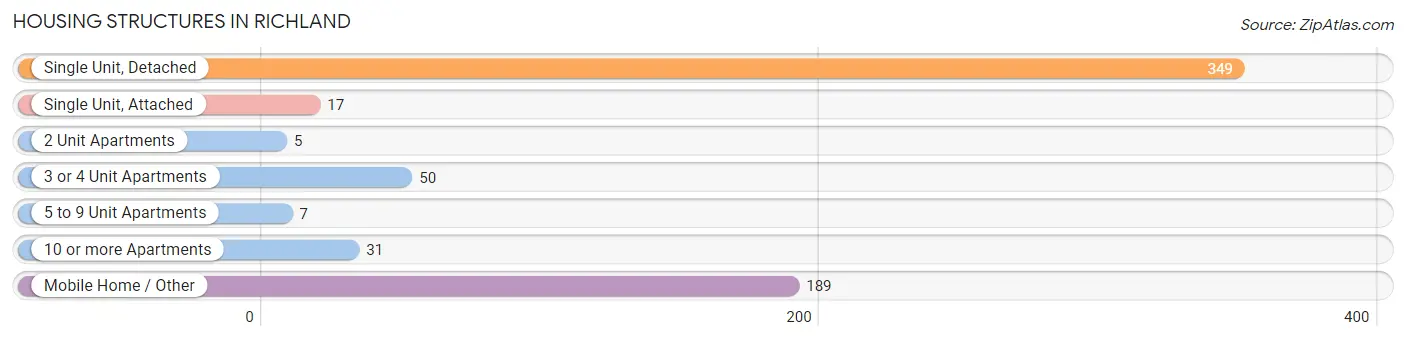
| Structure Type | # Housing Units | % Housing Units |
| Single Unit, Detached | 349 | 53.9% |
| Single Unit, Attached | 17 | 2.6% |
| 2 Unit Apartments | 5 | 0.8% |
| 3 or 4 Unit Apartments | 50 | 7.7% |
| 5 to 9 Unit Apartments | 7 | 1.1% |
| 10 or more Apartments | 31 | 4.8% |
| Mobile Home / Other | 189 | 29.2% |
| Total | 648 | 100.0% |
Housing Structures by Occupancy in Richland
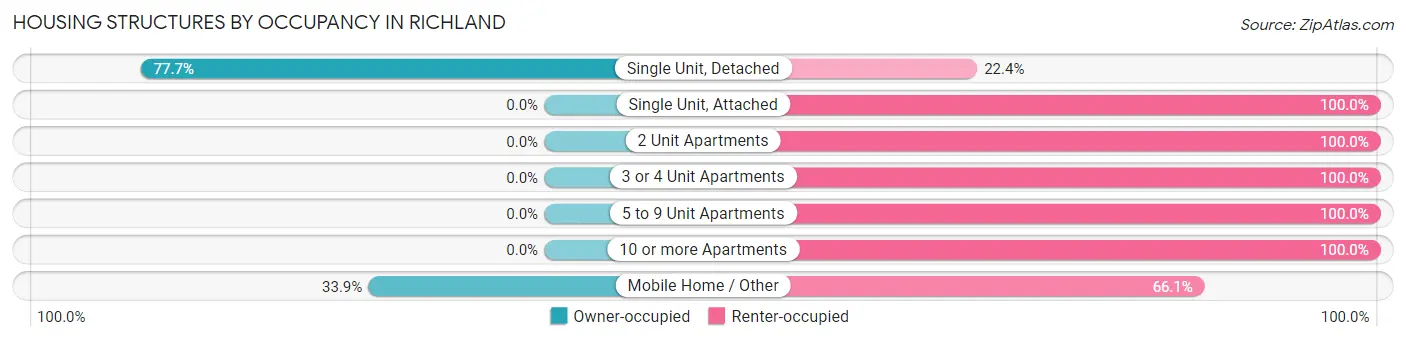
| Structure Type | Owner-occupied | Renter-occupied |
| Single Unit, Detached | 271 (77.6%) | 78 (22.4%) |
| Single Unit, Attached | 0 (0.0%) | 17 (100.0%) |
| 2 Unit Apartments | 0 (0.0%) | 5 (100.0%) |
| 3 or 4 Unit Apartments | 0 (0.0%) | 50 (100.0%) |
| 5 to 9 Unit Apartments | 0 (0.0%) | 7 (100.0%) |
| 10 or more Apartments | 0 (0.0%) | 31 (100.0%) |
| Mobile Home / Other | 64 (33.9%) | 125 (66.1%) |
| Total | 335 (51.7%) | 313 (48.3%) |
Housing Structures by Number of Rooms in Richland
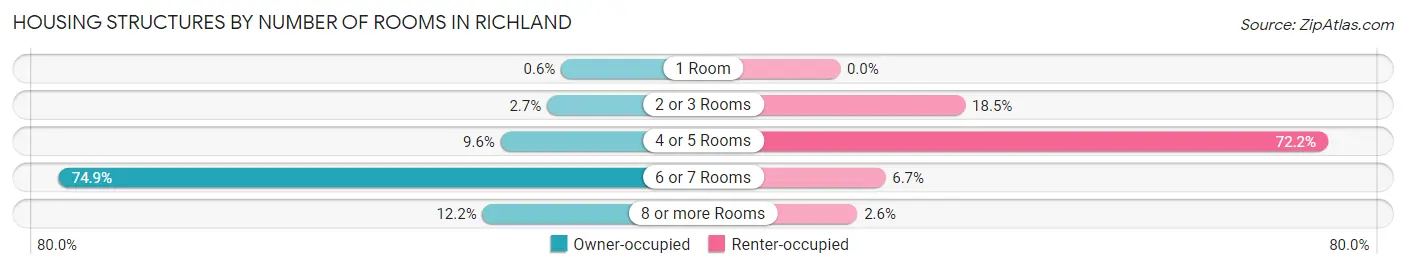
| Number of Rooms | Owner-occupied | Renter-occupied |
| 1 Room | 2 (0.6%) | 0 (0.0%) |
| 2 or 3 Rooms | 9 (2.7%) | 58 (18.5%) |
| 4 or 5 Rooms | 32 (9.6%) | 226 (72.2%) |
| 6 or 7 Rooms | 251 (74.9%) | 21 (6.7%) |
| 8 or more Rooms | 41 (12.2%) | 8 (2.6%) |
| Total | 335 (100.0%) | 313 (100.0%) |
Housing Structure by Heating Type in Richland
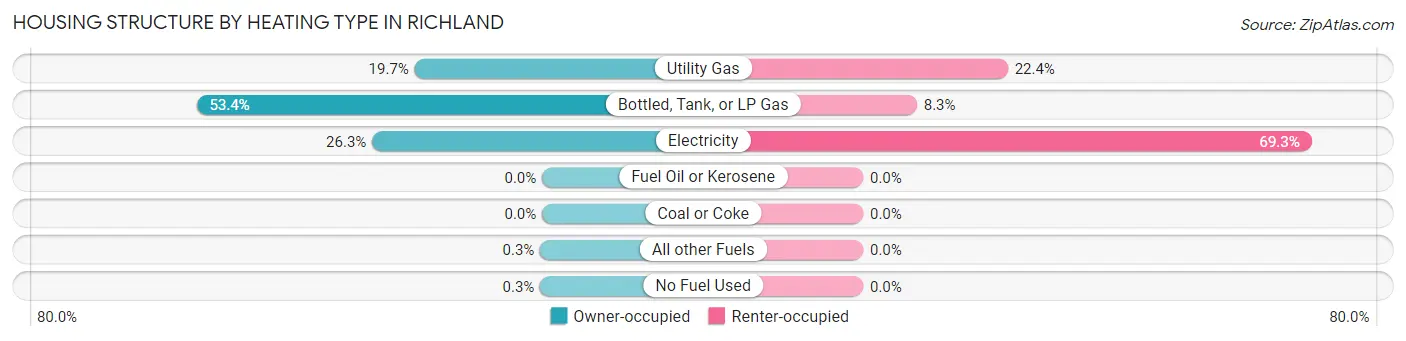
| Heating Type | Owner-occupied | Renter-occupied |
| Utility Gas | 66 (19.7%) | 70 (22.4%) |
| Bottled, Tank, or LP Gas | 179 (53.4%) | 26 (8.3%) |
| Electricity | 88 (26.3%) | 217 (69.3%) |
| Fuel Oil or Kerosene | 0 (0.0%) | 0 (0.0%) |
| Coal or Coke | 0 (0.0%) | 0 (0.0%) |
| All other Fuels | 1 (0.3%) | 0 (0.0%) |
| No Fuel Used | 1 (0.3%) | 0 (0.0%) |
| Total | 335 (100.0%) | 313 (100.0%) |
Household Vehicle Usage in Richland
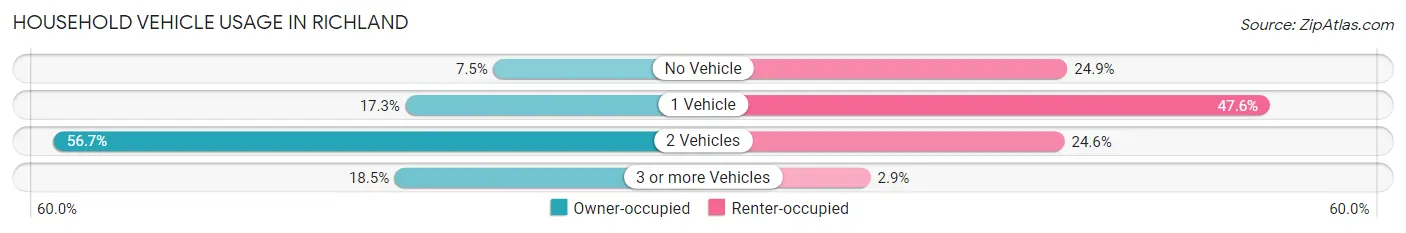
| Vehicles per Household | Owner-occupied | Renter-occupied |
| No Vehicle | 25 (7.5%) | 78 (24.9%) |
| 1 Vehicle | 58 (17.3%) | 149 (47.6%) |
| 2 Vehicles | 190 (56.7%) | 77 (24.6%) |
| 3 or more Vehicles | 62 (18.5%) | 9 (2.9%) |
| Total | 335 (100.0%) | 313 (100.0%) |
Real Estate & Mortgages in Richland
Real Estate and Mortgage Overview in Richland
| Characteristic | Without Mortgage | With Mortgage |
| Housing Units | 252 | 83 |
| Median Property Value | $105,000 | $133,500 |
| Median Household Income | $62,621 | $0 |
| Monthly Housing Costs | $340 | $0 |
| Real Estate Taxes | $387 | $1 |
Property Value by Mortgage Status in Richland
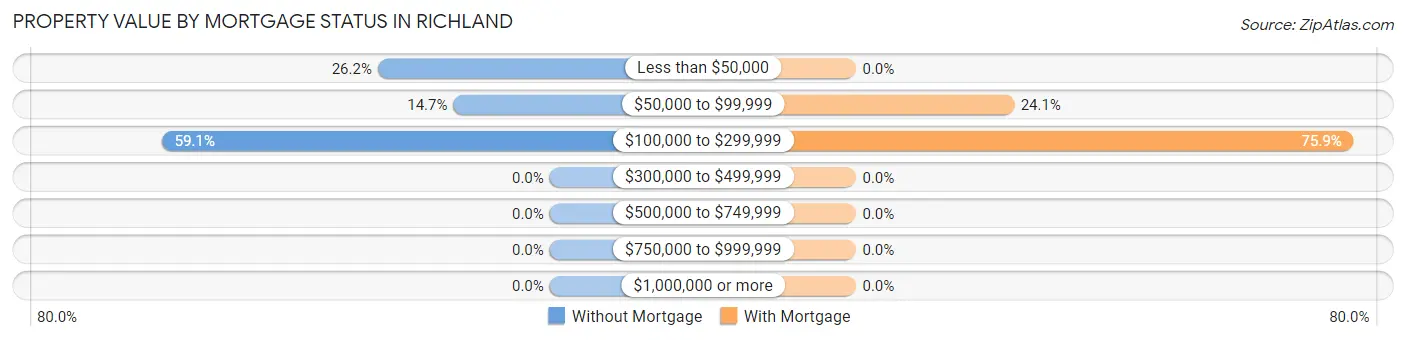
| Property Value | Without Mortgage | With Mortgage |
| Less than $50,000 | 66 (26.2%) | 0 (0.0%) |
| $50,000 to $99,999 | 37 (14.7%) | 20 (24.1%) |
| $100,000 to $299,999 | 149 (59.1%) | 63 (75.9%) |
| $300,000 to $499,999 | 0 (0.0%) | 0 (0.0%) |
| $500,000 to $749,999 | 0 (0.0%) | 0 (0.0%) |
| $750,000 to $999,999 | 0 (0.0%) | 0 (0.0%) |
| $1,000,000 or more | 0 (0.0%) | 0 (0.0%) |
| Total | 252 (100.0%) | 83 (100.0%) |
Household Income by Mortgage Status in Richland
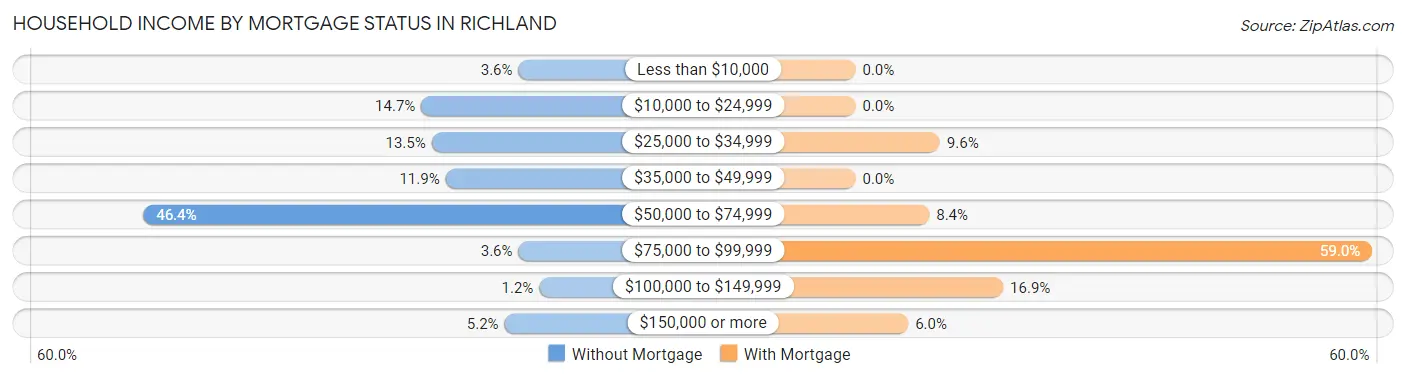
| Household Income | Without Mortgage | With Mortgage |
| Less than $10,000 | 9 (3.6%) | 0 (0.0%) |
| $10,000 to $24,999 | 37 (14.7%) | 0 (0.0%) |
| $25,000 to $34,999 | 34 (13.5%) | 8 (9.6%) |
| $35,000 to $49,999 | 30 (11.9%) | 0 (0.0%) |
| $50,000 to $74,999 | 117 (46.4%) | 7 (8.4%) |
| $75,000 to $99,999 | 9 (3.6%) | 49 (59.0%) |
| $100,000 to $149,999 | 3 (1.2%) | 14 (16.9%) |
| $150,000 or more | 13 (5.2%) | 5 (6.0%) |
| Total | 252 (100.0%) | 83 (100.0%) |
Property Value to Household Income Ratio in Richland
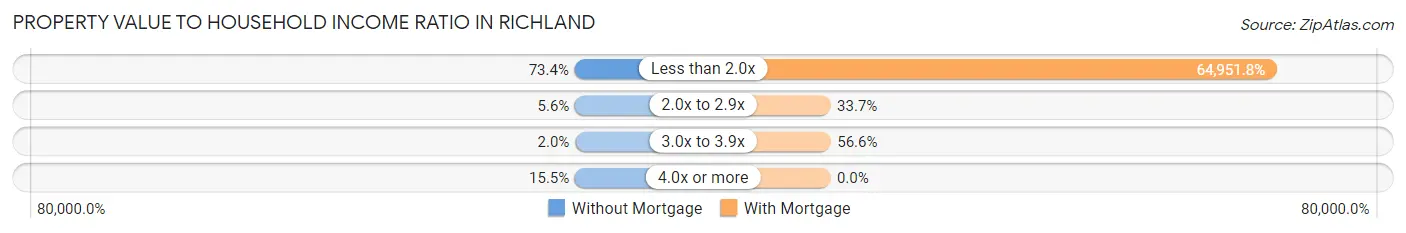
| Value-to-Income Ratio | Without Mortgage | With Mortgage |
| Less than 2.0x | 185 (73.4%) | 53,910 (64,951.8%) |
| 2.0x to 2.9x | 14 (5.6%) | 28 (33.7%) |
| 3.0x to 3.9x | 5 (2.0%) | 47 (56.6%) |
| 4.0x or more | 39 (15.5%) | 0 (0.0%) |
| Total | 252 (100.0%) | 83 (100.0%) |
Real Estate Taxes by Mortgage Status in Richland
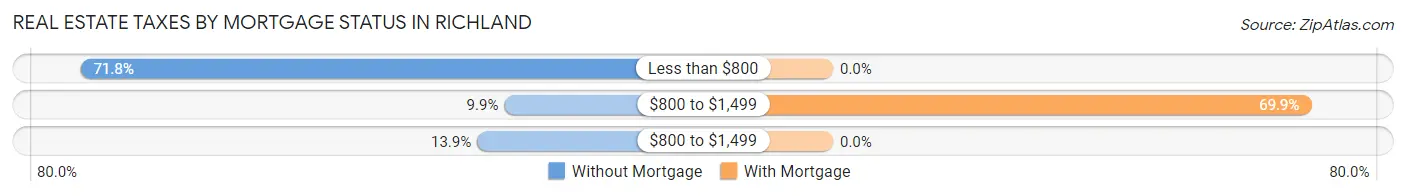
| Property Taxes | Without Mortgage | With Mortgage |
| Less than $800 | 181 (71.8%) | 0 (0.0%) |
| $800 to $1,499 | 25 (9.9%) | 58 (69.9%) |
| $800 to $1,499 | 35 (13.9%) | 0 (0.0%) |
| Total | 252 (100.0%) | 83 (100.0%) |
Health & Disability in Richland
Health Insurance Coverage by Age in Richland
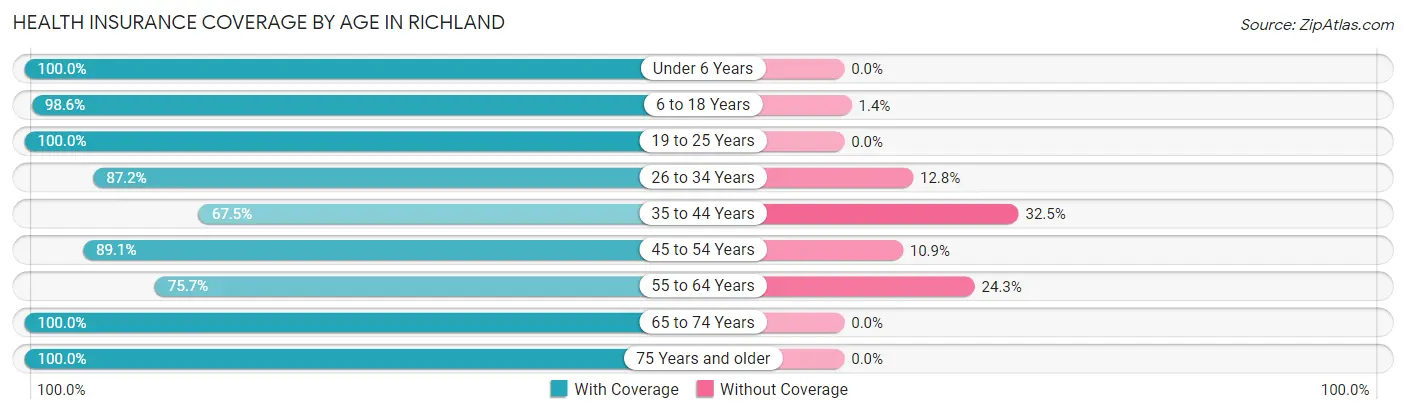
| Age Bracket | With Coverage | Without Coverage |
| Under 6 Years | 40 (100.0%) | 0 (0.0%) |
| 6 to 18 Years | 145 (98.6%) | 2 (1.4%) |
| 19 to 25 Years | 87 (100.0%) | 0 (0.0%) |
| 26 to 34 Years | 102 (87.2%) | 15 (12.8%) |
| 35 to 44 Years | 268 (67.5%) | 129 (32.5%) |
| 45 to 54 Years | 49 (89.1%) | 6 (10.9%) |
| 55 to 64 Years | 81 (75.7%) | 26 (24.3%) |
| 65 to 74 Years | 103 (100.0%) | 0 (0.0%) |
| 75 Years and older | 85 (100.0%) | 0 (0.0%) |
| Total | 960 (84.4%) | 178 (15.6%) |
Health Insurance Coverage by Citizenship Status in Richland
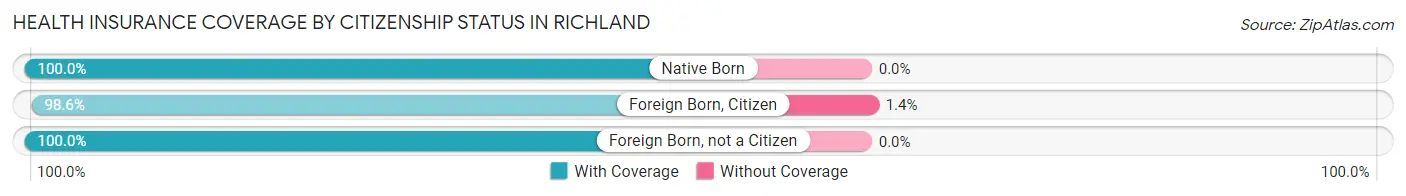
| Citizenship Status | With Coverage | Without Coverage |
| Native Born | 40 (100.0%) | 0 (0.0%) |
| Foreign Born, Citizen | 145 (98.6%) | 2 (1.4%) |
| Foreign Born, not a Citizen | 87 (100.0%) | 0 (0.0%) |
Health Insurance Coverage by Household Income in Richland
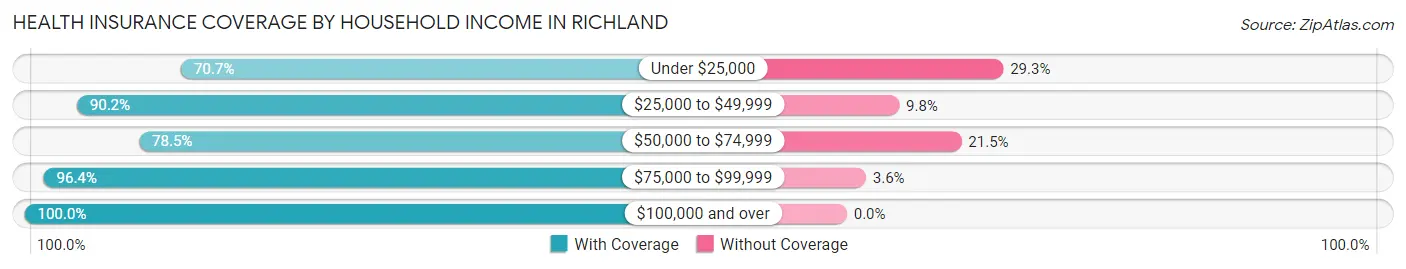
| Household Income | With Coverage | Without Coverage |
| Under $25,000 | 164 (70.7%) | 68 (29.3%) |
| $25,000 to $49,999 | 322 (90.2%) | 35 (9.8%) |
| $50,000 to $74,999 | 256 (78.5%) | 70 (21.5%) |
| $75,000 to $99,999 | 135 (96.4%) | 5 (3.6%) |
| $100,000 and over | 83 (100.0%) | 0 (0.0%) |
Public vs Private Health Insurance Coverage by Age in Richland
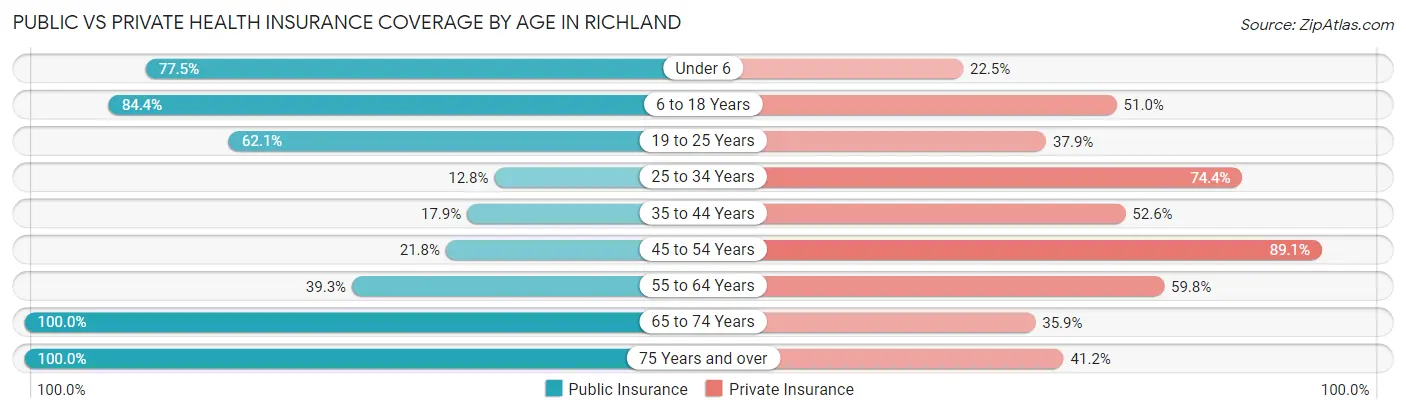
| Age Bracket | Public Insurance | Private Insurance |
| Under 6 | 31 (77.5%) | 9 (22.5%) |
| 6 to 18 Years | 124 (84.4%) | 75 (51.0%) |
| 19 to 25 Years | 54 (62.1%) | 33 (37.9%) |
| 25 to 34 Years | 15 (12.8%) | 87 (74.4%) |
| 35 to 44 Years | 71 (17.9%) | 209 (52.6%) |
| 45 to 54 Years | 12 (21.8%) | 49 (89.1%) |
| 55 to 64 Years | 42 (39.3%) | 64 (59.8%) |
| 65 to 74 Years | 103 (100.0%) | 37 (35.9%) |
| 75 Years and over | 85 (100.0%) | 35 (41.2%) |
| Total | 537 (47.2%) | 598 (52.5%) |
Disability Status by Sex by Age in Richland
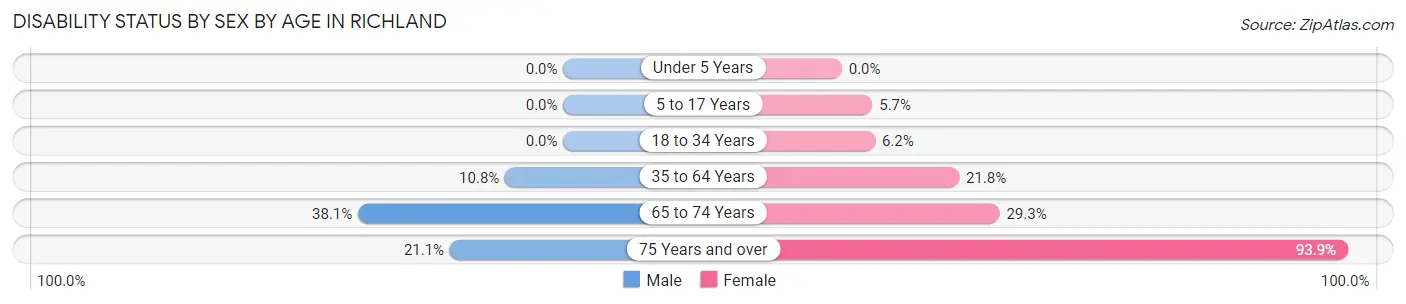
| Age Bracket | Male | Female |
| Under 5 Years | 0 (0.0%) | 0 (0.0%) |
| 5 to 17 Years | 0 (0.0%) | 3 (5.7%) |
| 18 to 34 Years | 0 (0.0%) | 4 (6.1%) |
| 35 to 64 Years | 42 (10.8%) | 37 (21.8%) |
| 65 to 74 Years | 8 (38.1%) | 24 (29.3%) |
| 75 Years and over | 4 (21.0%) | 62 (93.9%) |
Disability Class by Sex by Age in Richland
Disability Class: Hearing Difficulty
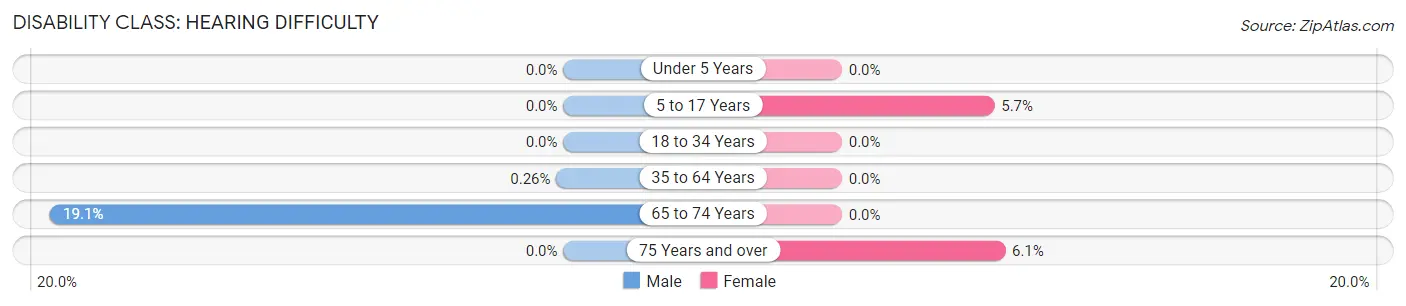
| Age Bracket | Male | Female |
| Under 5 Years | 0 (0.0%) | 0 (0.0%) |
| 5 to 17 Years | 0 (0.0%) | 3 (5.7%) |
| 18 to 34 Years | 0 (0.0%) | 0 (0.0%) |
| 35 to 64 Years | 1 (0.3%) | 0 (0.0%) |
| 65 to 74 Years | 4 (19.1%) | 0 (0.0%) |
| 75 Years and over | 0 (0.0%) | 4 (6.1%) |
Disability Class: Vision Difficulty
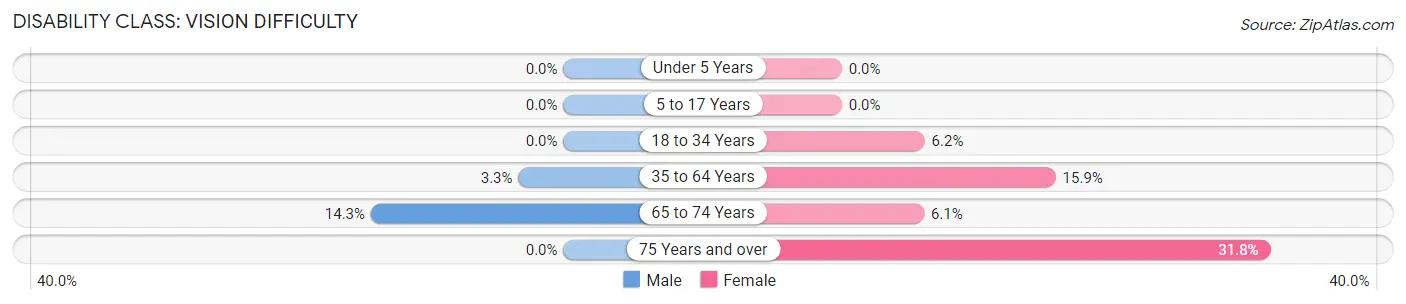
| Age Bracket | Male | Female |
| Under 5 Years | 0 (0.0%) | 0 (0.0%) |
| 5 to 17 Years | 0 (0.0%) | 0 (0.0%) |
| 18 to 34 Years | 0 (0.0%) | 4 (6.1%) |
| 35 to 64 Years | 13 (3.3%) | 27 (15.9%) |
| 65 to 74 Years | 3 (14.3%) | 5 (6.1%) |
| 75 Years and over | 0 (0.0%) | 21 (31.8%) |
Disability Class: Cognitive Difficulty
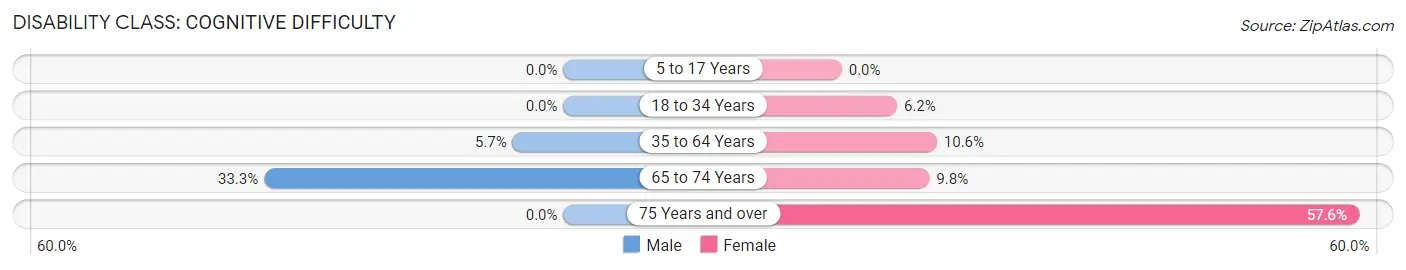
| Age Bracket | Male | Female |
| 5 to 17 Years | 0 (0.0%) | 0 (0.0%) |
| 18 to 34 Years | 0 (0.0%) | 4 (6.1%) |
| 35 to 64 Years | 22 (5.7%) | 18 (10.6%) |
| 65 to 74 Years | 7 (33.3%) | 8 (9.8%) |
| 75 Years and over | 0 (0.0%) | 38 (57.6%) |
Disability Class: Ambulatory Difficulty
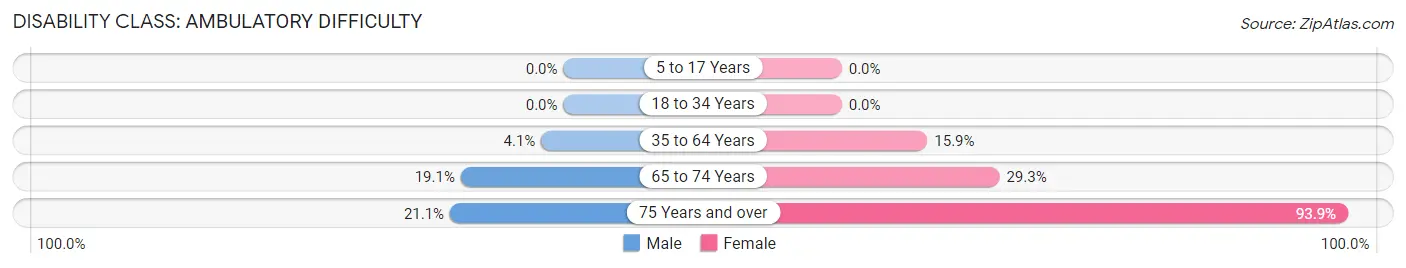
| Age Bracket | Male | Female |
| 5 to 17 Years | 0 (0.0%) | 0 (0.0%) |
| 18 to 34 Years | 0 (0.0%) | 0 (0.0%) |
| 35 to 64 Years | 16 (4.1%) | 27 (15.9%) |
| 65 to 74 Years | 4 (19.1%) | 24 (29.3%) |
| 75 Years and over | 4 (21.0%) | 62 (93.9%) |
Disability Class: Self-Care Difficulty
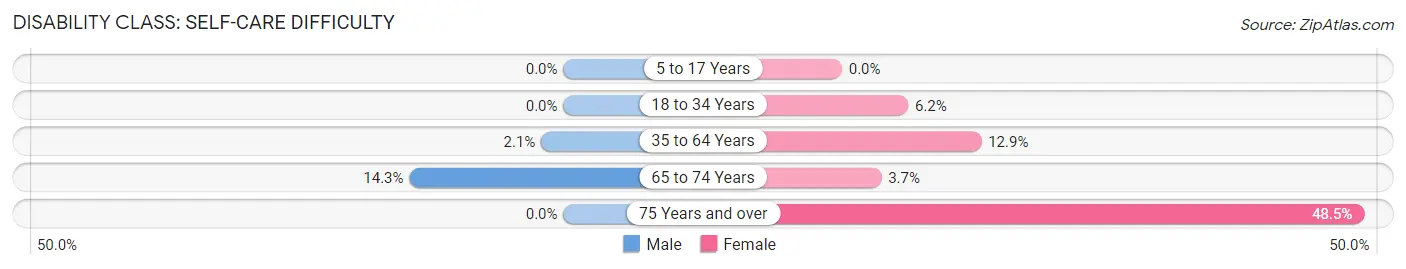
| Age Bracket | Male | Female |
| 5 to 17 Years | 0 (0.0%) | 0 (0.0%) |
| 18 to 34 Years | 0 (0.0%) | 4 (6.1%) |
| 35 to 64 Years | 8 (2.1%) | 22 (12.9%) |
| 65 to 74 Years | 3 (14.3%) | 3 (3.7%) |
| 75 Years and over | 0 (0.0%) | 32 (48.5%) |
Technology Access in Richland
Computing Device Access in Richland
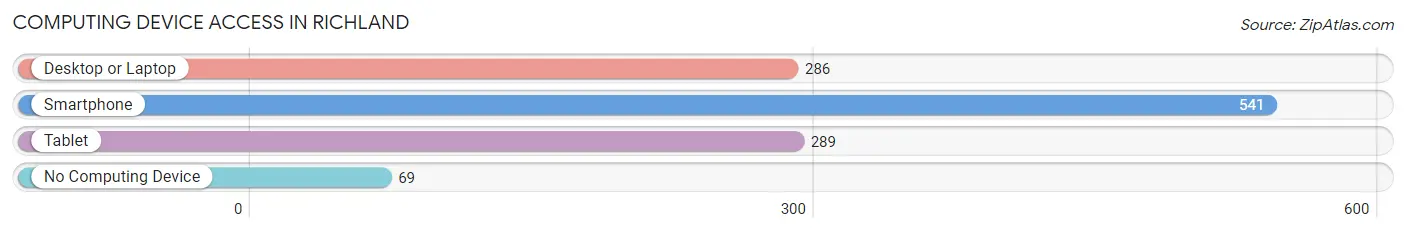
| Device Type | # Households | % Households |
| Desktop or Laptop | 286 | 44.1% |
| Smartphone | 541 | 83.5% |
| Tablet | 289 | 44.6% |
| No Computing Device | 69 | 10.6% |
| Total | 648 | 100.0% |
Internet Access in Richland
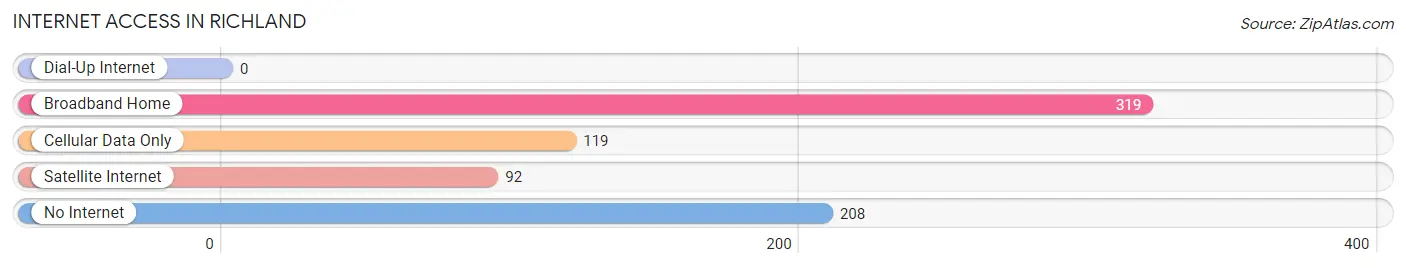
| Internet Type | # Households | % Households |
| Dial-Up Internet | 0 | 0.0% |
| Broadband Home | 319 | 49.2% |
| Cellular Data Only | 119 | 18.4% |
| Satellite Internet | 92 | 14.2% |
| No Internet | 208 | 32.1% |
| Total | 648 | 100.0% |
Richland Summary
Richland, Georgia is a small town located in Stewart County, Georgia. It is situated on the banks of the Chattahoochee River, and is part of the Columbus, Georgia metropolitan area. Richland is a rural community with a population of approximately 1,000 people.
History
Richland was founded in 1820 by a group of settlers from South Carolina. The town was named after the nearby Richland Creek, which was named for the abundance of rich soil in the area. The town was originally a trading post and a stop on the stagecoach route between Columbus and Savannah.
In the late 1800s, Richland became a popular destination for wealthy families from the North who wanted to escape the cold winters. The town was known for its beautiful scenery and its many resorts.
In the early 1900s, Richland was a thriving agricultural community. The town was home to several cotton mills, a sawmill, and a gristmill. The town also had a thriving business district, with several stores, banks, and a post office.
Geography
Richland is located in Stewart County, Georgia, on the banks of the Chattahoochee River. The town is situated in a rural area, surrounded by rolling hills and farmland. The town is located approximately 30 miles south of Columbus, Georgia, and approximately 50 miles north of Albany, Georgia.
The climate in Richland is mild and humid. The average temperature in the summer is around 80 degrees Fahrenheit, and the average temperature in the winter is around 50 degrees Fahrenheit.
Economy
The economy of Richland is largely based on agriculture. The town is home to several farms, which produce a variety of crops, including cotton, corn, soybeans, and peanuts. The town also has several small businesses, including restaurants, convenience stores, and a hardware store.
Demographics
As of the 2010 census, the population of Richland was 1,000 people. The racial makeup of the town was 95.2% White, 2.2% African American, 0.2% Native American, 0.2% Asian, 0.2% from other races, and 1.9% from two or more races. The median household income was $30,000, and the median family income was $35,000.
Richland is a small, rural town with a close-knit community. The town is home to several churches, a library, and a community center. The town also has several parks and recreational areas, including a golf course and a swimming pool.
Common Questions
What is Per Capita Income in Richland?
Per Capita income in Richland is $22,166.
What is the Median Family Income in Richland?
Median Family Income in Richland is $62,762.
What is the Median Household income in Richland?
Median Household Income in Richland is $41,458.
What is Income or Wage Gap in Richland?
Income or Wage Gap in Richland is 27.1%.
Women in Richland earn 72.9 cents for every dollar earned by a man.
What is Inequality or Gini Index in Richland?
Inequality or Gini Index in Richland is 0.41.
What is the Total Population of Richland?
Total Population of Richland is 1,290.
What is the Total Male Population of Richland?
Total Male Population of Richland is 732.
What is the Total Female Population of Richland?
Total Female Population of Richland is 558.
What is the Ratio of Males per 100 Females in Richland?
There are 131.18 Males per 100 Females in Richland.
What is the Ratio of Females per 100 Males in Richland?
There are 76.23 Females per 100 Males in Richland.
What is the Median Population Age in Richland?
Median Population Age in Richland is 39.7 Years.
What is the Average Family Size in Richland
Average Family Size in Richland is 2.2 People.
What is the Average Household Size in Richland
Average Household Size in Richland is 1.8 People.
How Large is the Labor Force in Richland?
There are 569 People in the Labor Forcein in Richland.
What is the Percentage of People in the Labor Force in Richland?
50.4% of People are in the Labor Force in Richland.
What is the Unemployment Rate in Richland?
Unemployment Rate in Richland is 5.4%.