Lindale, GA Map & Demographics
Lindale Map
Lindale Overview
$23,260
PER CAPITA INCOME
$46,601
AVG FAMILY INCOME
$39,472
AVG HOUSEHOLD INCOME
15.6%
WAGE / INCOME GAP [ % ]
84.4¢/ $1
WAGE / INCOME GAP [ $ ]
$8,500
FAMILY INCOME DEFICIT
0.52
INEQUALITY / GINI INDEX
4,568
TOTAL POPULATION
2,320
MALE POPULATION
2,248
FEMALE POPULATION
103.20
MALES / 100 FEMALES
96.90
FEMALES / 100 MALES
35.9
MEDIAN AGE
3.4
AVG FAMILY SIZE
2.7
AVG HOUSEHOLD SIZE
2,089
LABOR FORCE [ PEOPLE ]
56.0%
PERCENT IN LABOR FORCE
5.8%
UNEMPLOYMENT RATE
Lindale Zip Codes
Lindale Area Codes
Income in Lindale
Income Overview in Lindale
Per Capita Income in Lindale is $23,260, while median incomes of families and households are $46,601 and $39,472 respectively.
| Characteristic | Number | Measure |
| Per Capita Income | 4,568 | $23,260 |
| Median Family Income | 1,092 | $46,601 |
| Mean Family Income | 1,092 | $76,496 |
| Median Household Income | 1,675 | $39,472 |
| Mean Household Income | 1,675 | $60,565 |
| Income Deficit | 1,092 | $8,500 |
| Wage / Income Gap (%) | 4,568 | 15.55% |
| Wage / Income Gap ($) | 4,568 | 84.45¢ per $1 |
| Gini / Inequality Index | 4,568 | 0.52 |
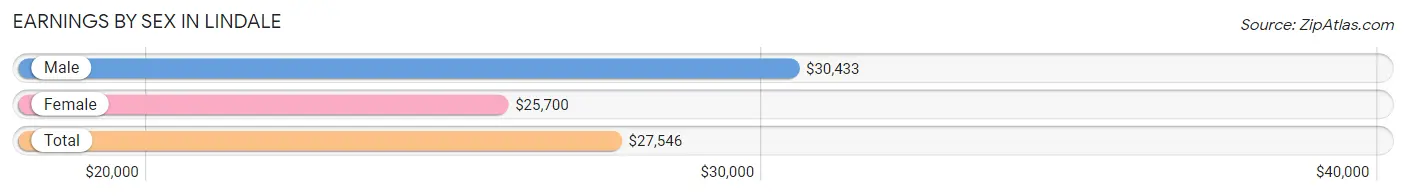
Earnings by Sex in Lindale
Average Earnings in Lindale are $27,546, $30,433 for men and $25,700 for women, a difference of 15.5%.
| Sex | Number | Average Earnings |
| Male | 1,366 (60.7%) | $30,433 |
| Female | 884 (39.3%) | $25,700 |
| Total | 2,250 (100.0%) | $27,546 |
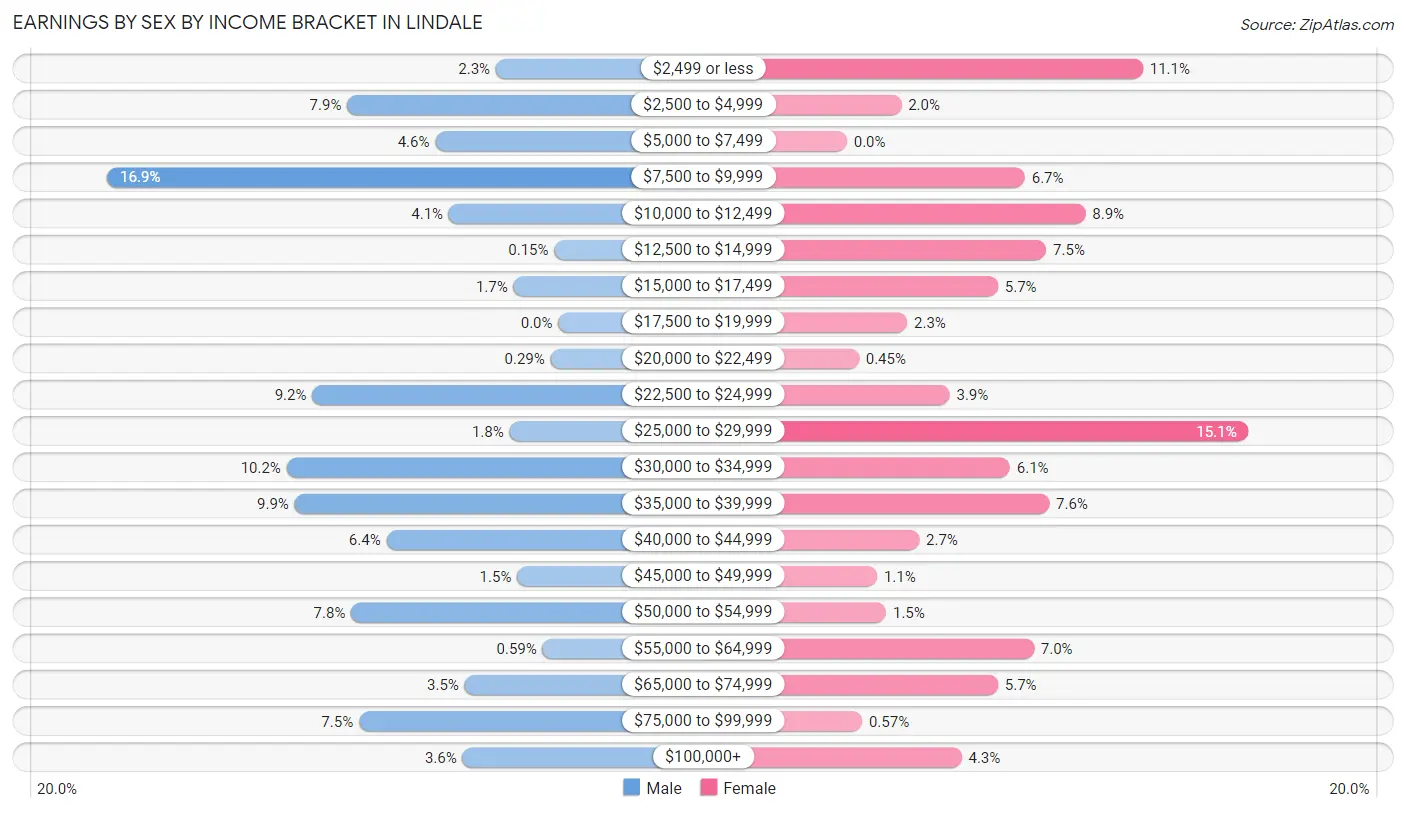
Earnings by Sex by Income Bracket in Lindale
The most common earnings brackets in Lindale are $7,500 to $9,999 for men (231 | 16.9%) and $25,000 to $29,999 for women (133 | 15.0%).
| Income | Male | Female |
| $2,499 or less | 32 (2.3%) | 98 (11.1%) |
| $2,500 to $4,999 | 108 (7.9%) | 18 (2.0%) |
| $5,000 to $7,499 | 63 (4.6%) | 0 (0.0%) |
| $7,500 to $9,999 | 231 (16.9%) | 59 (6.7%) |
| $10,000 to $12,499 | 56 (4.1%) | 79 (8.9%) |
| $12,500 to $14,999 | 2 (0.2%) | 66 (7.5%) |
| $15,000 to $17,499 | 23 (1.7%) | 50 (5.7%) |
| $17,500 to $19,999 | 0 (0.0%) | 20 (2.3%) |
| $20,000 to $22,499 | 4 (0.3%) | 4 (0.4%) |
| $22,500 to $24,999 | 126 (9.2%) | 34 (3.8%) |
| $25,000 to $29,999 | 25 (1.8%) | 133 (15.0%) |
| $30,000 to $34,999 | 139 (10.2%) | 54 (6.1%) |
| $35,000 to $39,999 | 135 (9.9%) | 67 (7.6%) |
| $40,000 to $44,999 | 88 (6.4%) | 24 (2.7%) |
| $45,000 to $49,999 | 21 (1.5%) | 10 (1.1%) |
| $50,000 to $54,999 | 106 (7.8%) | 13 (1.5%) |
| $55,000 to $64,999 | 8 (0.6%) | 62 (7.0%) |
| $65,000 to $74,999 | 48 (3.5%) | 50 (5.7%) |
| $75,000 to $99,999 | 102 (7.5%) | 5 (0.6%) |
| $100,000+ | 49 (3.6%) | 38 (4.3%) |
| Total | 1,366 (100.0%) | 884 (100.0%) |
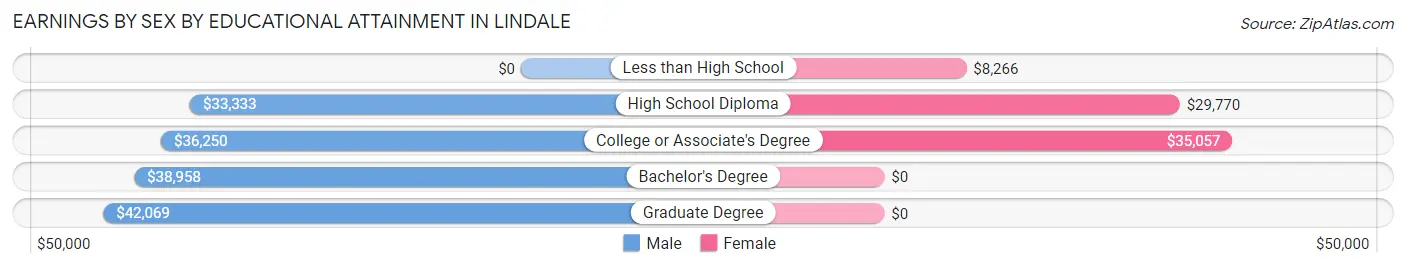
Earnings by Sex by Educational Attainment in Lindale
Average earnings in Lindale are $37,316 for men and $29,479 for women, a difference of 21.0%. Men with an educational attainment of graduate degree enjoy the highest average annual earnings of $42,069, while those with high school diploma education earn the least with $33,333. Women with an educational attainment of college or associate's degree earn the most with the average annual earnings of $35,057, while those with less than high school education have the smallest earnings of $8,266.
| Educational Attainment | Male Income | Female Income |
| Less than High School | - | - |
| High School Diploma | $33,333 | $29,770 |
| College or Associate's Degree | $36,250 | $35,057 |
| Bachelor's Degree | $38,958 | $0 |
| Graduate Degree | $42,069 | $0 |
| Total | $37,316 | $29,479 |
Family Income in Lindale
Family Income Brackets in Lindale
According to the Lindale family income data, there are 221 families falling into the $25,000 to $34,999 income range, which is the most common income bracket and makes up 20.2% of all families. Conversely, the less than $10,000 income bracket is the least frequent group with only 31 families (2.8%) belonging to this category.
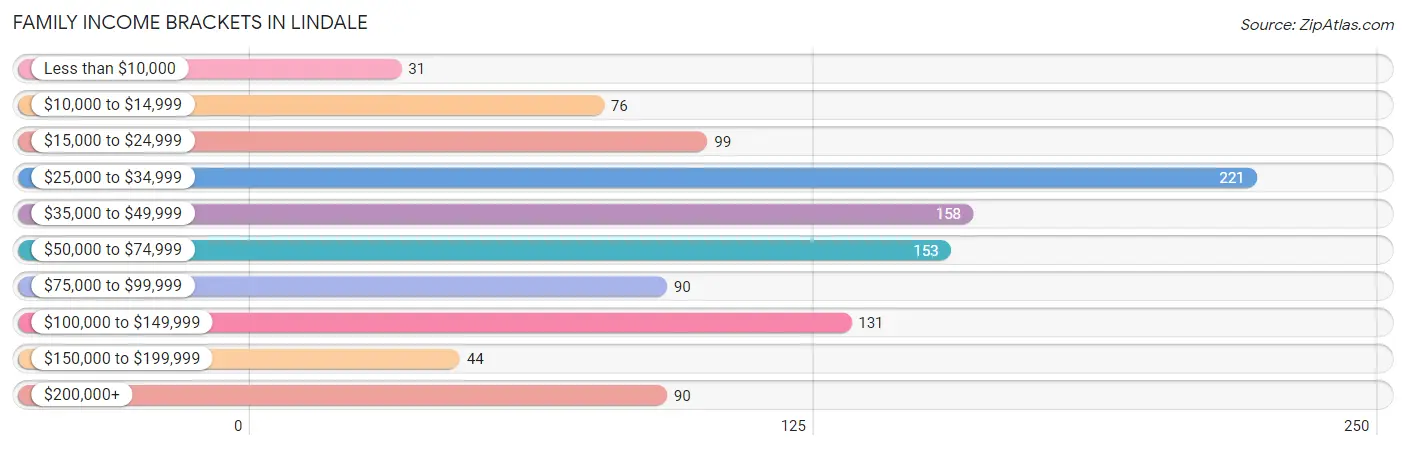
| Income Bracket | # Families | % Families |
| Less than $10,000 | 31 | 2.8% |
| $10,000 to $14,999 | 76 | 7.0% |
| $15,000 to $24,999 | 99 | 9.1% |
| $25,000 to $34,999 | 221 | 20.2% |
| $35,000 to $49,999 | 158 | 14.5% |
| $50,000 to $74,999 | 153 | 14.0% |
| $75,000 to $99,999 | 90 | 8.2% |
| $100,000 to $149,999 | 131 | 12.0% |
| $150,000 to $199,999 | 44 | 4.0% |
| $200,000+ | 90 | 8.2% |
Family Income by Famaliy Size in Lindale
4-person families (238 | 21.8%) account for the highest median family income in Lindale with $52,500 per family, while 2-person families (453 | 41.5%) have the highest median income of $21,116 per family member.
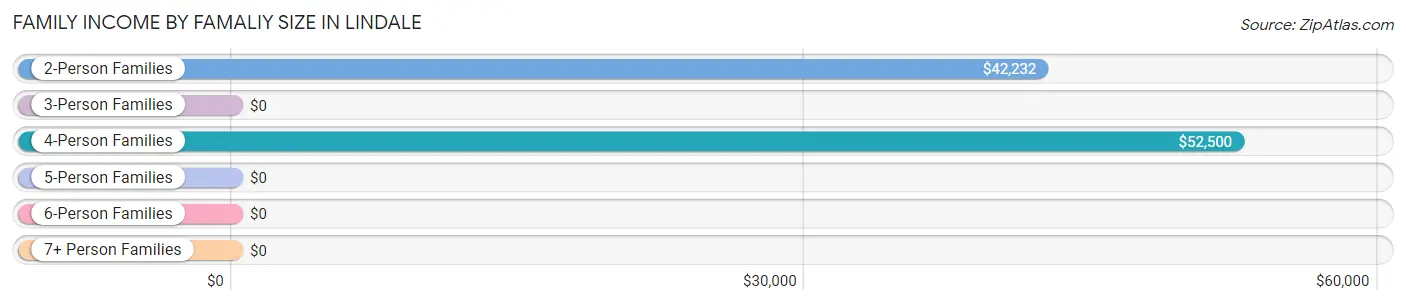
| Income Bracket | # Families | Median Income |
| 2-Person Families | 453 (41.5%) | $42,232 |
| 3-Person Families | 327 (29.9%) | $0 |
| 4-Person Families | 238 (21.8%) | $52,500 |
| 5-Person Families | 29 (2.7%) | $0 |
| 6-Person Families | 41 (3.7%) | $0 |
| 7+ Person Families | 4 (0.4%) | $0 |
| Total | 1,092 (100.0%) | $46,601 |
Family Income by Number of Earners in Lindale
The median family income in Lindale is $46,601, with families comprising 3+ earners (74) having the highest median family income of $250,001, while families with no earners (166) have the lowest median family income of $21,500, accounting for 6.8% and 15.2% of families, respectively.
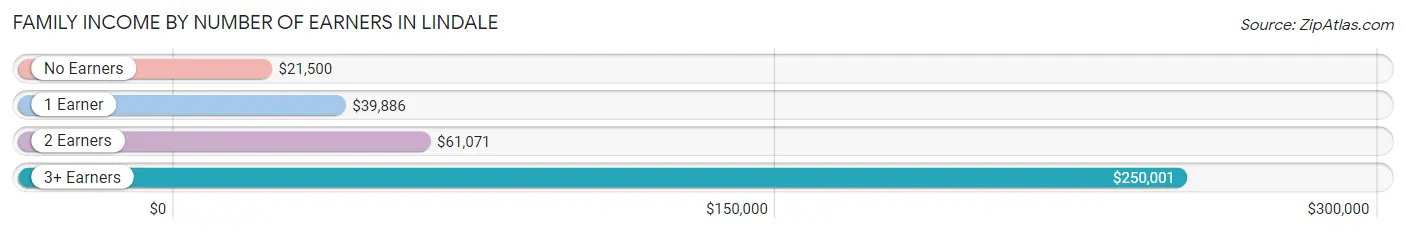
| Number of Earners | # Families | Median Income |
| No Earners | 166 (15.2%) | $21,500 |
| 1 Earner | 440 (40.3%) | $39,886 |
| 2 Earners | 412 (37.7%) | $61,071 |
| 3+ Earners | 74 (6.8%) | $250,001 |
| Total | 1,092 (100.0%) | $46,601 |
Household Income in Lindale
Household Income Brackets in Lindale
With 285 households falling in the category, the $10,000 to $14,999 income range is the most frequent in Lindale, accounting for 17.0% of all households. In contrast, only 62 households (3.7%) fall into the $150,000 to $199,999 income bracket, making it the least populous group.
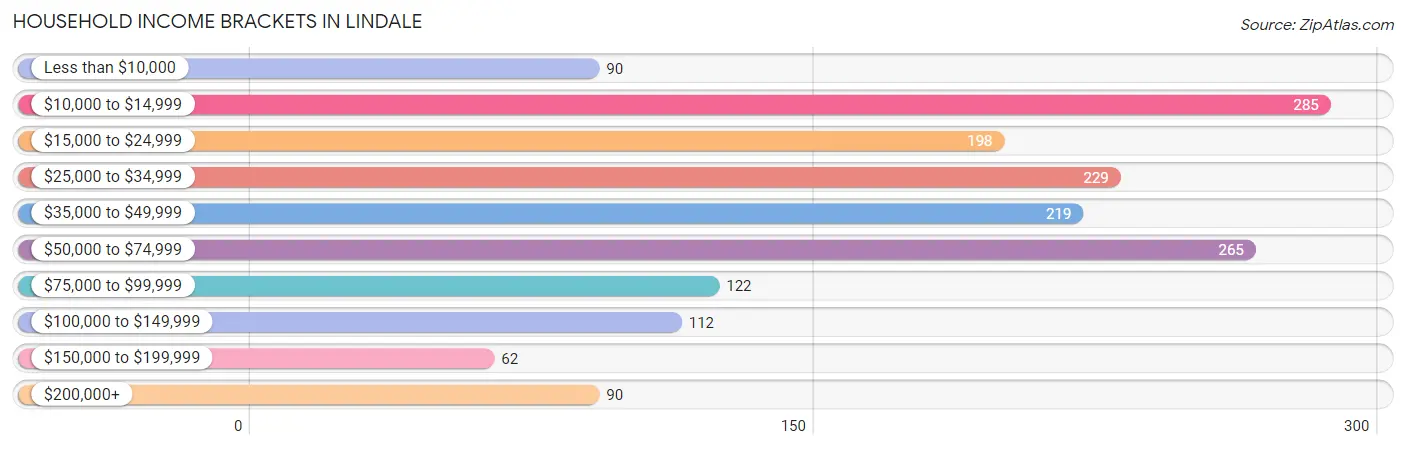
| Income Bracket | # Households | % Households |
| Less than $10,000 | 90 | 5.4% |
| $10,000 to $14,999 | 285 | 17.0% |
| $15,000 to $24,999 | 198 | 11.8% |
| $25,000 to $34,999 | 229 | 13.7% |
| $35,000 to $49,999 | 219 | 13.1% |
| $50,000 to $74,999 | 265 | 15.8% |
| $75,000 to $99,999 | 122 | 7.3% |
| $100,000 to $149,999 | 112 | 6.7% |
| $150,000 to $199,999 | 62 | 3.7% |
| $200,000+ | 90 | 5.4% |
Household Income by Householder Age in Lindale
The median household income in Lindale is $39,472, with the highest median household income of $47,788 found in the 45 to 64 years age bracket for the primary householder. A total of 529 households (31.6%) fall into this category. Meanwhile, the 15 to 24 years age bracket for the primary householder has the lowest median household income of $11,506, with 241 households (14.4%) in this group.
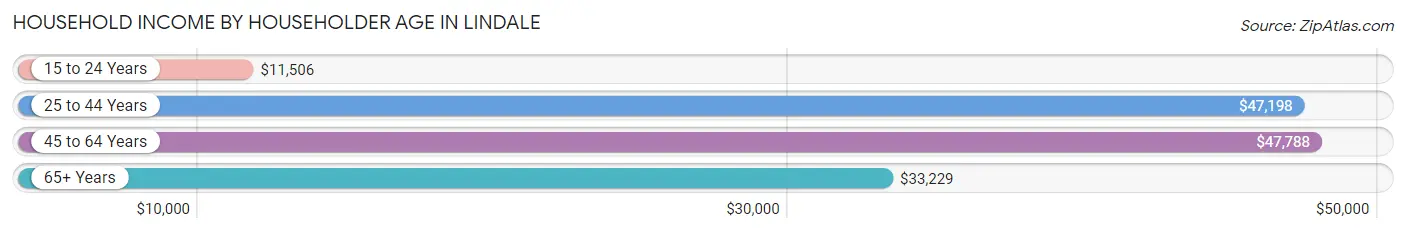
| Income Bracket | # Households | Median Income |
| 15 to 24 Years | 241 (14.4%) | $11,506 |
| 25 to 44 Years | 502 (30.0%) | $47,198 |
| 45 to 64 Years | 529 (31.6%) | $47,788 |
| 65+ Years | 403 (24.1%) | $33,229 |
| Total | 1,675 (100.0%) | $39,472 |
Poverty in Lindale
Income Below Poverty by Sex and Age in Lindale
With 27.4% poverty level for males and 26.1% for females among the residents of Lindale, 18 to 24 year old males and 65 to 74 year old females are the most vulnerable to poverty, with 319 males (73.0%) and 94 females (53.7%) in their respective age groups living below the poverty level.
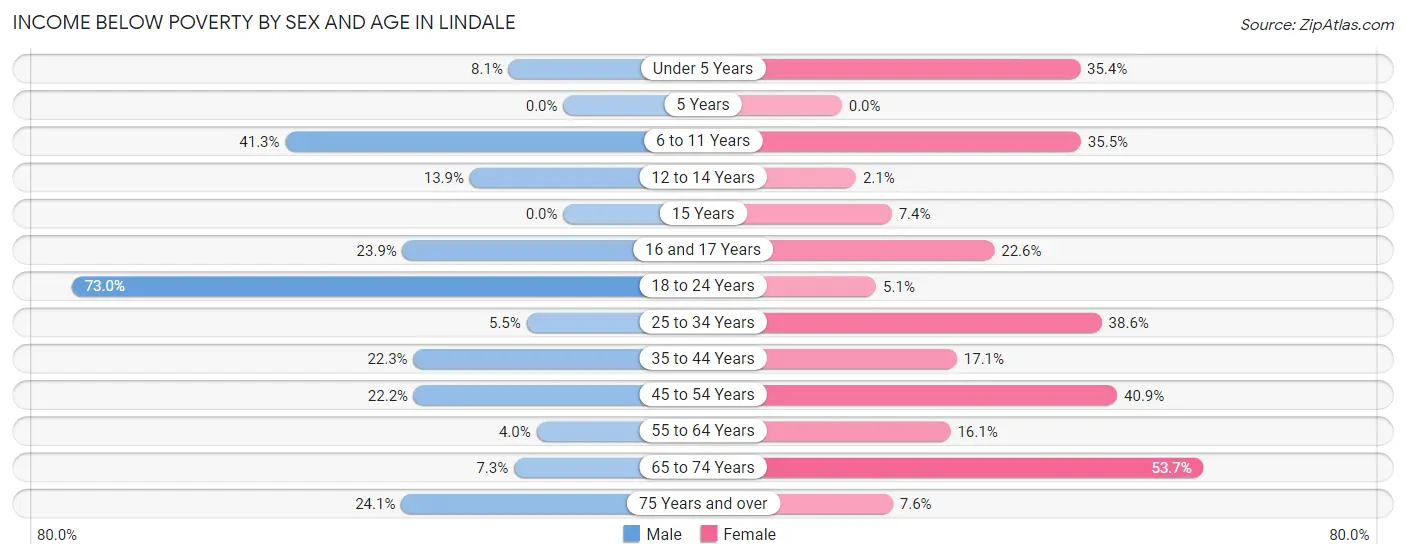
| Age Bracket | Male | Female |
| Under 5 Years | 3 (8.1%) | 23 (35.4%) |
| 5 Years | 0 (0.0%) | 0 (0.0%) |
| 6 to 11 Years | 97 (41.3%) | 76 (35.5%) |
| 12 to 14 Years | 5 (13.9%) | 3 (2.1%) |
| 15 Years | 0 (0.0%) | 2 (7.4%) |
| 16 and 17 Years | 21 (23.9%) | 12 (22.6%) |
| 18 to 24 Years | 319 (73.0%) | 10 (5.1%) |
| 25 to 34 Years | 14 (5.4%) | 137 (38.6%) |
| 35 to 44 Years | 63 (22.3%) | 34 (17.1%) |
| 45 to 54 Years | 75 (22.2%) | 139 (40.9%) |
| 55 to 64 Years | 13 (4.0%) | 41 (16.1%) |
| 65 to 74 Years | 12 (7.3%) | 94 (53.7%) |
| 75 Years and over | 13 (24.1%) | 16 (7.6%) |
| Total | 635 (27.4%) | 587 (26.1%) |
Income Above Poverty by Sex and Age in Lindale
According to the poverty statistics in Lindale, males aged 5 years and females aged 5 years are the age groups that are most secure financially, with 100.0% of males and 100.0% of females in these age groups living above the poverty line.
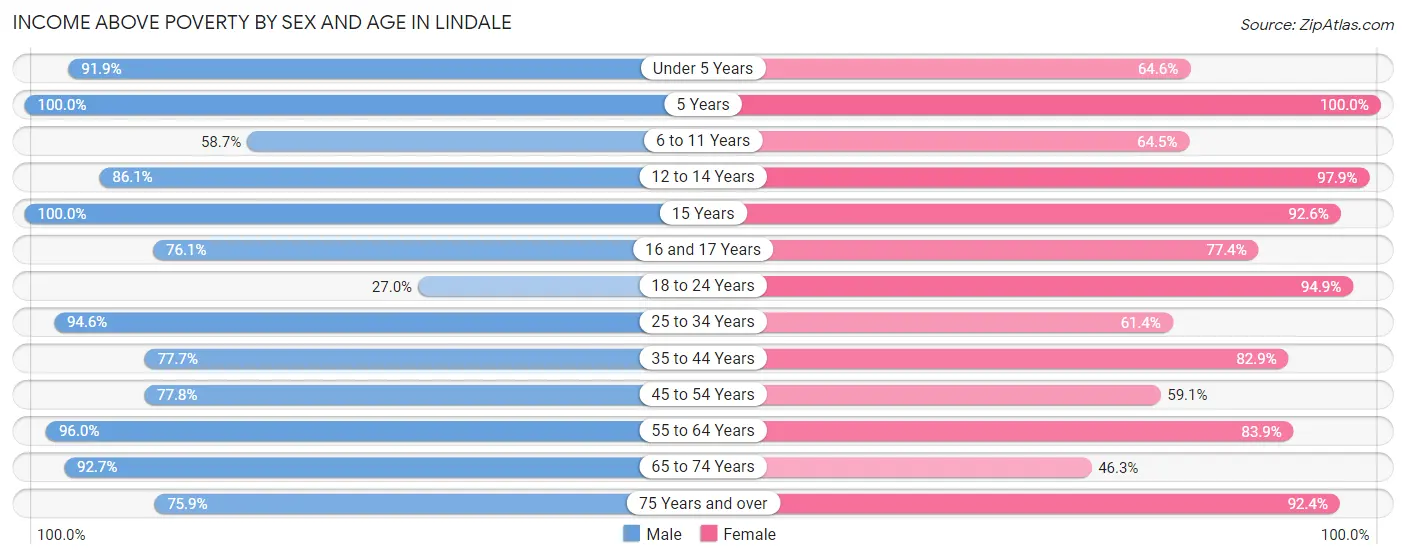
| Age Bracket | Male | Female |
| Under 5 Years | 34 (91.9%) | 42 (64.6%) |
| 5 Years | 5 (100.0%) | 16 (100.0%) |
| 6 to 11 Years | 138 (58.7%) | 138 (64.5%) |
| 12 to 14 Years | 31 (86.1%) | 140 (97.9%) |
| 15 Years | 59 (100.0%) | 25 (92.6%) |
| 16 and 17 Years | 67 (76.1%) | 41 (77.4%) |
| 18 to 24 Years | 118 (27.0%) | 186 (94.9%) |
| 25 to 34 Years | 243 (94.6%) | 218 (61.4%) |
| 35 to 44 Years | 220 (77.7%) | 165 (82.9%) |
| 45 to 54 Years | 263 (77.8%) | 201 (59.1%) |
| 55 to 64 Years | 314 (96.0%) | 213 (83.9%) |
| 65 to 74 Years | 152 (92.7%) | 81 (46.3%) |
| 75 Years and over | 41 (75.9%) | 195 (92.4%) |
| Total | 1,685 (72.6%) | 1,661 (73.9%) |
Income Below Poverty Among Married-Couple Families in Lindale
The poverty statistics for married-couple families in Lindale show that 9.5% or 65 of the total 684 families live below the poverty line. Families with 5 or more children have the highest poverty rate of 100.0%, comprising of 2 families. On the other hand, families with no children have the lowest poverty rate of 3.6%, which includes 12 families.
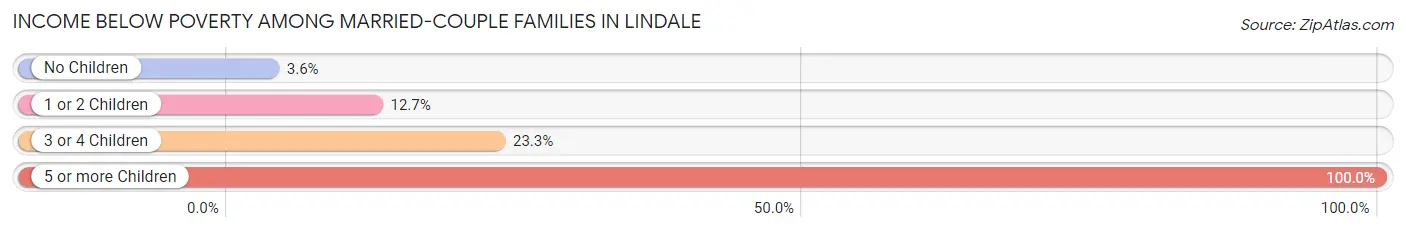
| Children | Above Poverty | Below Poverty |
| No Children | 318 (96.4%) | 12 (3.6%) |
| 1 or 2 Children | 255 (87.3%) | 37 (12.7%) |
| 3 or 4 Children | 46 (76.7%) | 14 (23.3%) |
| 5 or more Children | 0 (0.0%) | 2 (100.0%) |
| Total | 619 (90.5%) | 65 (9.5%) |
Income Below Poverty Among Single-Parent Households in Lindale
According to the poverty data in Lindale, 29.0% or 38 single-father households and 34.7% or 96 single-mother households are living below the poverty line. Among single-father households, those with 3 or 4 children have the highest poverty rate, with 7 households (100.0%) experiencing poverty. Likewise, among single-mother households, those with no children have the highest poverty rate, with 67 households (41.1%) falling below the poverty line.
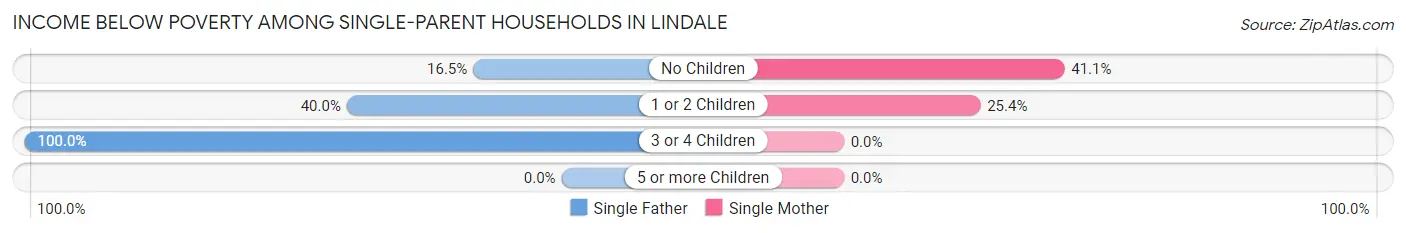
| Children | Single Father | Single Mother |
| No Children | 13 (16.5%) | 67 (41.1%) |
| 1 or 2 Children | 18 (40.0%) | 29 (25.4%) |
| 3 or 4 Children | 7 (100.0%) | 0 (0.0%) |
| 5 or more Children | 0 (0.0%) | 0 (0.0%) |
| Total | 38 (29.0%) | 96 (34.7%) |
Income Below Poverty Among Married-Couple vs Single-Parent Households in Lindale
The poverty data for Lindale shows that 65 of the married-couple family households (9.5%) and 134 of the single-parent households (32.8%) are living below the poverty level. Within the married-couple family households, those with 5 or more children have the highest poverty rate, with 2 households (100.0%) falling below the poverty line. Among the single-parent households, those with 3 or 4 children have the highest poverty rate, with 7 household (100.0%) living below poverty.
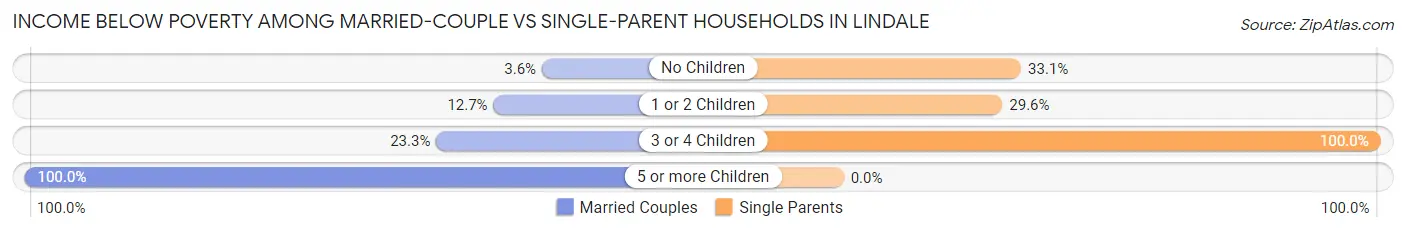
| Children | Married-Couple Families | Single-Parent Households |
| No Children | 12 (3.6%) | 80 (33.1%) |
| 1 or 2 Children | 37 (12.7%) | 47 (29.6%) |
| 3 or 4 Children | 14 (23.3%) | 7 (100.0%) |
| 5 or more Children | 2 (100.0%) | 0 (0.0%) |
| Total | 65 (9.5%) | 134 (32.8%) |
Race in Lindale
The most populous races in Lindale are White / Caucasian (3,924 | 85.9%), Two or more Races (393 | 8.6%), and Hispanic or Latino (247 | 5.4%).
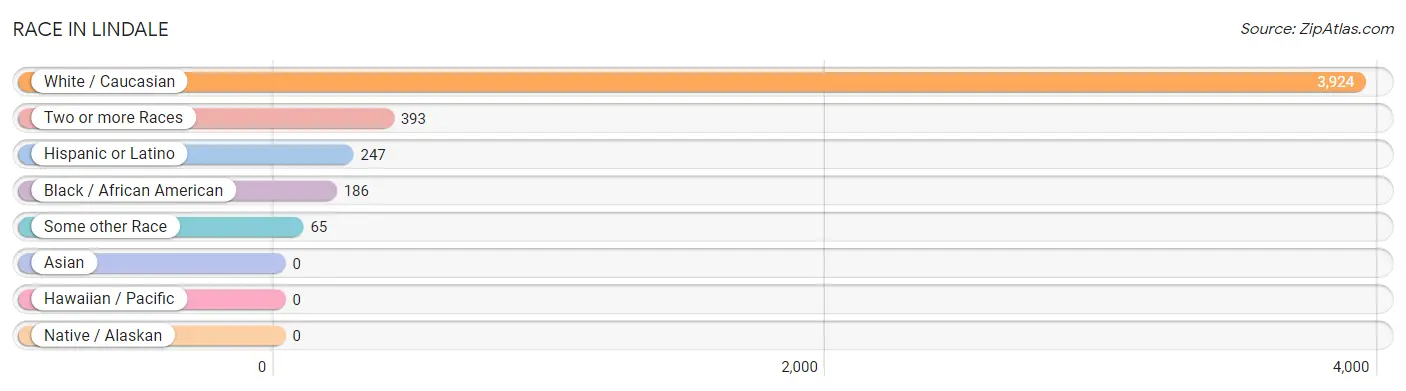
| Race | # Population | % Population |
| Asian | 0 | 0.0% |
| Black / African American | 186 | 4.1% |
| Hawaiian / Pacific | 0 | 0.0% |
| Hispanic or Latino | 247 | 5.4% |
| Native / Alaskan | 0 | 0.0% |
| White / Caucasian | 3,924 | 85.9% |
| Two or more Races | 393 | 8.6% |
| Some other Race | 65 | 1.4% |
| Total | 4,568 | 100.0% |
Ancestry in Lindale
The most populous ancestries reported in Lindale are American (752 | 16.5%), English (624 | 13.7%), German (569 | 12.5%), Irish (551 | 12.1%), and Mexican (162 | 3.5%), together accounting for 58.2% of all Lindale residents.
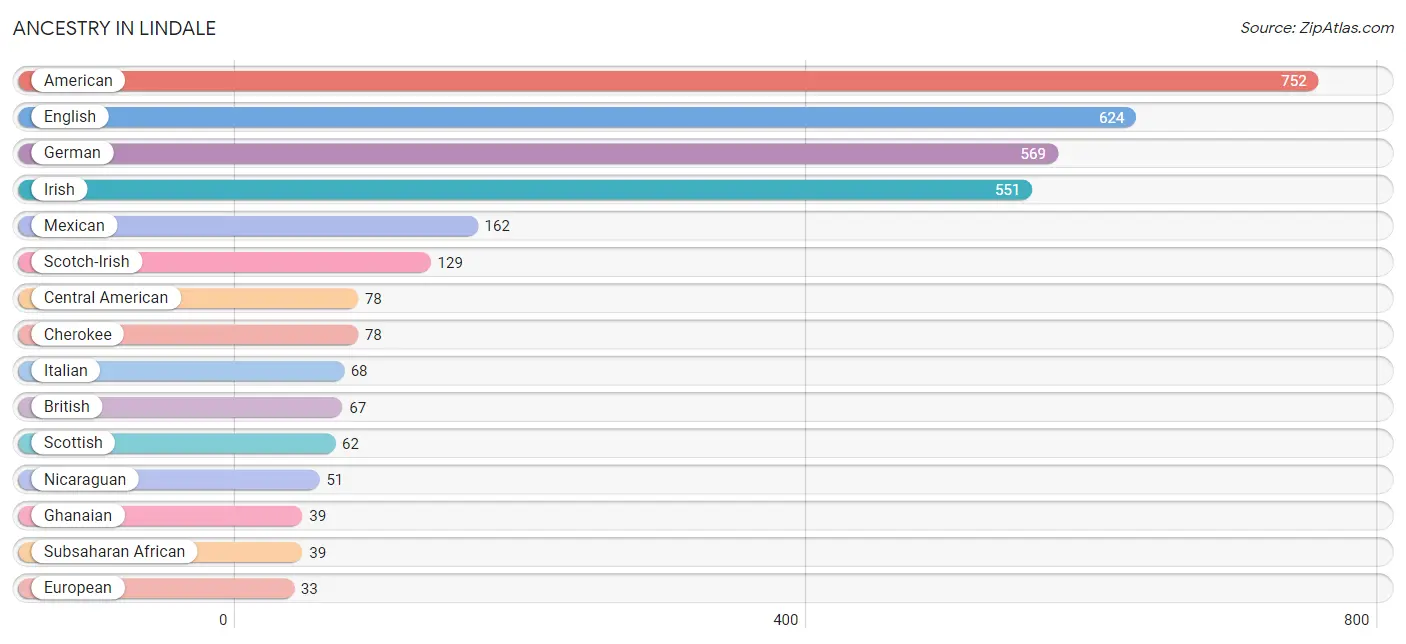
| Ancestry | # Population | % Population |
| American | 752 | 16.5% |
| British | 67 | 1.5% |
| Central American | 78 | 1.7% |
| Cherokee | 78 | 1.7% |
| Dutch | 27 | 0.6% |
| English | 624 | 13.7% |
| European | 33 | 0.7% |
| French | 9 | 0.2% |
| German | 569 | 12.5% |
| Ghanaian | 39 | 0.9% |
| Guatemalan | 27 | 0.6% |
| Hungarian | 7 | 0.2% |
| Irish | 551 | 12.1% |
| Italian | 68 | 1.5% |
| Mexican | 162 | 3.5% |
| Mexican American Indian | 8 | 0.2% |
| Nicaraguan | 51 | 1.1% |
| Norwegian | 13 | 0.3% |
| Polish | 28 | 0.6% |
| Scotch-Irish | 129 | 2.8% |
| Scottish | 62 | 1.4% |
| Subsaharan African | 39 | 0.9% |
| Swedish | 7 | 0.2% |
| Welsh | 15 | 0.3% | View All 24 Rows |
Immigrants in Lindale
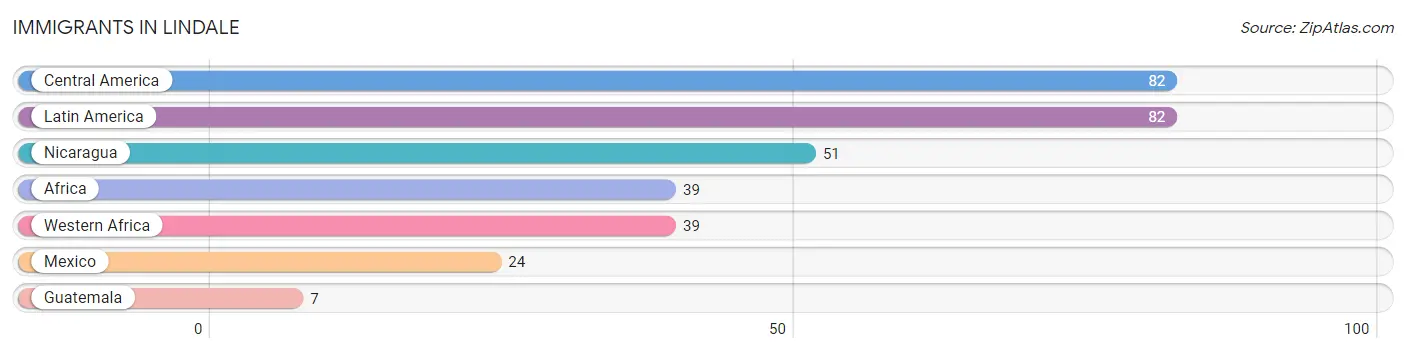
The most numerous immigrant groups reported in Lindale came from Central America (82 | 1.8%), Latin America (82 | 1.8%), Nicaragua (51 | 1.1%), Africa (39 | 0.9%), and Western Africa (39 | 0.9%), together accounting for 6.4% of all Lindale residents.
| Immigration Origin | # Population | % Population |
| Africa | 39 | 0.9% |
| Central America | 82 | 1.8% |
| Guatemala | 7 | 0.2% |
| Latin America | 82 | 1.8% |
| Mexico | 24 | 0.5% |
| Nicaragua | 51 | 1.1% |
| Western Africa | 39 | 0.9% | View All 7 Rows |
Sex and Age in Lindale
Sex and Age in Lindale
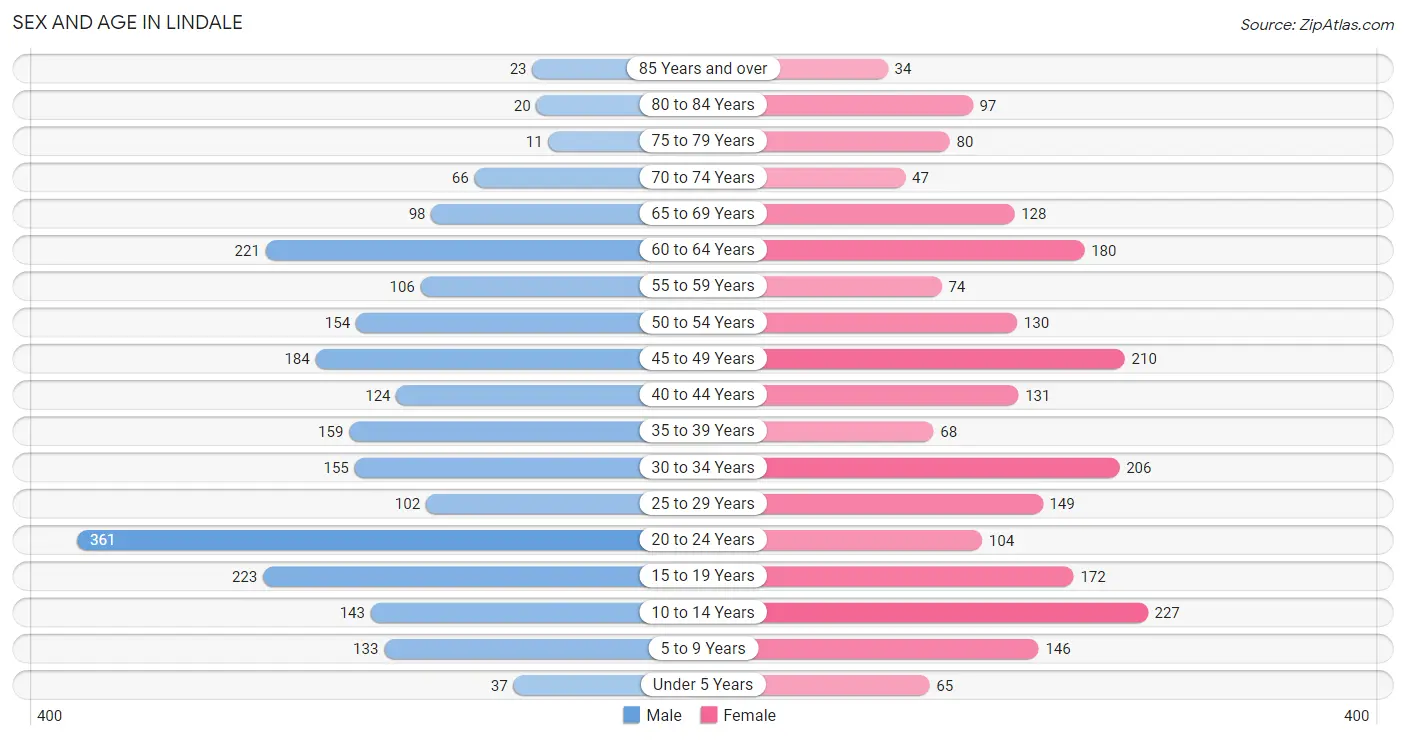
The most populous age groups in Lindale are 20 to 24 Years (361 | 15.6%) for men and 10 to 14 Years (227 | 10.1%) for women.
| Age Bracket | Male | Female |
| Under 5 Years | 37 (1.6%) | 65 (2.9%) |
| 5 to 9 Years | 133 (5.7%) | 146 (6.5%) |
| 10 to 14 Years | 143 (6.2%) | 227 (10.1%) |
| 15 to 19 Years | 223 (9.6%) | 172 (7.6%) |
| 20 to 24 Years | 361 (15.6%) | 104 (4.6%) |
| 25 to 29 Years | 102 (4.4%) | 149 (6.6%) |
| 30 to 34 Years | 155 (6.7%) | 206 (9.2%) |
| 35 to 39 Years | 159 (6.9%) | 68 (3.0%) |
| 40 to 44 Years | 124 (5.3%) | 131 (5.8%) |
| 45 to 49 Years | 184 (7.9%) | 210 (9.3%) |
| 50 to 54 Years | 154 (6.6%) | 130 (5.8%) |
| 55 to 59 Years | 106 (4.6%) | 74 (3.3%) |
| 60 to 64 Years | 221 (9.5%) | 180 (8.0%) |
| 65 to 69 Years | 98 (4.2%) | 128 (5.7%) |
| 70 to 74 Years | 66 (2.8%) | 47 (2.1%) |
| 75 to 79 Years | 11 (0.5%) | 80 (3.6%) |
| 80 to 84 Years | 20 (0.9%) | 97 (4.3%) |
| 85 Years and over | 23 (1.0%) | 34 (1.5%) |
| Total | 2,320 (100.0%) | 2,248 (100.0%) |
Families and Households in Lindale
Median Family Size in Lindale
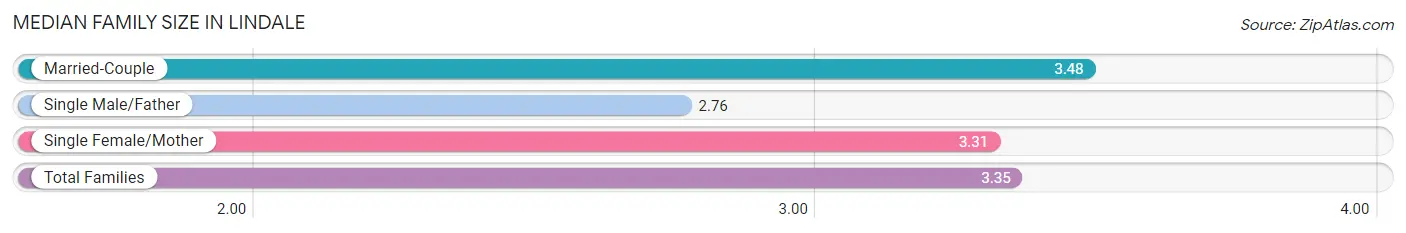
The median family size in Lindale is 3.35 persons per family, with married-couple families (684 | 62.6%) accounting for the largest median family size of 3.48 persons per family. On the other hand, single male/father families (131 | 12.0%) represent the smallest median family size with 2.76 persons per family.
| Family Type | # Families | Family Size |
| Married-Couple | 684 (62.6%) | 3.48 |
| Single Male/Father | 131 (12.0%) | 2.76 |
| Single Female/Mother | 277 (25.4%) | 3.31 |
| Total Families | 1,092 (100.0%) | 3.35 |
Median Household Size in Lindale
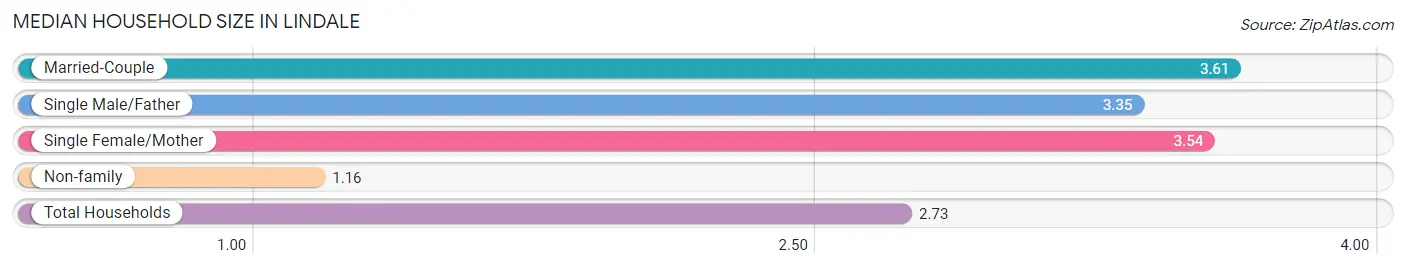
The median household size in Lindale is 2.73 persons per household, with married-couple households (684 | 40.8%) accounting for the largest median household size of 3.61 persons per household. non-family households (583 | 34.8%) represent the smallest median household size with 1.16 persons per household.
| Household Type | # Households | Household Size |
| Married-Couple | 684 (40.8%) | 3.61 |
| Single Male/Father | 131 (7.8%) | 3.35 |
| Single Female/Mother | 277 (16.5%) | 3.54 |
| Non-family | 583 (34.8%) | 1.16 |
| Total Households | 1,675 (100.0%) | 2.73 |
Household Size by Marriage Status in Lindale
Out of a total of 1,675 households in Lindale, 1,092 (65.2%) are family households, while 583 (34.8%) are nonfamily households. The most numerous type of family households are 2-person households, comprising 392, and the most common type of nonfamily households are 1-person households, comprising 333.
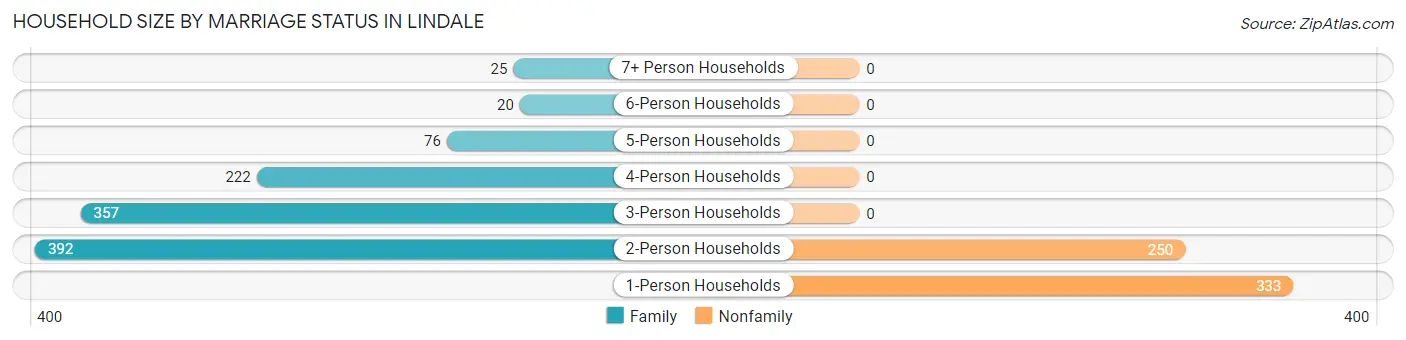
| Household Size | Family Households | Nonfamily Households |
| 1-Person Households | - | 333 (19.9%) |
| 2-Person Households | 392 (23.4%) | 250 (14.9%) |
| 3-Person Households | 357 (21.3%) | 0 (0.0%) |
| 4-Person Households | 222 (13.3%) | 0 (0.0%) |
| 5-Person Households | 76 (4.5%) | 0 (0.0%) |
| 6-Person Households | 20 (1.2%) | 0 (0.0%) |
| 7+ Person Households | 25 (1.5%) | 0 (0.0%) |
| Total | 1,092 (65.2%) | 583 (34.8%) |
Female Fertility in Lindale
Fertility by Age in Lindale
Average fertility rate in Lindale is 34.0 births per 1,000 women. Women in the age bracket of 20 to 34 years have the highest fertility rate with 50.0 births per 1,000 women. Women in the age bracket of 20 to 34 years acount for 65.7% of all women with births.
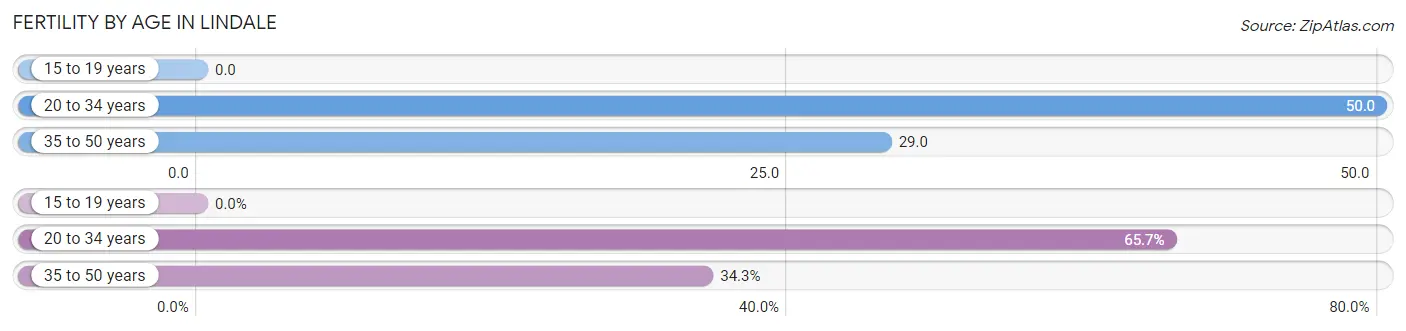
| Age Bracket | Women with Births | Births / 1,000 Women |
| 15 to 19 years | 0 (0.0%) | 0.0 |
| 20 to 34 years | 23 (65.7%) | 50.0 |
| 35 to 50 years | 12 (34.3%) | 29.0 |
| Total | 35 (100.0%) | 34.0 |
Fertility by Age by Marriage Status in Lindale
74.3% of women with births (35) in Lindale are married. The highest percentage of unmarried women with births falls into 20 to 34 years age bracket with 39.1% of them unmarried at the time of birth, while the lowest percentage of unmarried women with births belong to 35 to 50 years age bracket with 0.0% of them unmarried.
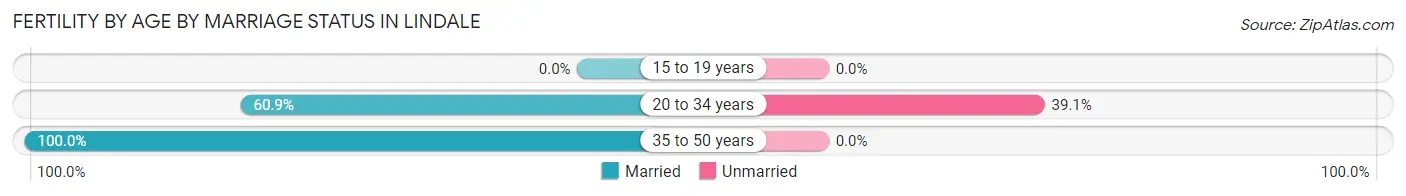
| Age Bracket | Married | Unmarried |
| 15 to 19 years | 0 (0.0%) | 0 (0.0%) |
| 20 to 34 years | 14 (60.9%) | 9 (39.1%) |
| 35 to 50 years | 12 (100.0%) | 0 (0.0%) |
| Total | 26 (74.3%) | 9 (25.7%) |
Fertility by Education in Lindale
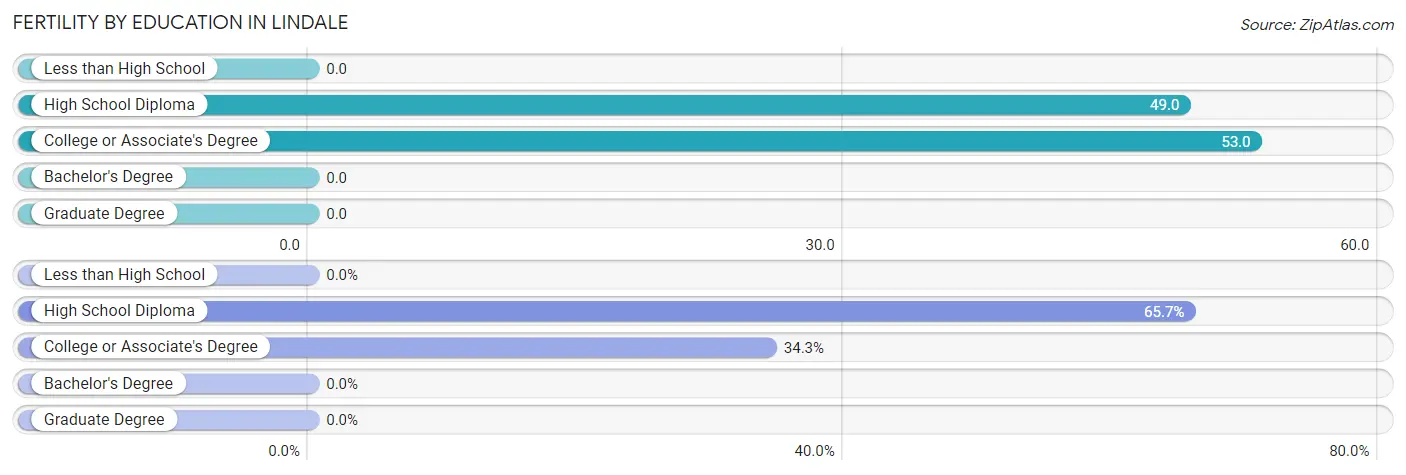
| Educational Attainment | Women with Births | Births / 1,000 Women |
| Less than High School | 0 (0.0%) | 0.0 |
| High School Diploma | 23 (65.7%) | 49.0 |
| College or Associate's Degree | 12 (34.3%) | 53.0 |
| Bachelor's Degree | 0 (0.0%) | 0.0 |
| Graduate Degree | 0 (0.0%) | 0.0 |
| Total | 35 (100.0%) | 34.0 |
Fertility by Education by Marriage Status in Lindale
25.7% of women with births in Lindale are unmarried. Women with the educational attainment of college or associate's degree are most likely to be married with 100.0% of them married at childbirth, while women with the educational attainment of high school diploma are least likely to be married with 39.1% of them unmarried at childbirth.
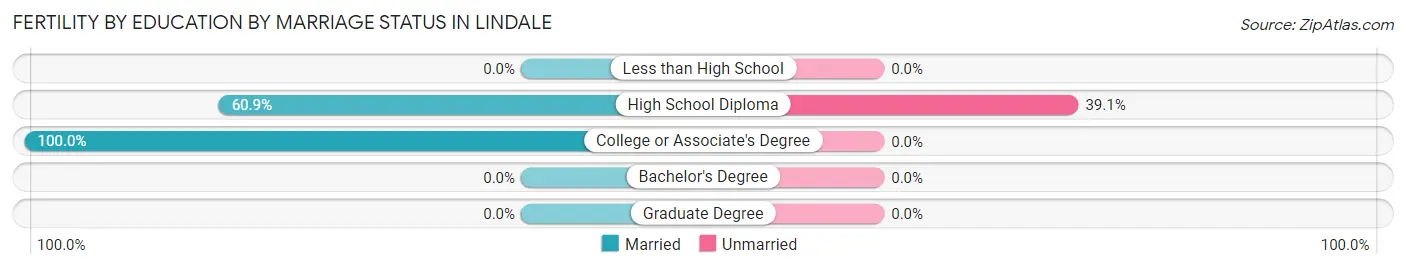
| Educational Attainment | Married | Unmarried |
| Less than High School | 0 (0.0%) | 0 (0.0%) |
| High School Diploma | 14 (60.9%) | 9 (39.1%) |
| College or Associate's Degree | 12 (100.0%) | 0 (0.0%) |
| Bachelor's Degree | 0 (0.0%) | 0 (0.0%) |
| Graduate Degree | 0 (0.0%) | 0 (0.0%) |
| Total | 26 (74.3%) | 9 (25.7%) |
Employment Characteristics in Lindale
Employment by Class of Employer in Lindale
Among the 1,967 employed individuals in Lindale, private company employees (1,587 | 80.7%), local government employees (131 | 6.7%), and federal government employees (78 | 4.0%) make up the most common classes of employment.
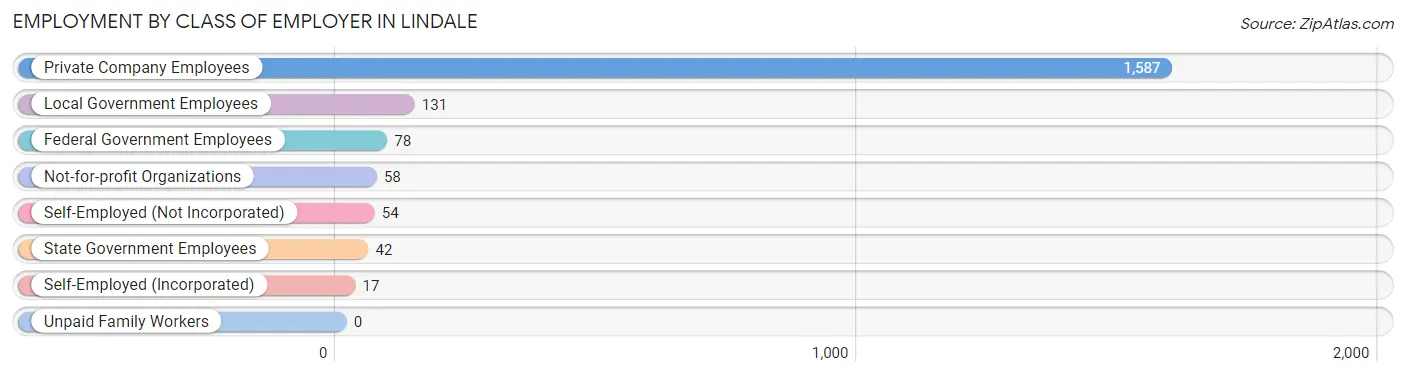
| Employer Class | # Employees | % Employees |
| Private Company Employees | 1,587 | 80.7% |
| Self-Employed (Incorporated) | 17 | 0.9% |
| Self-Employed (Not Incorporated) | 54 | 2.8% |
| Not-for-profit Organizations | 58 | 2.9% |
| Local Government Employees | 131 | 6.7% |
| State Government Employees | 42 | 2.1% |
| Federal Government Employees | 78 | 4.0% |
| Unpaid Family Workers | 0 | 0.0% |
| Total | 1,967 | 100.0% |
Employment Status by Age in Lindale
According to the labor force statistics for Lindale, out of the total population over 16 years of age (3,731), 56.0% or 2,089 individuals are in the labor force, with 5.8% or 121 of them unemployed. The age group with the highest labor force participation rate is 25 to 29 years, with 90.4% or 227 individuals in the labor force. Within the labor force, the 16 to 19 years age range has the highest percentage of unemployed individuals, with 14.2% or 32 of them being unemployed.
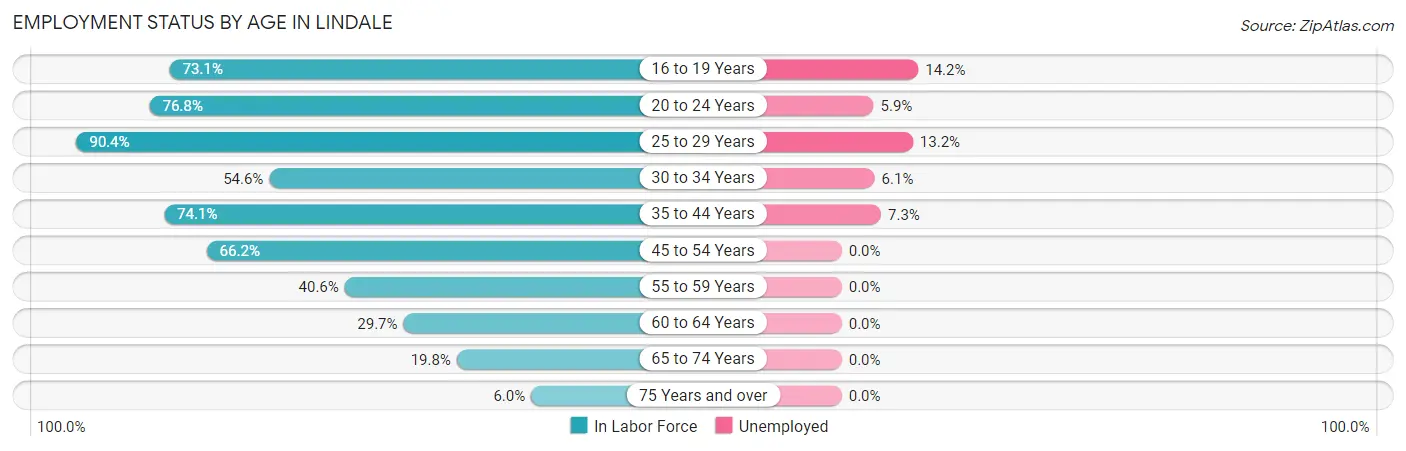
| Age Bracket | In Labor Force | Unemployed |
| 16 to 19 Years | 226 (73.1%) | 32 (14.2%) |
| 20 to 24 Years | 357 (76.8%) | 21 (5.9%) |
| 25 to 29 Years | 227 (90.4%) | 30 (13.2%) |
| 30 to 34 Years | 197 (54.6%) | 12 (6.1%) |
| 35 to 44 Years | 357 (74.1%) | 26 (7.3%) |
| 45 to 54 Years | 449 (66.2%) | 0 (0.0%) |
| 55 to 59 Years | 73 (40.6%) | 0 (0.0%) |
| 60 to 64 Years | 119 (29.7%) | 0 (0.0%) |
| 65 to 74 Years | 67 (19.8%) | 0 (0.0%) |
| 75 Years and over | 16 (6.0%) | 0 (0.0%) |
| Total | 2,089 (56.0%) | 121 (5.8%) |
Employment Status by Educational Attainment in Lindale
According to labor force statistics for Lindale, 60.4% of individuals (1,421) out of the total population between 25 and 64 years of age (2,353) are in the labor force, with 4.8% or 68 of them being unemployed. The group with the highest labor force participation rate are those with the educational attainment of bachelor's degree or higher, with 86.3% or 314 individuals in the labor force. Within the labor force, individuals with bachelor's degree or higher education have the highest percentage of unemployment, with 9.6% or 30 of them being unemployed.
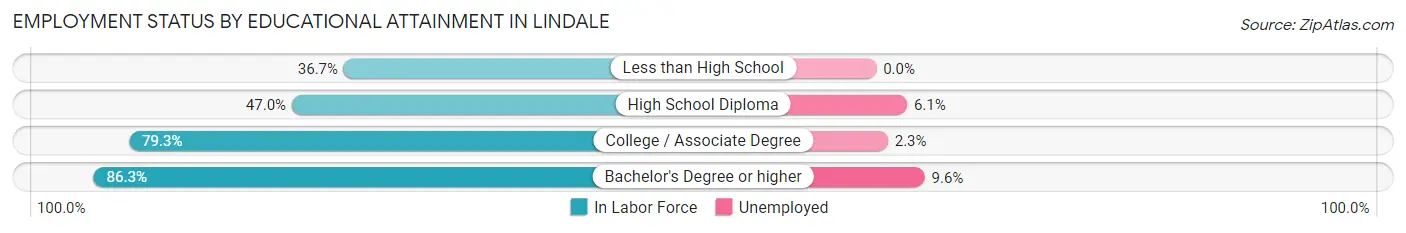
| Educational Attainment | In Labor Force | Unemployed |
| Less than High School | 153 (36.7%) | 0 (0.0%) |
| High School Diploma | 424 (47.0%) | 55 (6.1%) |
| College / Associate Degree | 531 (79.3%) | 15 (2.3%) |
| Bachelor's Degree or higher | 314 (86.3%) | 35 (9.6%) |
| Total | 1,421 (60.4%) | 113 (4.8%) |
Employment Occupations by Sex in Lindale
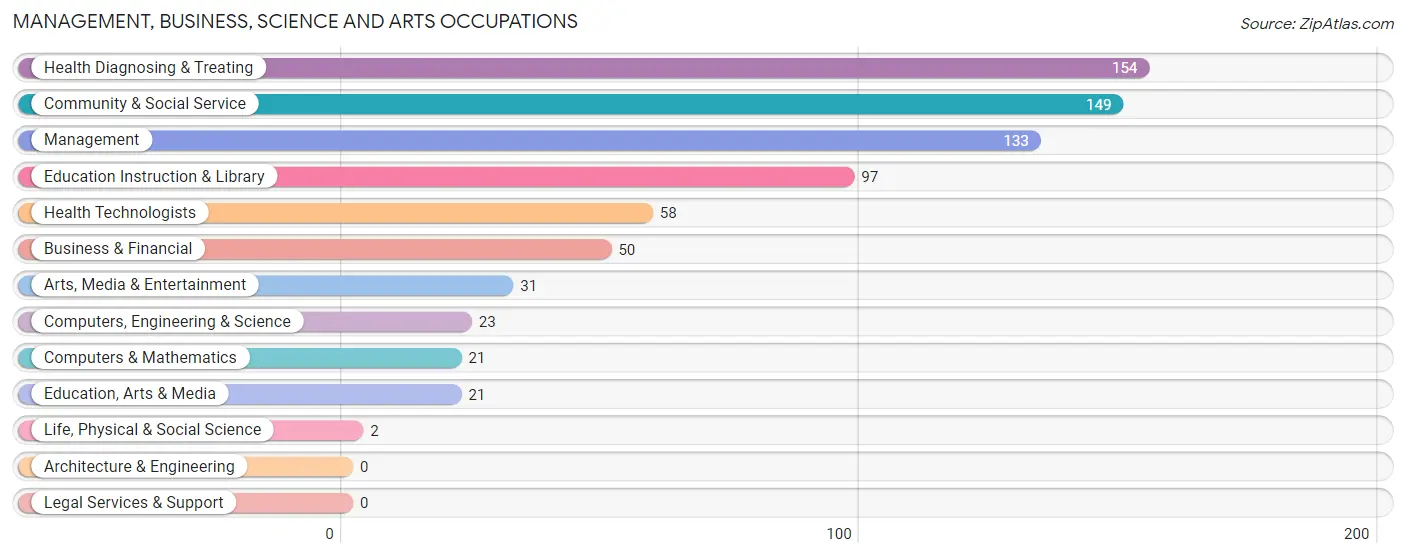
Management, Business, Science and Arts Occupations
The most common Management, Business, Science and Arts occupations in Lindale are Health Diagnosing & Treating (154 | 7.8%), Community & Social Service (149 | 7.6%), Management (133 | 6.8%), Education Instruction & Library (97 | 4.9%), and Health Technologists (58 | 2.9%).
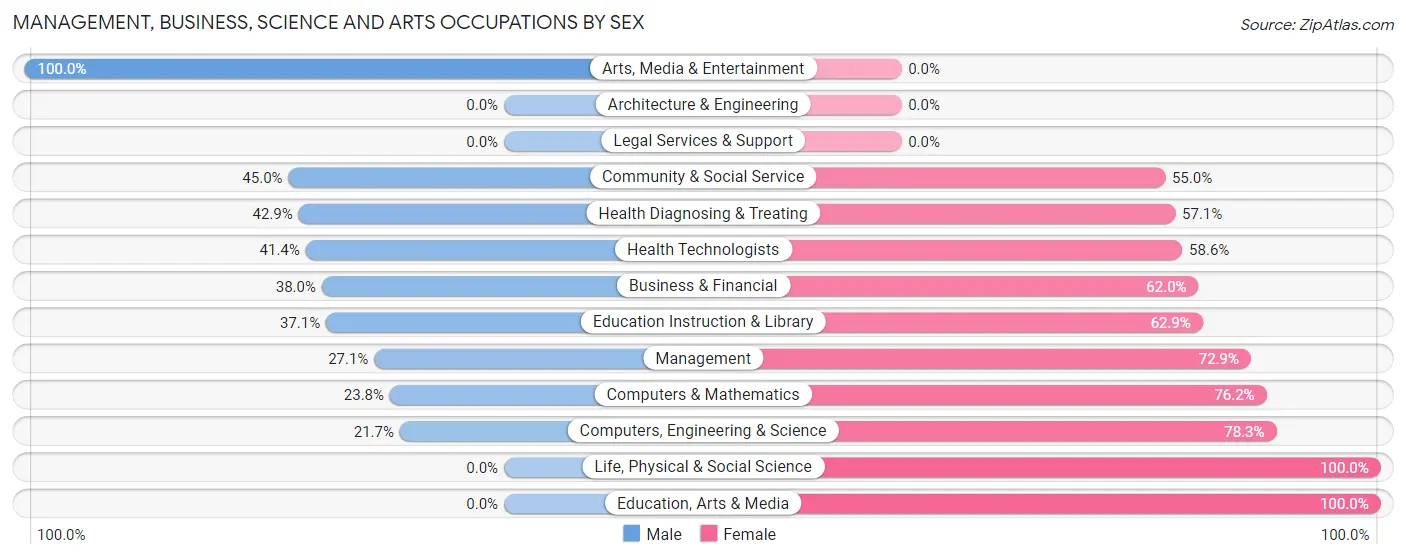
Management, Business, Science and Arts Occupations by Sex
Within the Management, Business, Science and Arts occupations in Lindale, the most male-oriented occupations are Arts, Media & Entertainment (100.0%), Community & Social Service (45.0%), and Health Diagnosing & Treating (42.9%), while the most female-oriented occupations are Life, Physical & Social Science (100.0%), Education, Arts & Media (100.0%), and Computers, Engineering & Science (78.3%).
| Occupation | Male | Female |
| Management | 36 (27.1%) | 97 (72.9%) |
| Business & Financial | 19 (38.0%) | 31 (62.0%) |
| Computers, Engineering & Science | 5 (21.7%) | 18 (78.3%) |
| Computers & Mathematics | 5 (23.8%) | 16 (76.2%) |
| Architecture & Engineering | 0 (0.0%) | 0 (0.0%) |
| Life, Physical & Social Science | 0 (0.0%) | 2 (100.0%) |
| Community & Social Service | 67 (45.0%) | 82 (55.0%) |
| Education, Arts & Media | 0 (0.0%) | 21 (100.0%) |
| Legal Services & Support | 0 (0.0%) | 0 (0.0%) |
| Education Instruction & Library | 36 (37.1%) | 61 (62.9%) |
| Arts, Media & Entertainment | 31 (100.0%) | 0 (0.0%) |
| Health Diagnosing & Treating | 66 (42.9%) | 88 (57.1%) |
| Health Technologists | 24 (41.4%) | 34 (58.6%) |
| Total (Category) | 193 (37.9%) | 316 (62.1%) |
| Total (Overall) | 1,173 (59.6%) | 794 (40.4%) |
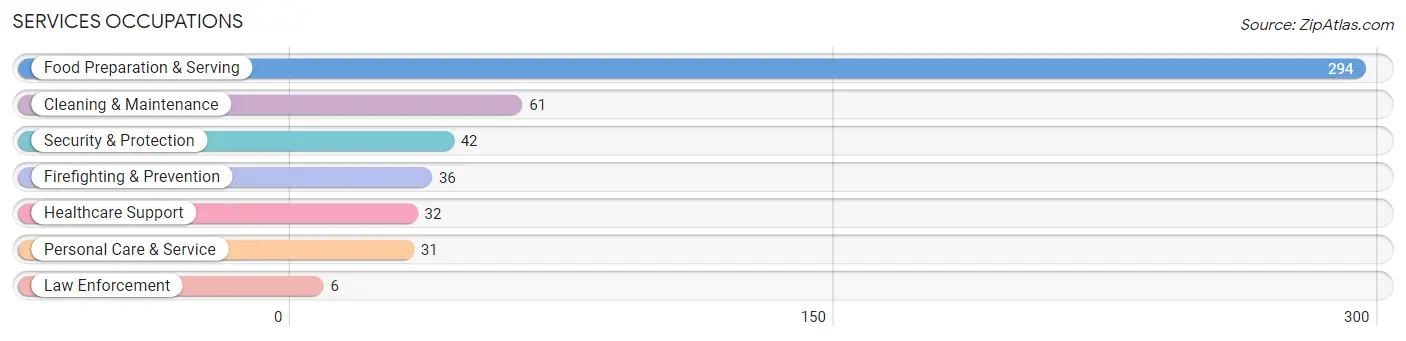
Services Occupations
The most common Services occupations in Lindale are Food Preparation & Serving (294 | 14.9%), Cleaning & Maintenance (61 | 3.1%), Security & Protection (42 | 2.1%), Firefighting & Prevention (36 | 1.8%), and Healthcare Support (32 | 1.6%).
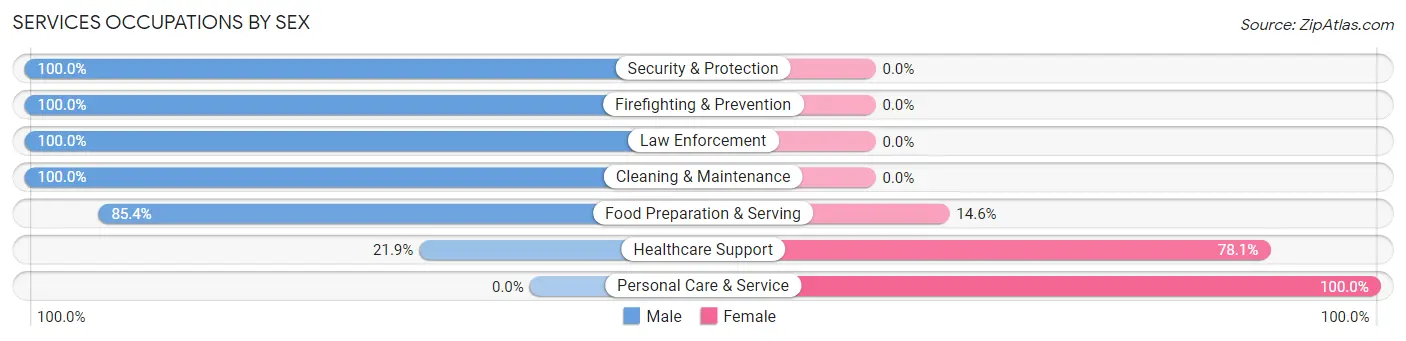
Services Occupations by Sex
Within the Services occupations in Lindale, the most male-oriented occupations are Security & Protection (100.0%), Firefighting & Prevention (100.0%), and Law Enforcement (100.0%), while the most female-oriented occupations are Personal Care & Service (100.0%), Healthcare Support (78.1%), and Food Preparation & Serving (14.6%).
| Occupation | Male | Female |
| Healthcare Support | 7 (21.9%) | 25 (78.1%) |
| Security & Protection | 42 (100.0%) | 0 (0.0%) |
| Firefighting & Prevention | 36 (100.0%) | 0 (0.0%) |
| Law Enforcement | 6 (100.0%) | 0 (0.0%) |
| Food Preparation & Serving | 251 (85.4%) | 43 (14.6%) |
| Cleaning & Maintenance | 61 (100.0%) | 0 (0.0%) |
| Personal Care & Service | 0 (0.0%) | 31 (100.0%) |
| Total (Category) | 361 (78.5%) | 99 (21.5%) |
| Total (Overall) | 1,173 (59.6%) | 794 (40.4%) |
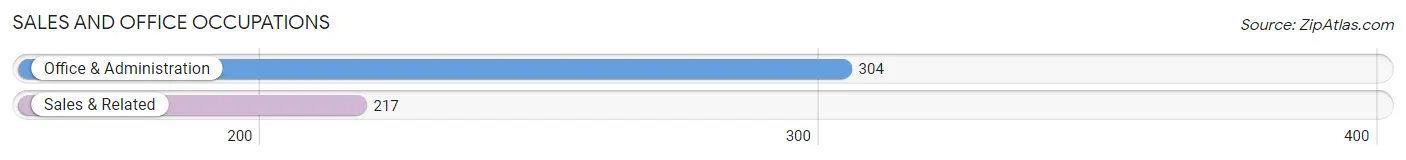
Sales and Office Occupations
The most common Sales and Office occupations in Lindale are Office & Administration (304 | 15.5%), and Sales & Related (217 | 11.0%).
Sales and Office Occupations by Sex
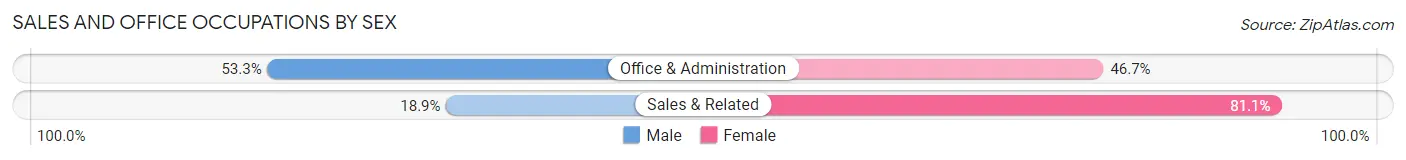
| Occupation | Male | Female |
| Sales & Related | 41 (18.9%) | 176 (81.1%) |
| Office & Administration | 162 (53.3%) | 142 (46.7%) |
| Total (Category) | 203 (39.0%) | 318 (61.0%) |
| Total (Overall) | 1,173 (59.6%) | 794 (40.4%) |
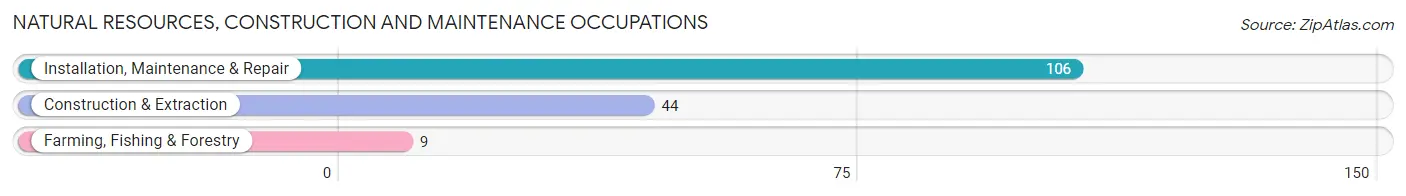
Natural Resources, Construction and Maintenance Occupations
The most common Natural Resources, Construction and Maintenance occupations in Lindale are Installation, Maintenance & Repair (106 | 5.4%), Construction & Extraction (44 | 2.2%), and Farming, Fishing & Forestry (9 | 0.5%).
Natural Resources, Construction and Maintenance Occupations by Sex
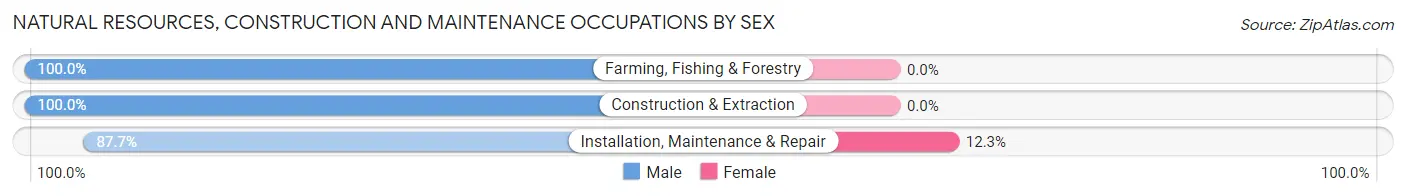
| Occupation | Male | Female |
| Farming, Fishing & Forestry | 9 (100.0%) | 0 (0.0%) |
| Construction & Extraction | 44 (100.0%) | 0 (0.0%) |
| Installation, Maintenance & Repair | 93 (87.7%) | 13 (12.3%) |
| Total (Category) | 146 (91.8%) | 13 (8.2%) |
| Total (Overall) | 1,173 (59.6%) | 794 (40.4%) |
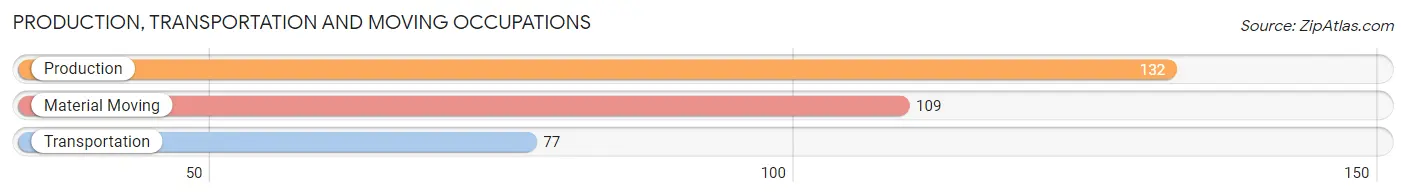
Production, Transportation and Moving Occupations
The most common Production, Transportation and Moving occupations in Lindale are Production (132 | 6.7%), Material Moving (109 | 5.5%), and Transportation (77 | 3.9%).
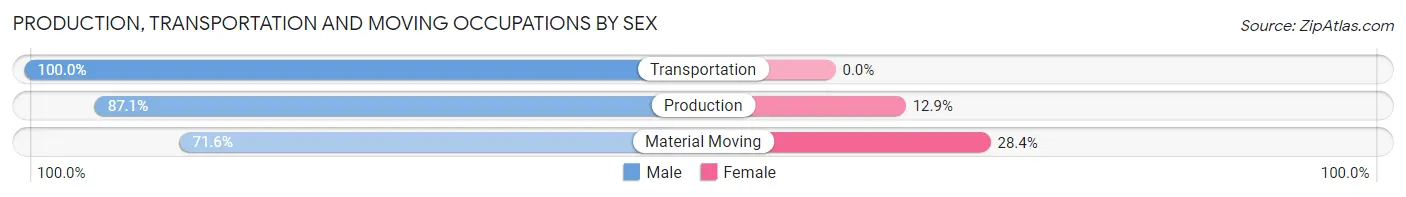
Production, Transportation and Moving Occupations by Sex
| Occupation | Male | Female |
| Production | 115 (87.1%) | 17 (12.9%) |
| Transportation | 77 (100.0%) | 0 (0.0%) |
| Material Moving | 78 (71.6%) | 31 (28.4%) |
| Total (Category) | 270 (84.9%) | 48 (15.1%) |
| Total (Overall) | 1,173 (59.6%) | 794 (40.4%) |
Employment Industries by Sex in Lindale
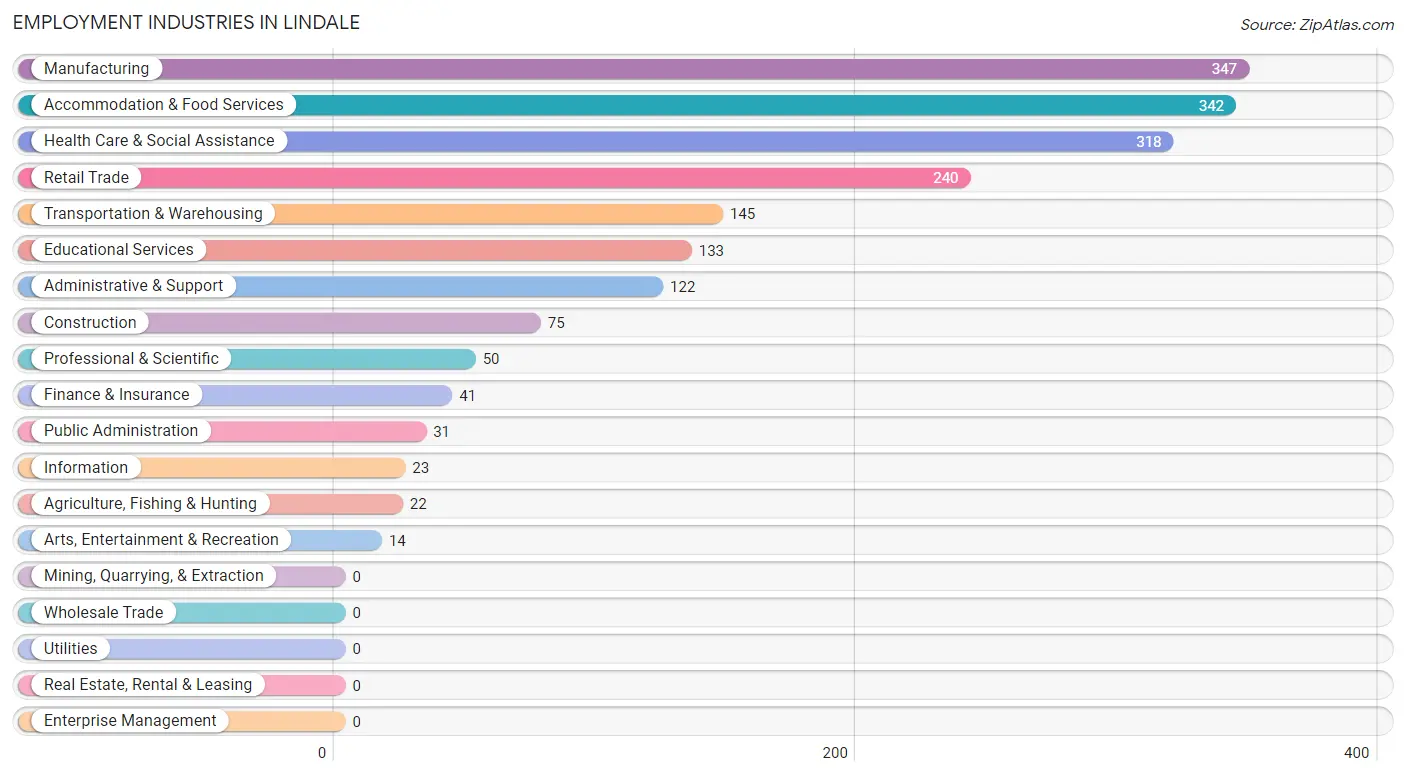
Employment Industries in Lindale
The major employment industries in Lindale include Manufacturing (347 | 17.6%), Accommodation & Food Services (342 | 17.4%), Health Care & Social Assistance (318 | 16.2%), Retail Trade (240 | 12.2%), and Transportation & Warehousing (145 | 7.4%).
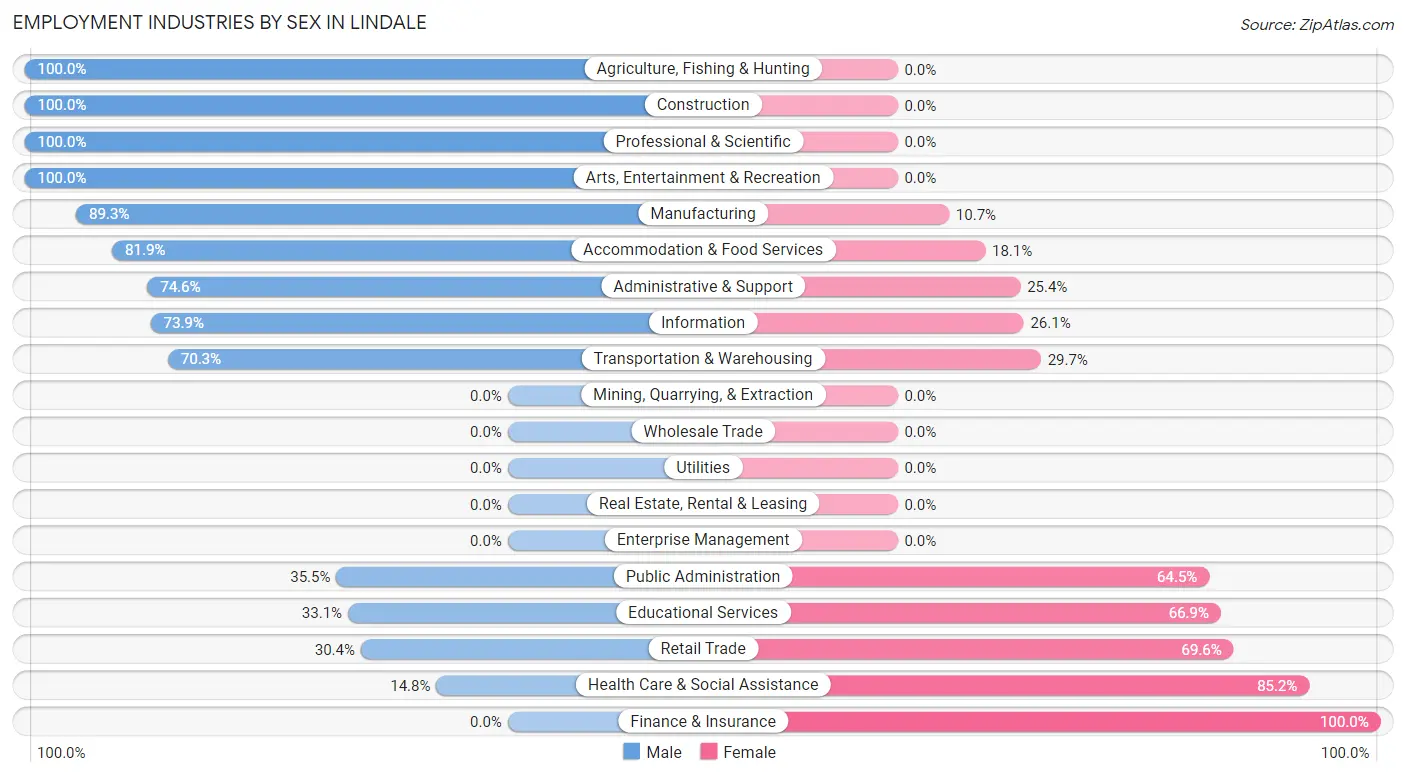
Employment Industries by Sex in Lindale
The Lindale industries that see more men than women are Agriculture, Fishing & Hunting (100.0%), Construction (100.0%), and Professional & Scientific (100.0%), whereas the industries that tend to have a higher number of women are Finance & Insurance (100.0%), Health Care & Social Assistance (85.2%), and Retail Trade (69.6%).
| Industry | Male | Female |
| Agriculture, Fishing & Hunting | 22 (100.0%) | 0 (0.0%) |
| Mining, Quarrying, & Extraction | 0 (0.0%) | 0 (0.0%) |
| Construction | 75 (100.0%) | 0 (0.0%) |
| Manufacturing | 310 (89.3%) | 37 (10.7%) |
| Wholesale Trade | 0 (0.0%) | 0 (0.0%) |
| Retail Trade | 73 (30.4%) | 167 (69.6%) |
| Transportation & Warehousing | 102 (70.3%) | 43 (29.7%) |
| Utilities | 0 (0.0%) | 0 (0.0%) |
| Information | 17 (73.9%) | 6 (26.1%) |
| Finance & Insurance | 0 (0.0%) | 41 (100.0%) |
| Real Estate, Rental & Leasing | 0 (0.0%) | 0 (0.0%) |
| Professional & Scientific | 50 (100.0%) | 0 (0.0%) |
| Enterprise Management | 0 (0.0%) | 0 (0.0%) |
| Administrative & Support | 91 (74.6%) | 31 (25.4%) |
| Educational Services | 44 (33.1%) | 89 (66.9%) |
| Health Care & Social Assistance | 47 (14.8%) | 271 (85.2%) |
| Arts, Entertainment & Recreation | 14 (100.0%) | 0 (0.0%) |
| Accommodation & Food Services | 280 (81.9%) | 62 (18.1%) |
| Public Administration | 11 (35.5%) | 20 (64.5%) |
| Total | 1,173 (59.6%) | 794 (40.4%) |
Education in Lindale
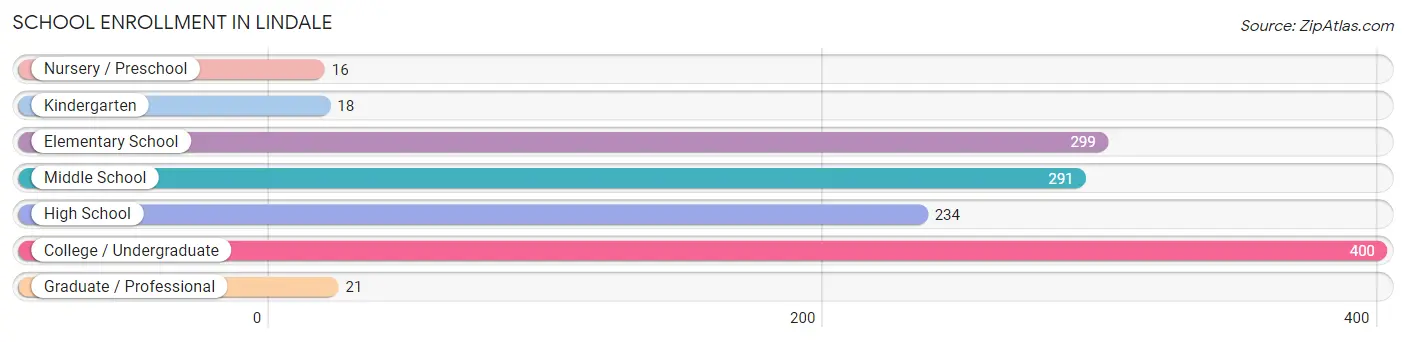
School Enrollment in Lindale
The most common levels of schooling among the 1,279 students in Lindale are college / undergraduate (400 | 31.3%), elementary school (299 | 23.4%), and middle school (291 | 22.8%).
| School Level | # Students | % Students |
| Nursery / Preschool | 16 | 1.3% |
| Kindergarten | 18 | 1.4% |
| Elementary School | 299 | 23.4% |
| Middle School | 291 | 22.8% |
| High School | 234 | 18.3% |
| College / Undergraduate | 400 | 31.3% |
| Graduate / Professional | 21 | 1.6% |
| Total | 1,279 | 100.0% |
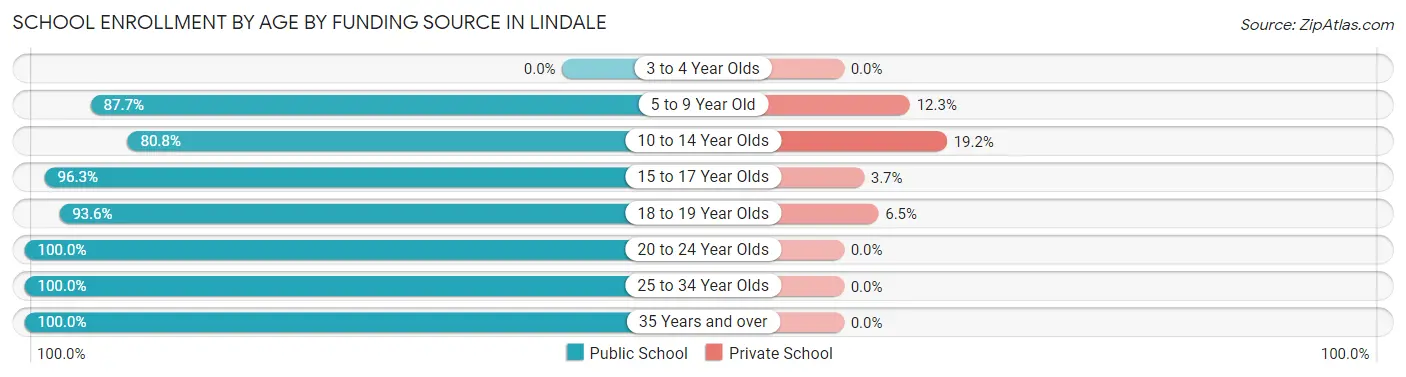
School Enrollment by Age by Funding Source in Lindale
Out of a total of 1,279 students who are enrolled in schools in Lindale, 118 (9.2%) attend a private institution, while the remaining 1,161 (90.8%) are enrolled in public schools. The age group of 10 to 14 year olds has the highest likelihood of being enrolled in private schools, with 71 (19.2% in the age bracket) enrolled. Conversely, the age group of 20 to 24 year olds has the lowest likelihood of being enrolled in a private school, with 287 (100.0% in the age bracket) attending a public institution.
| Age Bracket | Public School | Private School |
| 3 to 4 Year Olds | 0 (0.0%) | 0 (0.0%) |
| 5 to 9 Year Old | 235 (87.7%) | 33 (12.3%) |
| 10 to 14 Year Olds | 299 (80.8%) | 71 (19.2%) |
| 15 to 17 Year Olds | 206 (96.3%) | 8 (3.7%) |
| 18 to 19 Year Olds | 87 (93.5%) | 6 (6.5%) |
| 20 to 24 Year Olds | 287 (100.0%) | 0 (0.0%) |
| 25 to 34 Year Olds | 38 (100.0%) | 0 (0.0%) |
| 35 Years and over | 9 (100.0%) | 0 (0.0%) |
| Total | 1,161 (90.8%) | 118 (9.2%) |
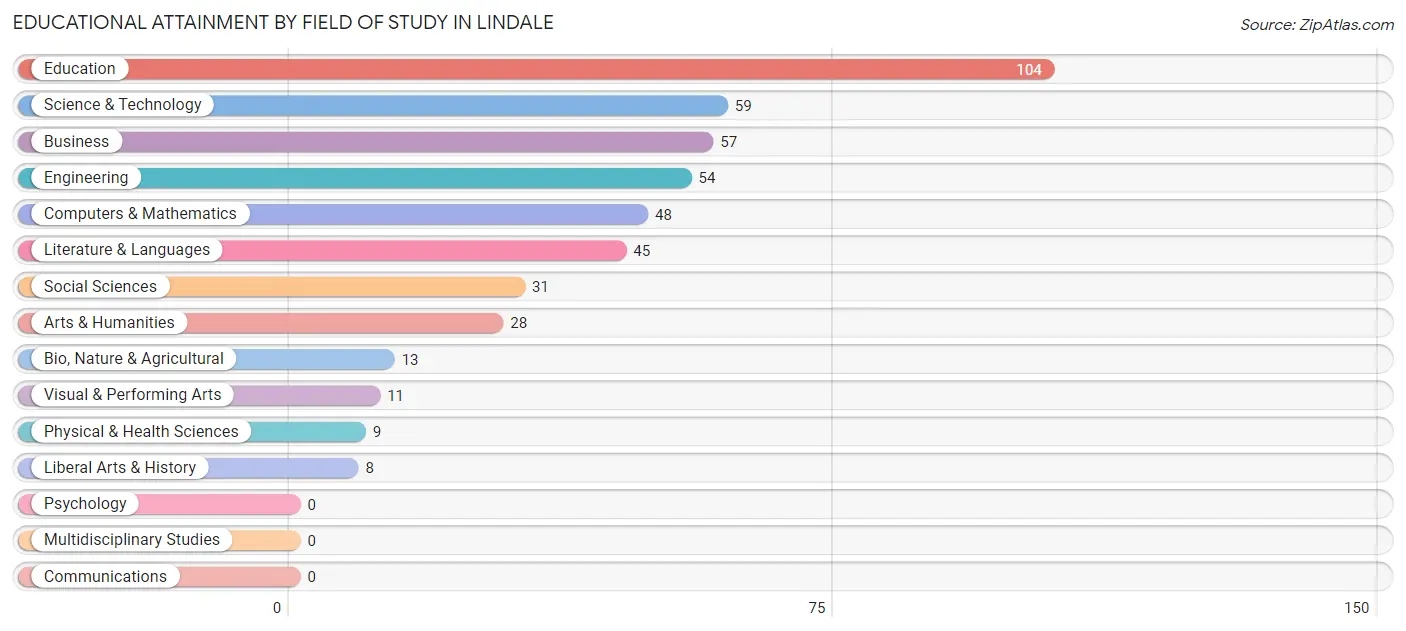
Educational Attainment by Field of Study in Lindale
Education (104 | 22.3%), science & technology (59 | 12.6%), business (57 | 12.2%), engineering (54 | 11.6%), and computers & mathematics (48 | 10.3%) are the most common fields of study among 467 individuals in Lindale who have obtained a bachelor's degree or higher.
| Field of Study | # Graduates | % Graduates |
| Computers & Mathematics | 48 | 10.3% |
| Bio, Nature & Agricultural | 13 | 2.8% |
| Physical & Health Sciences | 9 | 1.9% |
| Psychology | 0 | 0.0% |
| Social Sciences | 31 | 6.6% |
| Engineering | 54 | 11.6% |
| Multidisciplinary Studies | 0 | 0.0% |
| Science & Technology | 59 | 12.6% |
| Business | 57 | 12.2% |
| Education | 104 | 22.3% |
| Literature & Languages | 45 | 9.6% |
| Liberal Arts & History | 8 | 1.7% |
| Visual & Performing Arts | 11 | 2.4% |
| Communications | 0 | 0.0% |
| Arts & Humanities | 28 | 6.0% |
| Total | 467 | 100.0% |
Transportation & Commute in Lindale
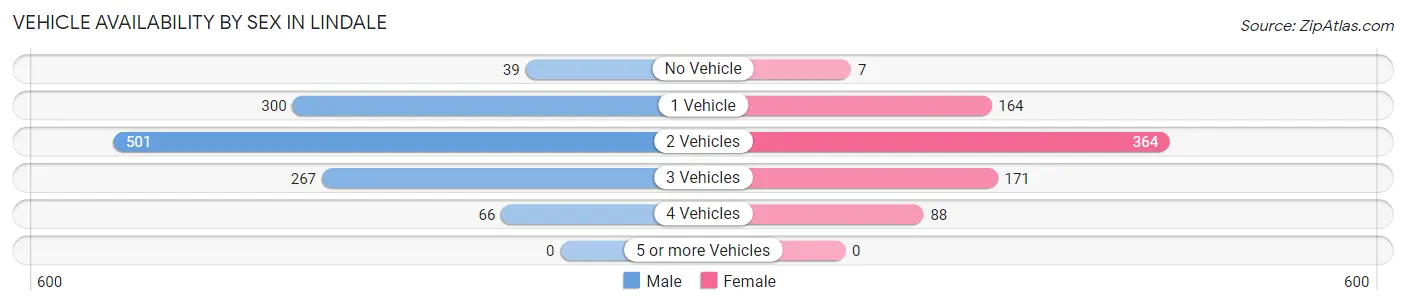
Vehicle Availability by Sex in Lindale
The most prevalent vehicle ownership categories in Lindale are males with 2 vehicles (501, accounting for 42.7%) and females with 2 vehicles (364, making up 63.1%).
| Vehicles Available | Male | Female |
| No Vehicle | 39 (3.3%) | 7 (0.9%) |
| 1 Vehicle | 300 (25.6%) | 164 (20.6%) |
| 2 Vehicles | 501 (42.7%) | 364 (45.8%) |
| 3 Vehicles | 267 (22.8%) | 171 (21.5%) |
| 4 Vehicles | 66 (5.6%) | 88 (11.1%) |
| 5 or more Vehicles | 0 (0.0%) | 0 (0.0%) |
| Total | 1,173 (100.0%) | 794 (100.0%) |
Commute Time in Lindale
The most frequently occuring commute durations in Lindale are 20 to 24 minutes (439 commuters, 22.6%), 15 to 19 minutes (372 commuters, 19.2%), and 5 to 9 minutes (357 commuters, 18.4%).
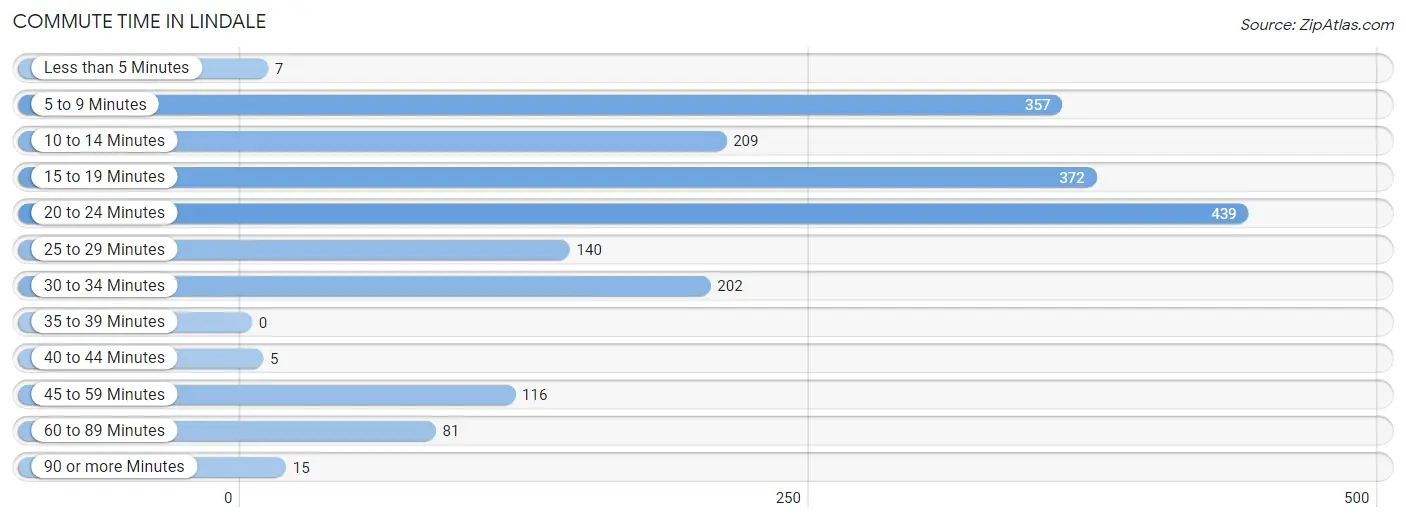
| Commute Time | # Commuters | % Commuters |
| Less than 5 Minutes | 7 | 0.4% |
| 5 to 9 Minutes | 357 | 18.4% |
| 10 to 14 Minutes | 209 | 10.8% |
| 15 to 19 Minutes | 372 | 19.2% |
| 20 to 24 Minutes | 439 | 22.6% |
| 25 to 29 Minutes | 140 | 7.2% |
| 30 to 34 Minutes | 202 | 10.4% |
| 35 to 39 Minutes | 0 | 0.0% |
| 40 to 44 Minutes | 5 | 0.3% |
| 45 to 59 Minutes | 116 | 6.0% |
| 60 to 89 Minutes | 81 | 4.2% |
| 90 or more Minutes | 15 | 0.8% |
Commute Time by Sex in Lindale
The most common commute times in Lindale are 20 to 24 minutes (375 commuters, 32.0%) for males and 15 to 19 minutes (203 commuters, 26.4%) for females.
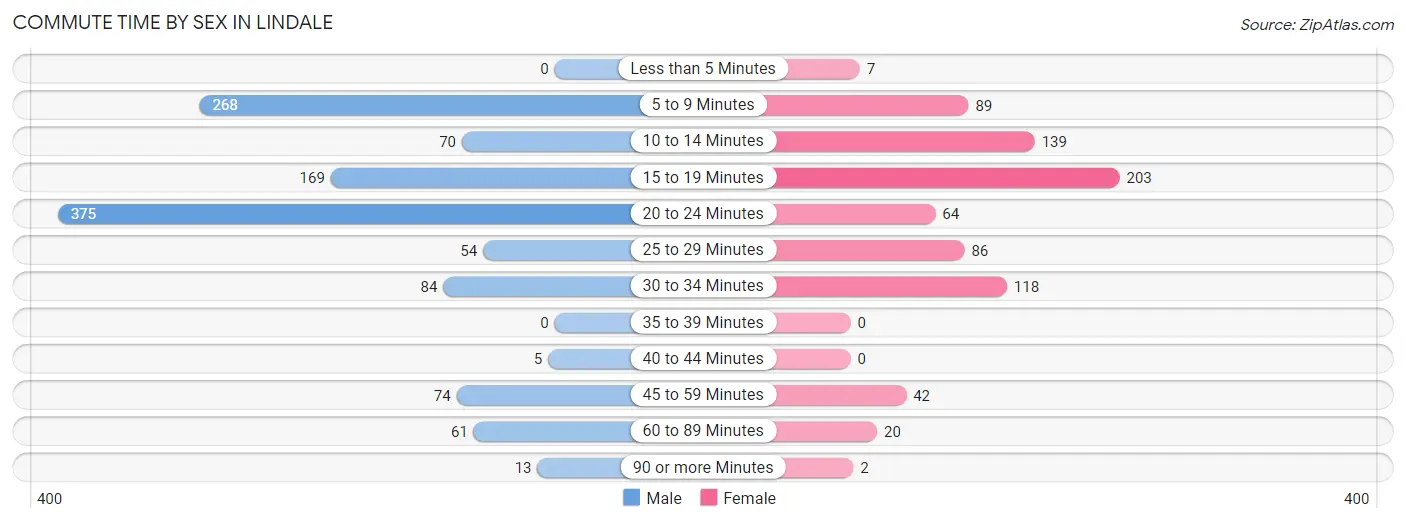
| Commute Time | Male | Female |
| Less than 5 Minutes | 0 (0.0%) | 7 (0.9%) |
| 5 to 9 Minutes | 268 (22.9%) | 89 (11.6%) |
| 10 to 14 Minutes | 70 (6.0%) | 139 (18.0%) |
| 15 to 19 Minutes | 169 (14.4%) | 203 (26.4%) |
| 20 to 24 Minutes | 375 (32.0%) | 64 (8.3%) |
| 25 to 29 Minutes | 54 (4.6%) | 86 (11.2%) |
| 30 to 34 Minutes | 84 (7.2%) | 118 (15.3%) |
| 35 to 39 Minutes | 0 (0.0%) | 0 (0.0%) |
| 40 to 44 Minutes | 5 (0.4%) | 0 (0.0%) |
| 45 to 59 Minutes | 74 (6.3%) | 42 (5.4%) |
| 60 to 89 Minutes | 61 (5.2%) | 20 (2.6%) |
| 90 or more Minutes | 13 (1.1%) | 2 (0.3%) |
Time of Departure to Work by Sex in Lindale
The most frequent times of departure to work in Lindale are 4:00 PM to 11:59 PM (248, 21.1%) for males and 7:00 AM to 7:29 AM (212, 27.5%) for females.
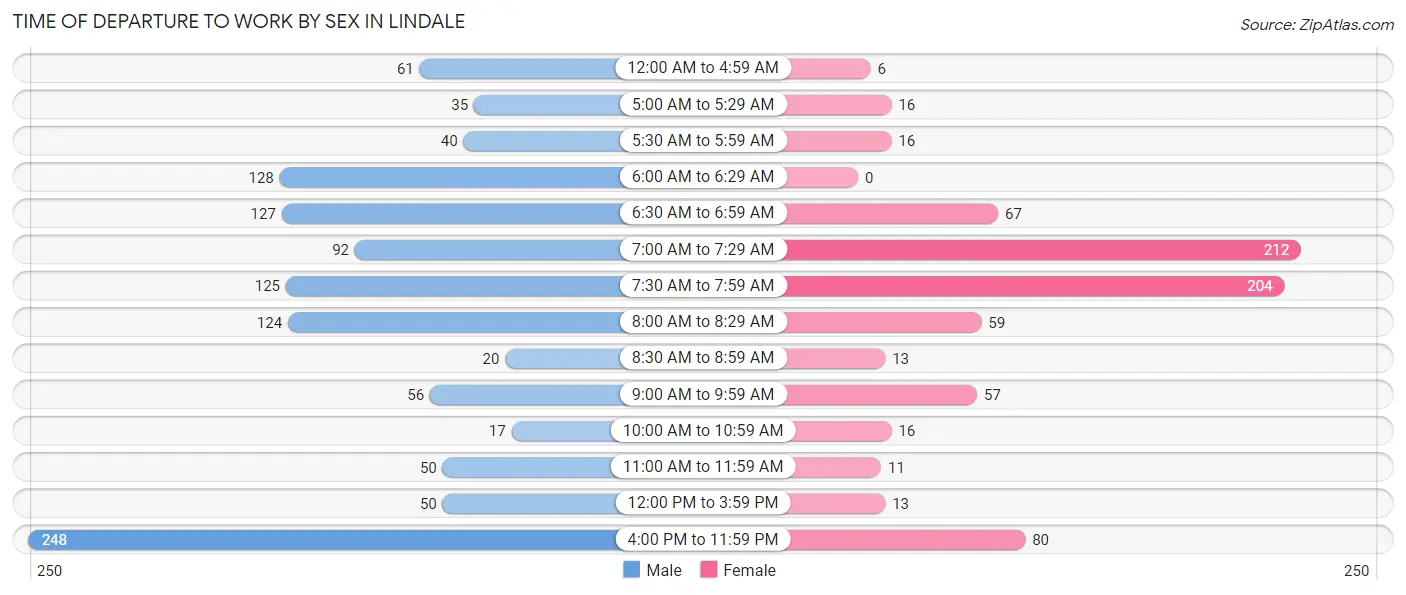
| Time of Departure | Male | Female |
| 12:00 AM to 4:59 AM | 61 (5.2%) | 6 (0.8%) |
| 5:00 AM to 5:29 AM | 35 (3.0%) | 16 (2.1%) |
| 5:30 AM to 5:59 AM | 40 (3.4%) | 16 (2.1%) |
| 6:00 AM to 6:29 AM | 128 (10.9%) | 0 (0.0%) |
| 6:30 AM to 6:59 AM | 127 (10.8%) | 67 (8.7%) |
| 7:00 AM to 7:29 AM | 92 (7.8%) | 212 (27.5%) |
| 7:30 AM to 7:59 AM | 125 (10.7%) | 204 (26.5%) |
| 8:00 AM to 8:29 AM | 124 (10.6%) | 59 (7.7%) |
| 8:30 AM to 8:59 AM | 20 (1.7%) | 13 (1.7%) |
| 9:00 AM to 9:59 AM | 56 (4.8%) | 57 (7.4%) |
| 10:00 AM to 10:59 AM | 17 (1.5%) | 16 (2.1%) |
| 11:00 AM to 11:59 AM | 50 (4.3%) | 11 (1.4%) |
| 12:00 PM to 3:59 PM | 50 (4.3%) | 13 (1.7%) |
| 4:00 PM to 11:59 PM | 248 (21.1%) | 80 (10.4%) |
| Total | 1,173 (100.0%) | 770 (100.0%) |
Housing Occupancy in Lindale
Occupancy by Ownership in Lindale
Of the total 1,675 dwellings in Lindale, owner-occupied units account for 920 (54.9%), while renter-occupied units make up 755 (45.1%).
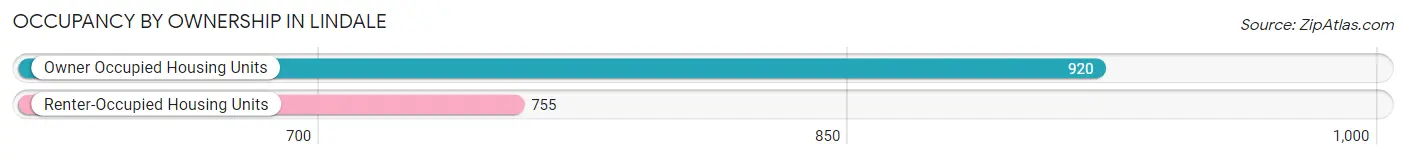
| Occupancy | # Housing Units | % Housing Units |
| Owner Occupied Housing Units | 920 | 54.9% |
| Renter-Occupied Housing Units | 755 | 45.1% |
| Total Occupied Housing Units | 1,675 | 100.0% |
Occupancy by Household Size in Lindale
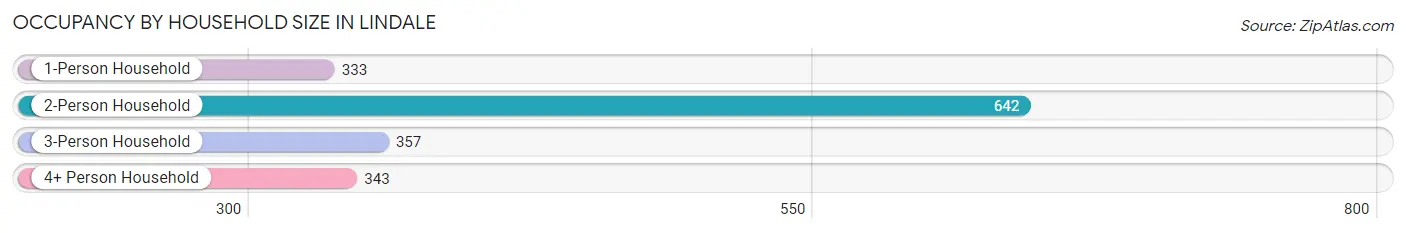
| Household Size | # Housing Units | % Housing Units |
| 1-Person Household | 333 | 19.9% |
| 2-Person Household | 642 | 38.3% |
| 3-Person Household | 357 | 21.3% |
| 4+ Person Household | 343 | 20.5% |
| Total Housing Units | 1,675 | 100.0% |
Occupancy by Ownership by Household Size in Lindale
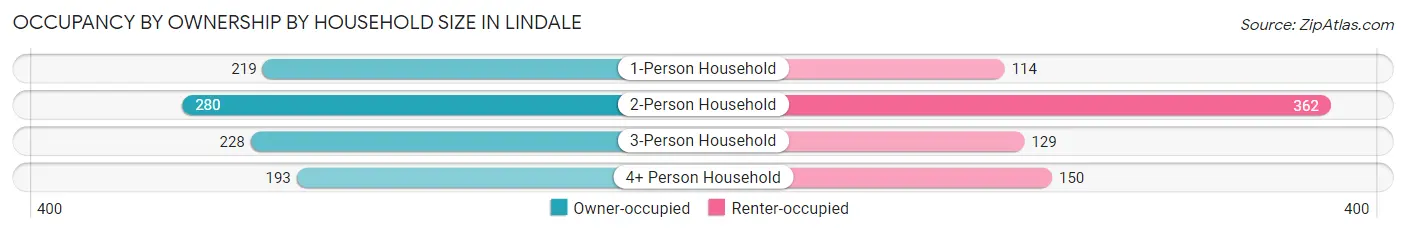
| Household Size | Owner-occupied | Renter-occupied |
| 1-Person Household | 219 (65.8%) | 114 (34.2%) |
| 2-Person Household | 280 (43.6%) | 362 (56.4%) |
| 3-Person Household | 228 (63.9%) | 129 (36.1%) |
| 4+ Person Household | 193 (56.3%) | 150 (43.7%) |
| Total Housing Units | 920 (54.9%) | 755 (45.1%) |
Occupancy by Educational Attainment in Lindale
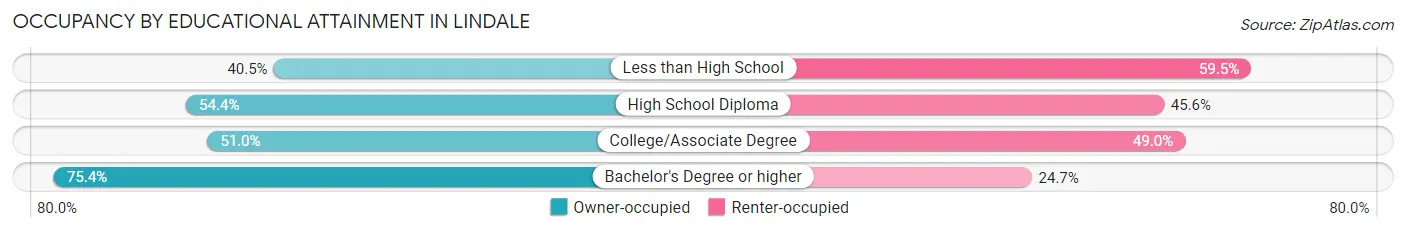
| Household Size | Owner-occupied | Renter-occupied |
| Less than High School | 77 (40.5%) | 113 (59.5%) |
| High School Diploma | 249 (54.4%) | 209 (45.6%) |
| College/Associate Degree | 377 (51.0%) | 362 (49.0%) |
| Bachelor's Degree or higher | 217 (75.3%) | 71 (24.6%) |
Occupancy by Age of Householder in Lindale
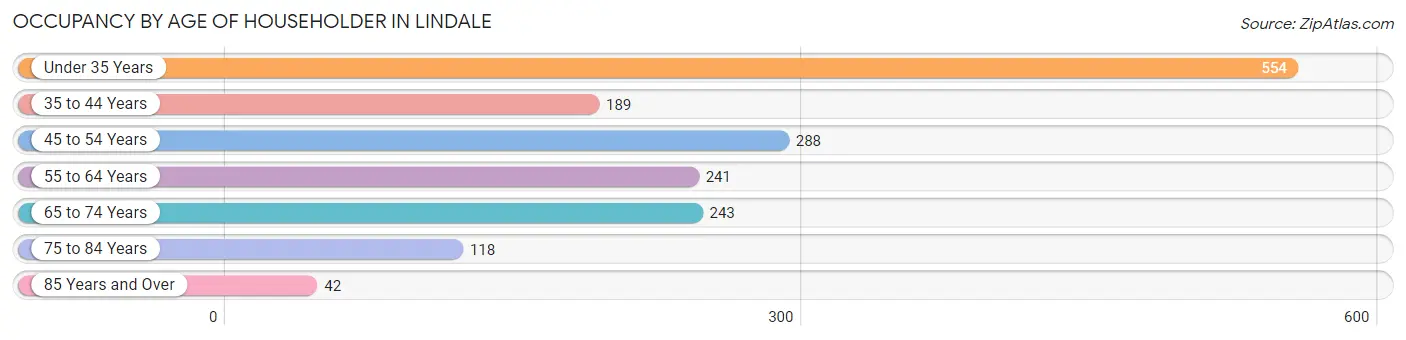
| Age Bracket | # Households | % Households |
| Under 35 Years | 554 | 33.1% |
| 35 to 44 Years | 189 | 11.3% |
| 45 to 54 Years | 288 | 17.2% |
| 55 to 64 Years | 241 | 14.4% |
| 65 to 74 Years | 243 | 14.5% |
| 75 to 84 Years | 118 | 7.0% |
| 85 Years and Over | 42 | 2.5% |
| Total | 1,675 | 100.0% |
Housing Finances in Lindale
Median Income by Occupancy in Lindale
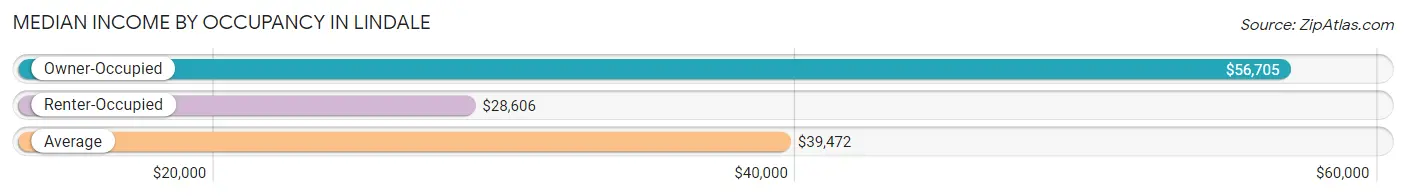
| Occupancy Type | # Households | Median Income |
| Owner-Occupied | 920 (54.9%) | $56,705 |
| Renter-Occupied | 755 (45.1%) | $28,606 |
| Average | 1,675 (100.0%) | $39,472 |
Occupancy by Householder Income Bracket in Lindale
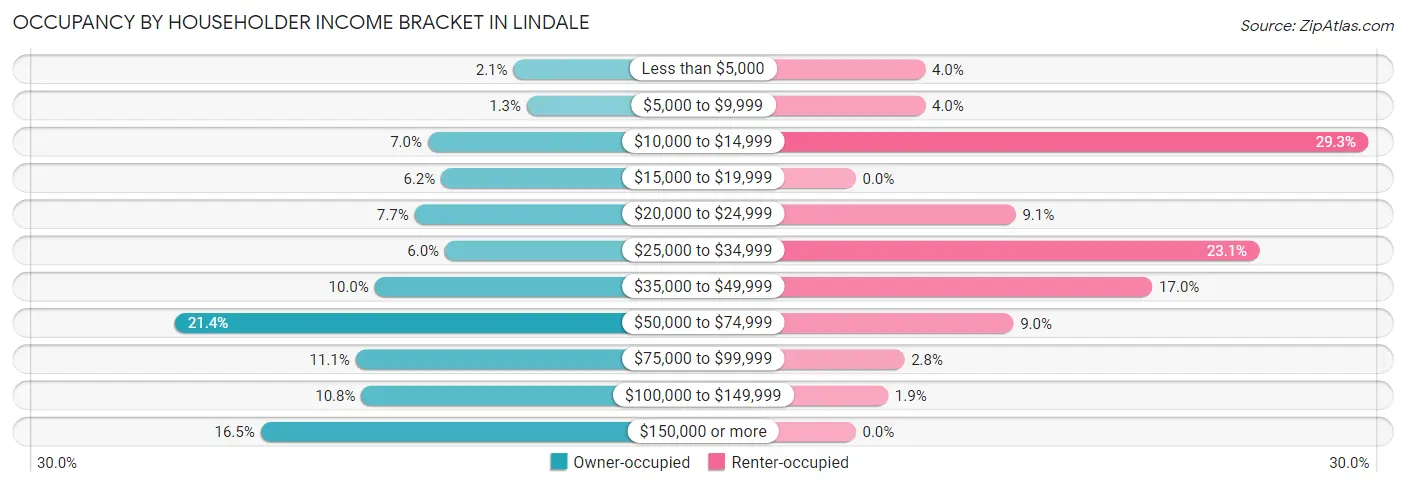
| Income Bracket | Owner-occupied | Renter-occupied |
| Less than $5,000 | 19 (2.1%) | 30 (4.0%) |
| $5,000 to $9,999 | 12 (1.3%) | 30 (4.0%) |
| $10,000 to $14,999 | 64 (7.0%) | 221 (29.3%) |
| $15,000 to $19,999 | 57 (6.2%) | 0 (0.0%) |
| $20,000 to $24,999 | 71 (7.7%) | 69 (9.1%) |
| $25,000 to $34,999 | 55 (6.0%) | 174 (23.1%) |
| $35,000 to $49,999 | 92 (10.0%) | 128 (17.0%) |
| $50,000 to $74,999 | 197 (21.4%) | 68 (9.0%) |
| $75,000 to $99,999 | 102 (11.1%) | 21 (2.8%) |
| $100,000 to $149,999 | 99 (10.8%) | 14 (1.8%) |
| $150,000 or more | 152 (16.5%) | 0 (0.0%) |
| Total | 920 (100.0%) | 755 (100.0%) |
Monthly Housing Cost Tiers in Lindale
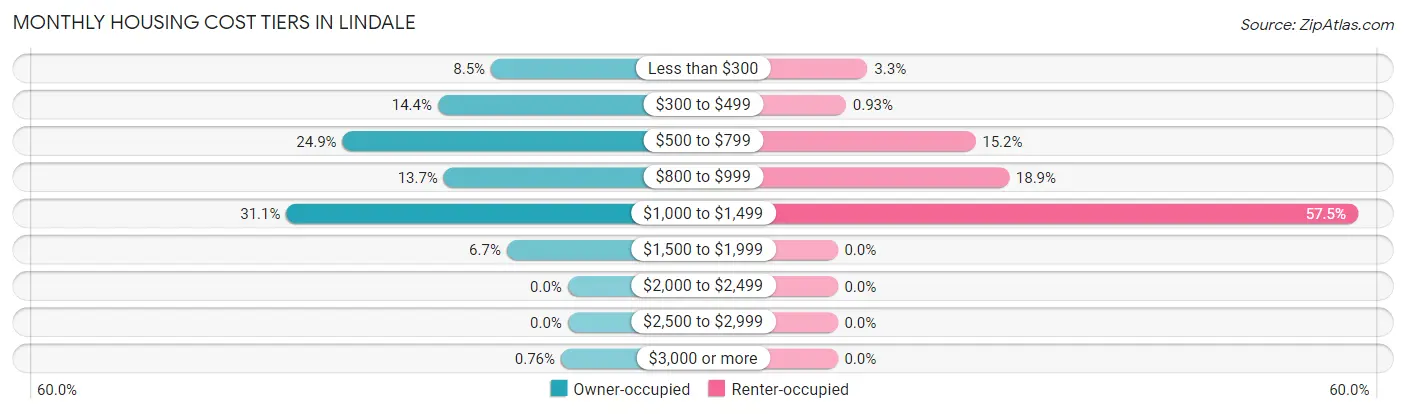
| Monthly Cost | Owner-occupied | Renter-occupied |
| Less than $300 | 78 (8.5%) | 25 (3.3%) |
| $300 to $499 | 132 (14.3%) | 7 (0.9%) |
| $500 to $799 | 229 (24.9%) | 115 (15.2%) |
| $800 to $999 | 126 (13.7%) | 143 (18.9%) |
| $1,000 to $1,499 | 286 (31.1%) | 434 (57.5%) |
| $1,500 to $1,999 | 62 (6.7%) | 0 (0.0%) |
| $2,000 to $2,499 | 0 (0.0%) | 0 (0.0%) |
| $2,500 to $2,999 | 0 (0.0%) | 0 (0.0%) |
| $3,000 or more | 7 (0.8%) | 0 (0.0%) |
| Total | 920 (100.0%) | 755 (100.0%) |
Physical Housing Characteristics in Lindale
Housing Structures in Lindale
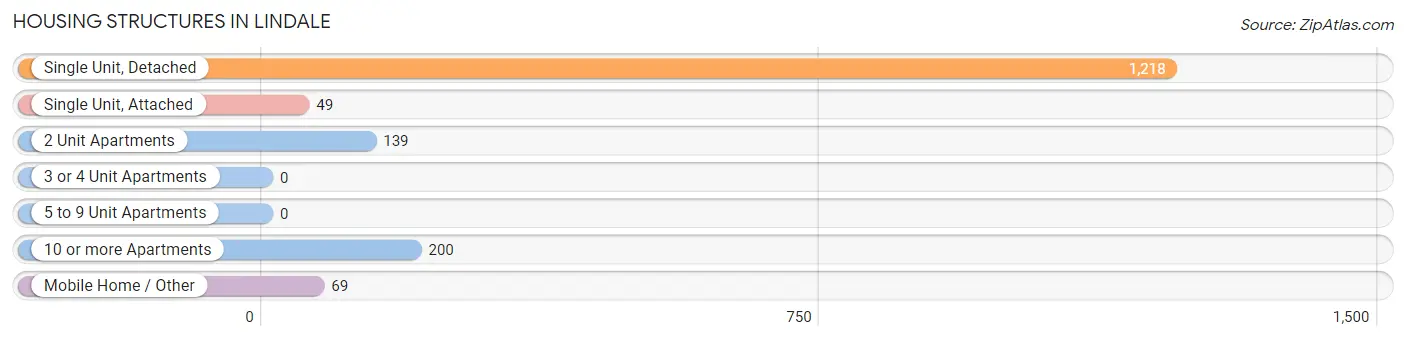
| Structure Type | # Housing Units | % Housing Units |
| Single Unit, Detached | 1,218 | 72.7% |
| Single Unit, Attached | 49 | 2.9% |
| 2 Unit Apartments | 139 | 8.3% |
| 3 or 4 Unit Apartments | 0 | 0.0% |
| 5 to 9 Unit Apartments | 0 | 0.0% |
| 10 or more Apartments | 200 | 11.9% |
| Mobile Home / Other | 69 | 4.1% |
| Total | 1,675 | 100.0% |
Housing Structures by Occupancy in Lindale
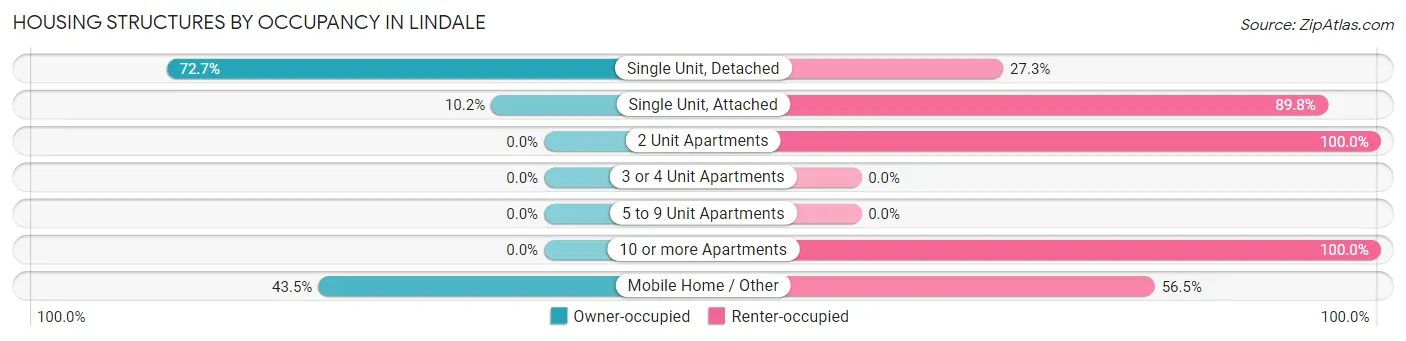
| Structure Type | Owner-occupied | Renter-occupied |
| Single Unit, Detached | 885 (72.7%) | 333 (27.3%) |
| Single Unit, Attached | 5 (10.2%) | 44 (89.8%) |
| 2 Unit Apartments | 0 (0.0%) | 139 (100.0%) |
| 3 or 4 Unit Apartments | 0 (0.0%) | 0 (0.0%) |
| 5 to 9 Unit Apartments | 0 (0.0%) | 0 (0.0%) |
| 10 or more Apartments | 0 (0.0%) | 200 (100.0%) |
| Mobile Home / Other | 30 (43.5%) | 39 (56.5%) |
| Total | 920 (54.9%) | 755 (45.1%) |
Housing Structures by Number of Rooms in Lindale
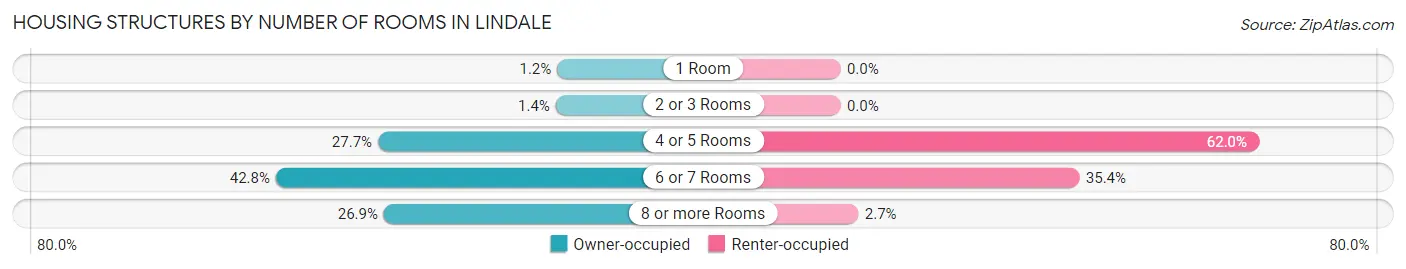
| Number of Rooms | Owner-occupied | Renter-occupied |
| 1 Room | 11 (1.2%) | 0 (0.0%) |
| 2 or 3 Rooms | 13 (1.4%) | 0 (0.0%) |
| 4 or 5 Rooms | 255 (27.7%) | 468 (62.0%) |
| 6 or 7 Rooms | 394 (42.8%) | 267 (35.4%) |
| 8 or more Rooms | 247 (26.9%) | 20 (2.6%) |
| Total | 920 (100.0%) | 755 (100.0%) |
Housing Structure by Heating Type in Lindale
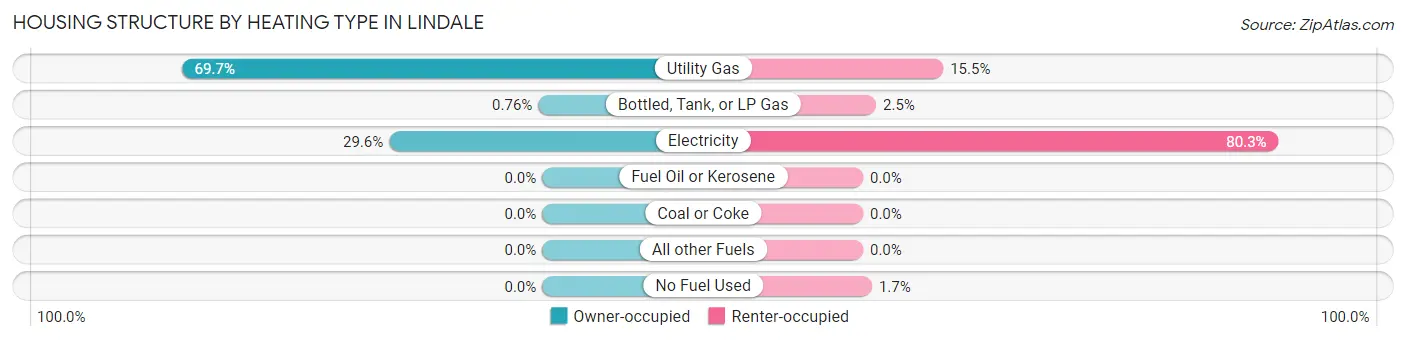
| Heating Type | Owner-occupied | Renter-occupied |
| Utility Gas | 641 (69.7%) | 117 (15.5%) |
| Bottled, Tank, or LP Gas | 7 (0.8%) | 19 (2.5%) |
| Electricity | 272 (29.6%) | 606 (80.3%) |
| Fuel Oil or Kerosene | 0 (0.0%) | 0 (0.0%) |
| Coal or Coke | 0 (0.0%) | 0 (0.0%) |
| All other Fuels | 0 (0.0%) | 0 (0.0%) |
| No Fuel Used | 0 (0.0%) | 13 (1.7%) |
| Total | 920 (100.0%) | 755 (100.0%) |
Household Vehicle Usage in Lindale
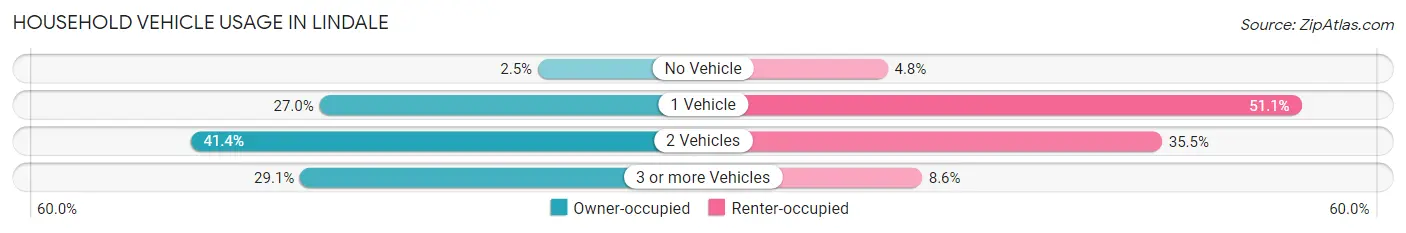
| Vehicles per Household | Owner-occupied | Renter-occupied |
| No Vehicle | 23 (2.5%) | 36 (4.8%) |
| 1 Vehicle | 248 (27.0%) | 386 (51.1%) |
| 2 Vehicles | 381 (41.4%) | 268 (35.5%) |
| 3 or more Vehicles | 268 (29.1%) | 65 (8.6%) |
| Total | 920 (100.0%) | 755 (100.0%) |
Real Estate & Mortgages in Lindale
Real Estate and Mortgage Overview in Lindale
| Characteristic | Without Mortgage | With Mortgage |
| Housing Units | 362 | 558 |
| Median Property Value | $69,300 | $124,400 |
| Median Household Income | $42,750 | $137 |
| Monthly Housing Costs | $458 | $7 |
| Real Estate Taxes | $827 | $0 |
Property Value by Mortgage Status in Lindale
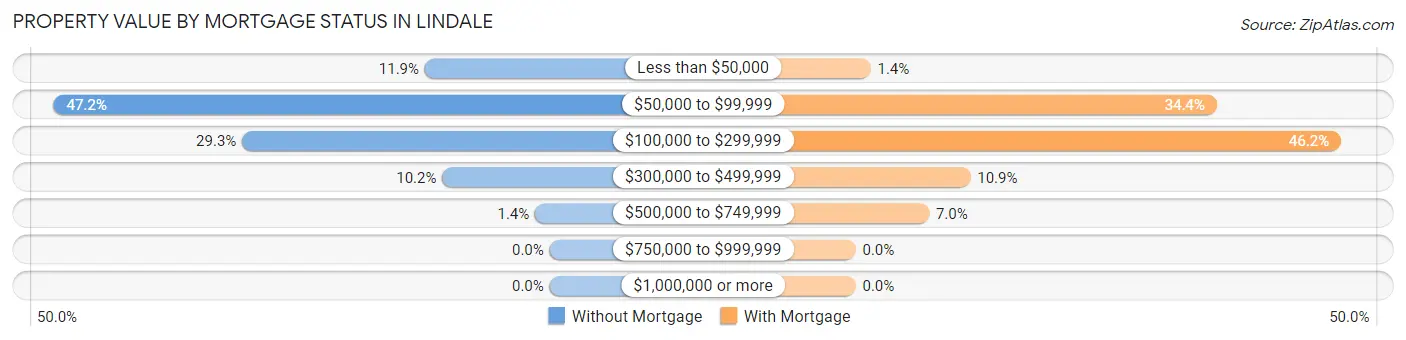
| Property Value | Without Mortgage | With Mortgage |
| Less than $50,000 | 43 (11.9%) | 8 (1.4%) |
| $50,000 to $99,999 | 171 (47.2%) | 192 (34.4%) |
| $100,000 to $299,999 | 106 (29.3%) | 258 (46.2%) |
| $300,000 to $499,999 | 37 (10.2%) | 61 (10.9%) |
| $500,000 to $749,999 | 5 (1.4%) | 39 (7.0%) |
| $750,000 to $999,999 | 0 (0.0%) | 0 (0.0%) |
| $1,000,000 or more | 0 (0.0%) | 0 (0.0%) |
| Total | 362 (100.0%) | 558 (100.0%) |
Household Income by Mortgage Status in Lindale
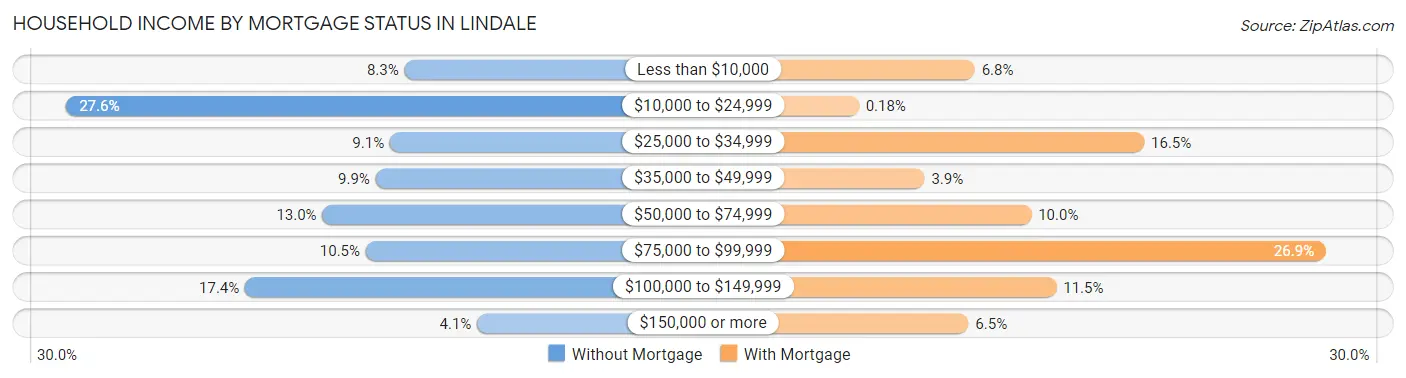
| Household Income | Without Mortgage | With Mortgage |
| Less than $10,000 | 30 (8.3%) | 38 (6.8%) |
| $10,000 to $24,999 | 100 (27.6%) | 1 (0.2%) |
| $25,000 to $34,999 | 33 (9.1%) | 92 (16.5%) |
| $35,000 to $49,999 | 36 (9.9%) | 22 (3.9%) |
| $50,000 to $74,999 | 47 (13.0%) | 56 (10.0%) |
| $75,000 to $99,999 | 38 (10.5%) | 150 (26.9%) |
| $100,000 to $149,999 | 63 (17.4%) | 64 (11.5%) |
| $150,000 or more | 15 (4.1%) | 36 (6.5%) |
| Total | 362 (100.0%) | 558 (100.0%) |
Property Value to Household Income Ratio in Lindale
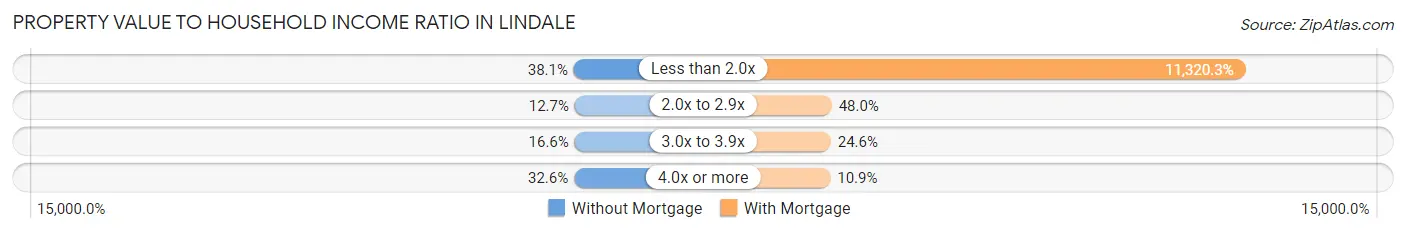
| Value-to-Income Ratio | Without Mortgage | With Mortgage |
| Less than 2.0x | 138 (38.1%) | 63,167 (11,320.3%) |
| 2.0x to 2.9x | 46 (12.7%) | 268 (48.0%) |
| 3.0x to 3.9x | 60 (16.6%) | 137 (24.5%) |
| 4.0x or more | 118 (32.6%) | 61 (10.9%) |
| Total | 362 (100.0%) | 558 (100.0%) |
Real Estate Taxes by Mortgage Status in Lindale
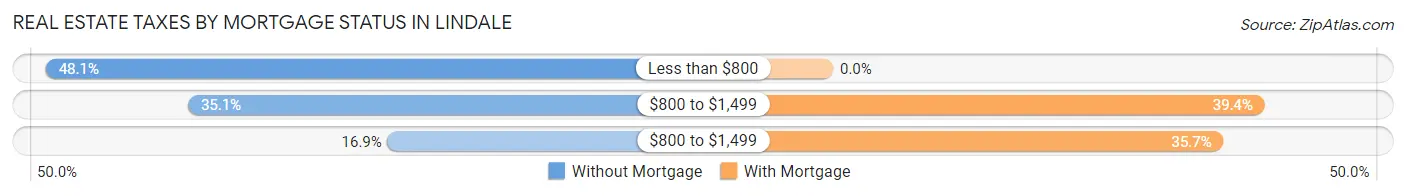
| Property Taxes | Without Mortgage | With Mortgage |
| Less than $800 | 174 (48.1%) | 0 (0.0%) |
| $800 to $1,499 | 127 (35.1%) | 220 (39.4%) |
| $800 to $1,499 | 61 (16.9%) | 199 (35.7%) |
| Total | 362 (100.0%) | 558 (100.0%) |
Health & Disability in Lindale
Health Insurance Coverage by Age in Lindale
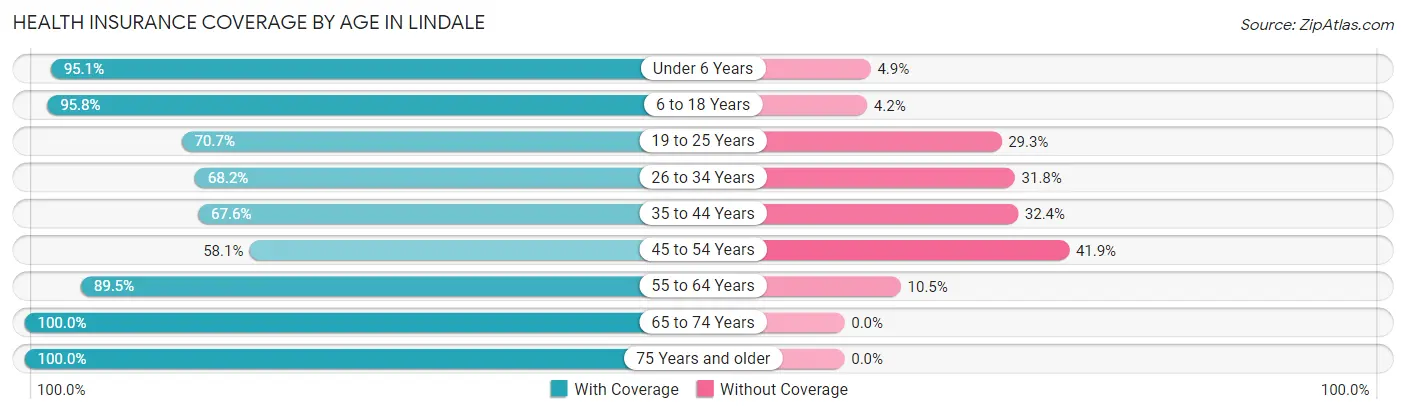
| Age Bracket | With Coverage | Without Coverage |
| Under 6 Years | 117 (95.1%) | 6 (4.9%) |
| 6 to 18 Years | 862 (95.8%) | 38 (4.2%) |
| 19 to 25 Years | 428 (70.7%) | 177 (29.3%) |
| 26 to 34 Years | 406 (68.2%) | 189 (31.8%) |
| 35 to 44 Years | 326 (67.6%) | 156 (32.4%) |
| 45 to 54 Years | 394 (58.1%) | 284 (41.9%) |
| 55 to 64 Years | 520 (89.5%) | 61 (10.5%) |
| 65 to 74 Years | 339 (100.0%) | 0 (0.0%) |
| 75 Years and older | 265 (100.0%) | 0 (0.0%) |
| Total | 3,657 (80.1%) | 911 (19.9%) |
Health Insurance Coverage by Citizenship Status in Lindale
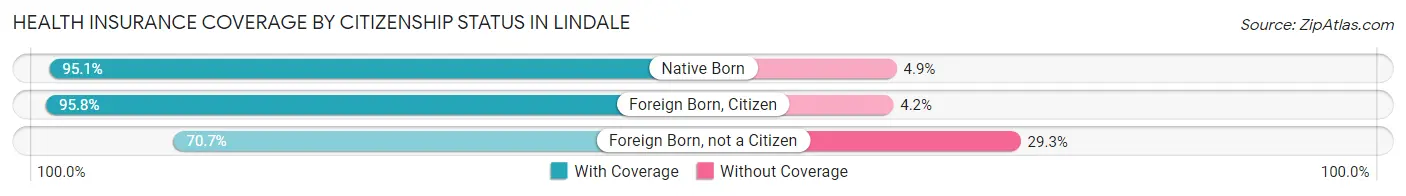
| Citizenship Status | With Coverage | Without Coverage |
| Native Born | 117 (95.1%) | 6 (4.9%) |
| Foreign Born, Citizen | 862 (95.8%) | 38 (4.2%) |
| Foreign Born, not a Citizen | 428 (70.7%) | 177 (29.3%) |
Health Insurance Coverage by Household Income in Lindale
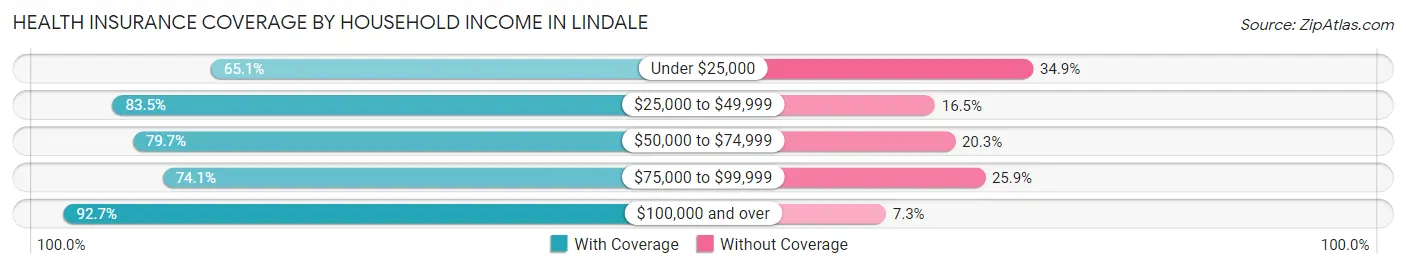
| Household Income | With Coverage | Without Coverage |
| Under $25,000 | 662 (65.1%) | 355 (34.9%) |
| $25,000 to $49,999 | 1,194 (83.5%) | 236 (16.5%) |
| $50,000 to $74,999 | 657 (79.7%) | 167 (20.3%) |
| $75,000 to $99,999 | 232 (74.1%) | 81 (25.9%) |
| $100,000 and over | 912 (92.7%) | 72 (7.3%) |
Public vs Private Health Insurance Coverage by Age in Lindale
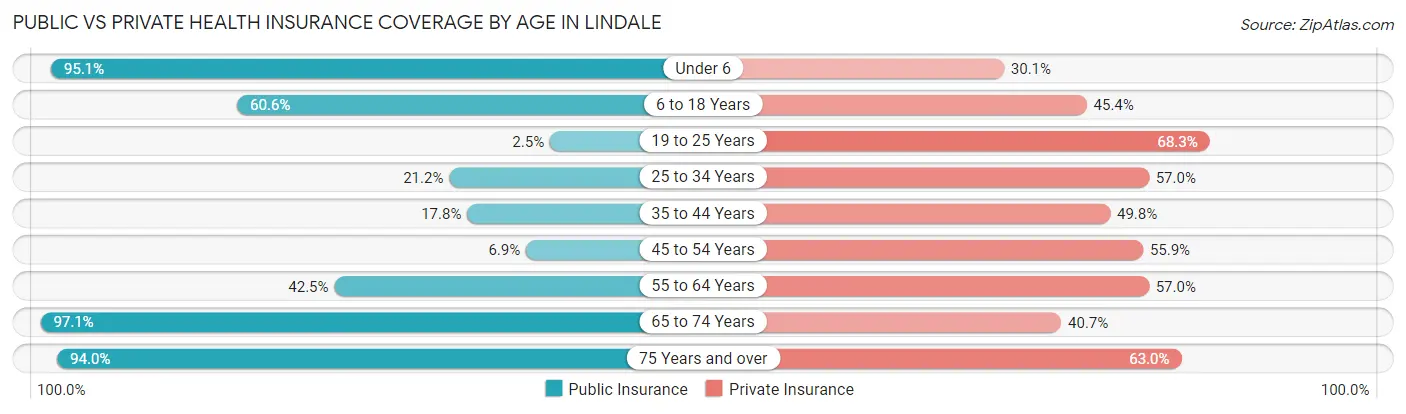
| Age Bracket | Public Insurance | Private Insurance |
| Under 6 | 117 (95.1%) | 37 (30.1%) |
| 6 to 18 Years | 545 (60.6%) | 409 (45.4%) |
| 19 to 25 Years | 15 (2.5%) | 413 (68.3%) |
| 25 to 34 Years | 126 (21.2%) | 339 (57.0%) |
| 35 to 44 Years | 86 (17.8%) | 240 (49.8%) |
| 45 to 54 Years | 47 (6.9%) | 379 (55.9%) |
| 55 to 64 Years | 247 (42.5%) | 331 (57.0%) |
| 65 to 74 Years | 329 (97.1%) | 138 (40.7%) |
| 75 Years and over | 249 (94.0%) | 167 (63.0%) |
| Total | 1,761 (38.6%) | 2,453 (53.7%) |
Disability Status by Sex by Age in Lindale
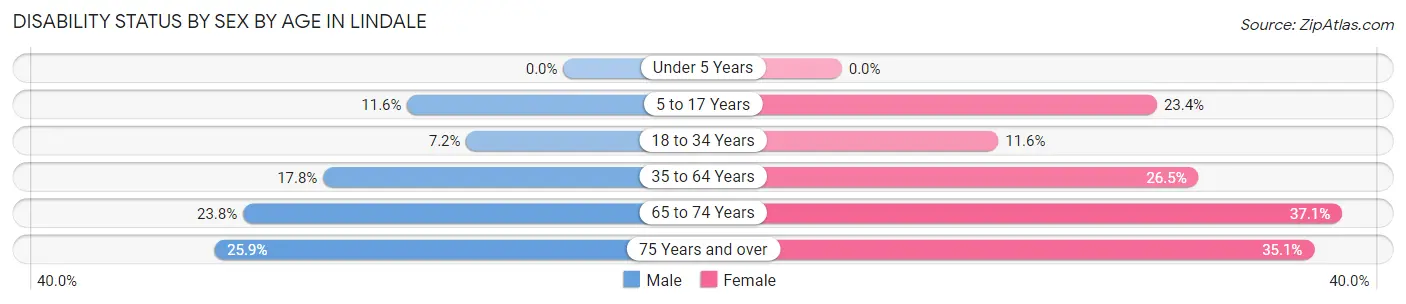
| Age Bracket | Male | Female |
| Under 5 Years | 0 (0.0%) | 0 (0.0%) |
| 5 to 17 Years | 49 (11.6%) | 106 (23.4%) |
| 18 to 34 Years | 50 (7.2%) | 64 (11.6%) |
| 35 to 64 Years | 169 (17.8%) | 210 (26.5%) |
| 65 to 74 Years | 39 (23.8%) | 65 (37.1%) |
| 75 Years and over | 14 (25.9%) | 74 (35.1%) |
Disability Class by Sex by Age in Lindale
Disability Class: Hearing Difficulty
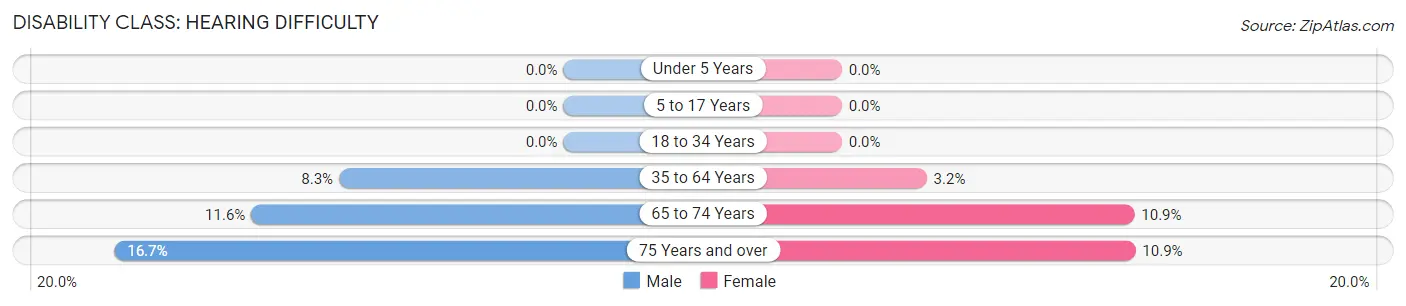
| Age Bracket | Male | Female |
| Under 5 Years | 0 (0.0%) | 0 (0.0%) |
| 5 to 17 Years | 0 (0.0%) | 0 (0.0%) |
| 18 to 34 Years | 0 (0.0%) | 0 (0.0%) |
| 35 to 64 Years | 79 (8.3%) | 25 (3.2%) |
| 65 to 74 Years | 19 (11.6%) | 19 (10.9%) |
| 75 Years and over | 9 (16.7%) | 23 (10.9%) |
Disability Class: Vision Difficulty
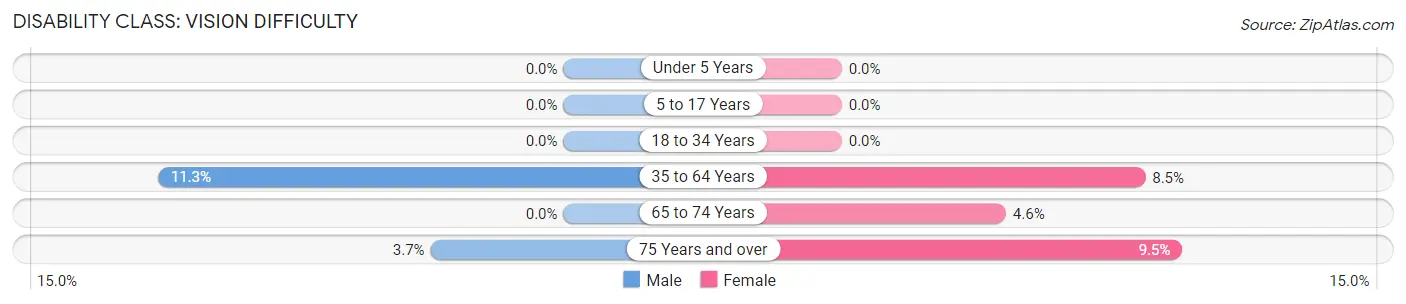
| Age Bracket | Male | Female |
| Under 5 Years | 0 (0.0%) | 0 (0.0%) |
| 5 to 17 Years | 0 (0.0%) | 0 (0.0%) |
| 18 to 34 Years | 0 (0.0%) | 0 (0.0%) |
| 35 to 64 Years | 107 (11.3%) | 67 (8.5%) |
| 65 to 74 Years | 0 (0.0%) | 8 (4.6%) |
| 75 Years and over | 2 (3.7%) | 20 (9.5%) |
Disability Class: Cognitive Difficulty
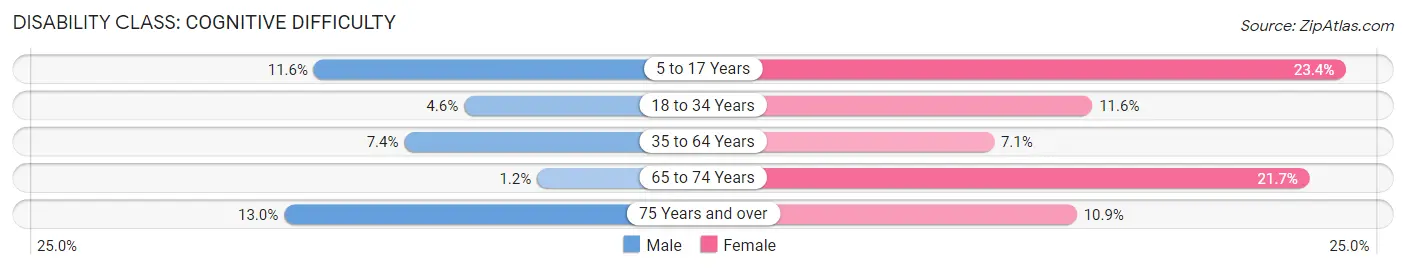
| Age Bracket | Male | Female |
| 5 to 17 Years | 49 (11.6%) | 106 (23.4%) |
| 18 to 34 Years | 32 (4.6%) | 64 (11.6%) |
| 35 to 64 Years | 70 (7.4%) | 56 (7.1%) |
| 65 to 74 Years | 2 (1.2%) | 38 (21.7%) |
| 75 Years and over | 7 (13.0%) | 23 (10.9%) |
Disability Class: Ambulatory Difficulty
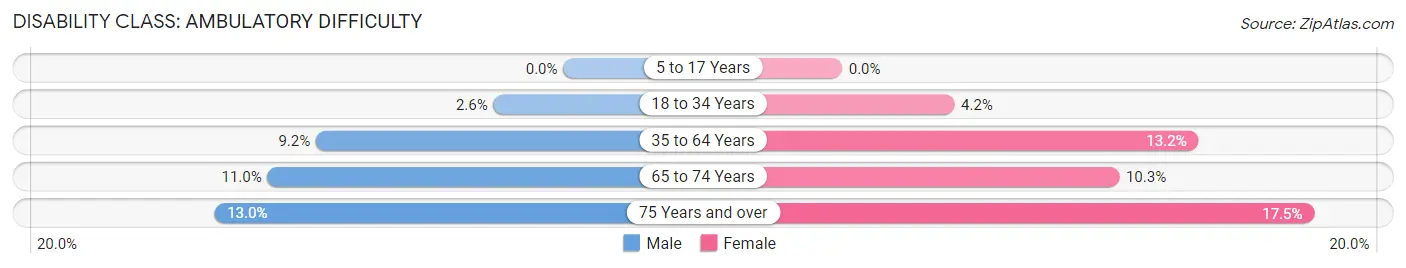
| Age Bracket | Male | Female |
| 5 to 17 Years | 0 (0.0%) | 0 (0.0%) |
| 18 to 34 Years | 18 (2.6%) | 23 (4.2%) |
| 35 to 64 Years | 87 (9.2%) | 105 (13.2%) |
| 65 to 74 Years | 18 (11.0%) | 18 (10.3%) |
| 75 Years and over | 7 (13.0%) | 37 (17.5%) |
Disability Class: Self-Care Difficulty
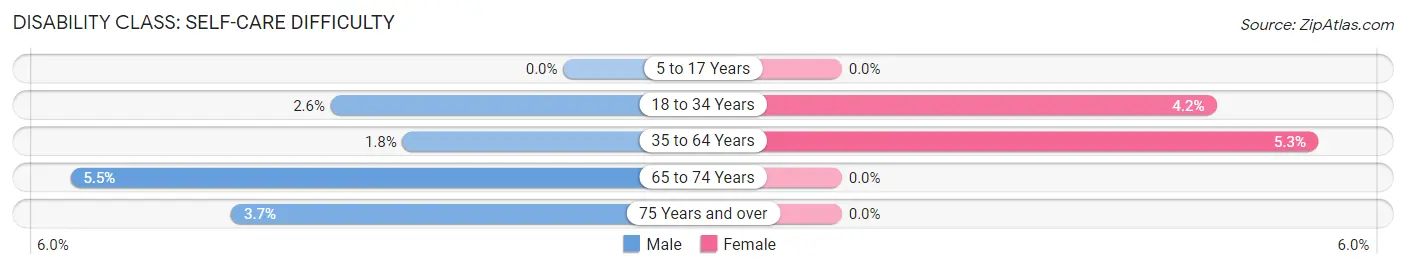
| Age Bracket | Male | Female |
| 5 to 17 Years | 0 (0.0%) | 0 (0.0%) |
| 18 to 34 Years | 18 (2.6%) | 23 (4.2%) |
| 35 to 64 Years | 17 (1.8%) | 42 (5.3%) |
| 65 to 74 Years | 9 (5.5%) | 0 (0.0%) |
| 75 Years and over | 2 (3.7%) | 0 (0.0%) |
Technology Access in Lindale
Computing Device Access in Lindale
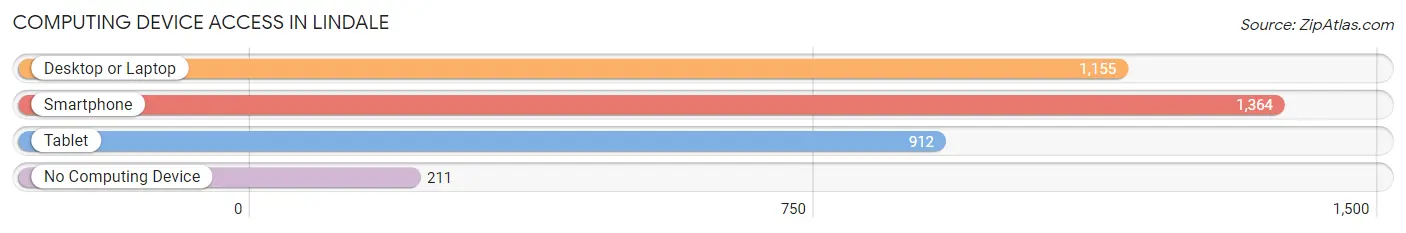
| Device Type | # Households | % Households |
| Desktop or Laptop | 1,155 | 69.0% |
| Smartphone | 1,364 | 81.4% |
| Tablet | 912 | 54.4% |
| No Computing Device | 211 | 12.6% |
| Total | 1,675 | 100.0% |
Internet Access in Lindale
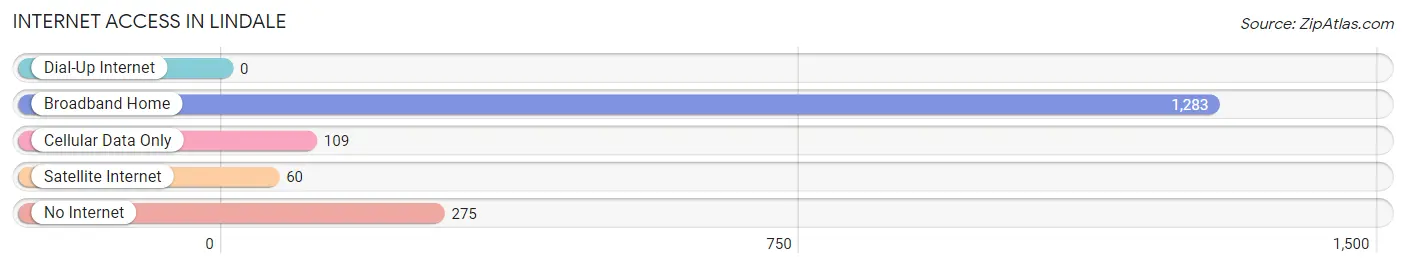
| Internet Type | # Households | % Households |
| Dial-Up Internet | 0 | 0.0% |
| Broadband Home | 1,283 | 76.6% |
| Cellular Data Only | 109 | 6.5% |
| Satellite Internet | 60 | 3.6% |
| No Internet | 275 | 16.4% |
| Total | 1,675 | 100.0% |
Lindale Summary
Lindale, Georgia is a small town located in Floyd County, Georgia. It is situated in the foothills of the Appalachian Mountains, approximately 20 miles northwest of Rome, Georgia. The town was founded in 1883 and was named after the Lindale family, who were early settlers in the area. The population of Lindale was estimated to be 1,845 in 2019.
History
The area that is now Lindale was originally inhabited by the Cherokee Indians. The first settlers in the area were the Lindale family, who arrived in 1883. The family built a small store and post office, which served as the center of the community. The town was officially incorporated in 1887.
In the early 1900s, the town began to grow and develop. The first school was built in 1906, and the first bank opened in 1908. The town also had a cotton gin, a grist mill, and a sawmill.
In the 1920s, the town experienced a period of growth and prosperity. The population increased from 500 to 1,000, and the town had several businesses, including a hotel, a movie theater, and a variety of stores.
In the 1950s, the town began to decline. The population decreased, and many businesses closed. The town was revitalized in the 1970s, when the Lindale Mall was built. The mall brought new businesses and jobs to the area, and the population began to increase again.
Geography
Lindale is located in the foothills of the Appalachian Mountains, approximately 20 miles northwest of Rome, Georgia. The town is situated on the banks of the Etowah River. The terrain is mostly hilly, with some flat areas. The climate is mild, with hot summers and cool winters.
Economy
The economy of Lindale is largely based on agriculture. The town is home to several farms, which produce a variety of crops, including corn, soybeans, and cotton. The town also has several manufacturing plants, which produce a variety of products, including furniture, clothing, and automotive parts.
The town is also home to several retail stores, restaurants, and other businesses. The Lindale Mall is the largest shopping center in the area, and it is home to a variety of stores, restaurants, and other businesses.
Demographics
The population of Lindale was estimated to be 1,845 in 2019. The racial makeup of the town is predominantly white (90.2%), with small percentages of African American (4.2%), Hispanic (2.7%), and Asian (1.2%) residents. The median household income is $41,944, and the median home value is $117,400.
The town is served by the Floyd County School District, which includes two elementary schools, one middle school, and one high school. The town also has several private schools, including a Catholic school and a Christian school.
Conclusion
Lindale, Georgia is a small town located in Floyd County, Georgia. It is situated in the foothills of the Appalachian Mountains, approximately 20 miles northwest of Rome, Georgia. The town was founded in 1883 and was named after the Lindale family, who were early settlers in the area. The population of Lindale was estimated to be 1,845 in 2019. The economy of Lindale is largely based on agriculture, and the town is home to several retail stores, restaurants, and other businesses. The racial makeup of the town is predominantly white, with small percentages of African American, Hispanic, and Asian residents. The town is served by the Floyd County School District, which includes two elementary schools, one middle school, and one high school.
Common Questions
What is Per Capita Income in Lindale?
Per Capita income in Lindale is $23,260.
What is the Median Family Income in Lindale?
Median Family Income in Lindale is $46,601.
What is the Median Household income in Lindale?
Median Household Income in Lindale is $39,472.
What is Income or Wage Gap in Lindale?
Income or Wage Gap in Lindale is 15.6%.
Women in Lindale earn 84.4 cents for every dollar earned by a man.
What is Family Income Deficit in Lindale?
Family Income Deficit in Lindale is $8,500.
Families that are below poverty line in Lindale earn $8,500 less on average than the poverty threshold level.
What is Inequality or Gini Index in Lindale?
Inequality or Gini Index in Lindale is 0.52.
What is the Total Population of Lindale?
Total Population of Lindale is 4,568.
What is the Total Male Population of Lindale?
Total Male Population of Lindale is 2,320.
What is the Total Female Population of Lindale?
Total Female Population of Lindale is 2,248.
What is the Ratio of Males per 100 Females in Lindale?
There are 103.20 Males per 100 Females in Lindale.
What is the Ratio of Females per 100 Males in Lindale?
There are 96.90 Females per 100 Males in Lindale.
What is the Median Population Age in Lindale?
Median Population Age in Lindale is 35.9 Years.
What is the Average Family Size in Lindale
Average Family Size in Lindale is 3.4 People.
What is the Average Household Size in Lindale
Average Household Size in Lindale is 2.7 People.
How Large is the Labor Force in Lindale?
There are 2,089 People in the Labor Forcein in Lindale.
What is the Percentage of People in the Labor Force in Lindale?
56.0% of People are in the Labor Force in Lindale.
What is the Unemployment Rate in Lindale?
Unemployment Rate in Lindale is 5.8%.