Phillipsburg, GA Map & Demographics
Phillipsburg Map
Phillipsburg Overview
$14,236
PER CAPITA INCOME
$23,942
AVG HOUSEHOLD INCOME
0.38
INEQUALITY / GINI INDEX
467
TOTAL POPULATION
271
MALE POPULATION
196
FEMALE POPULATION
138.27
MALES / 100 FEMALES
72.32
FEMALES / 100 MALES
31.1
MEDIAN AGE
3.1
AVG FAMILY SIZE
2.3
AVG HOUSEHOLD SIZE
60
LABOR FORCE [ PEOPLE ]
19.7%
PERCENT IN LABOR FORCE
Income in Phillipsburg
Income Overview in Phillipsburg
| Characteristic | Number | Measure |
| Per Capita Income | 467 | $14,236 |
| Median Family Income | 117 | $0 |
| Mean Family Income | 117 | $33,215 |
| Median Household Income | 201 | $23,942 |
| Mean Household Income | 201 | $29,882 |
| Income Deficit | 117 | $0 |
| Wage / Income Gap (%) | 467 | 0.00% |
| Wage / Income Gap ($) | 467 | 100.00¢ per $1 |
| Gini / Inequality Index | 467 | 0.38 |
Earnings by Sex in Phillipsburg
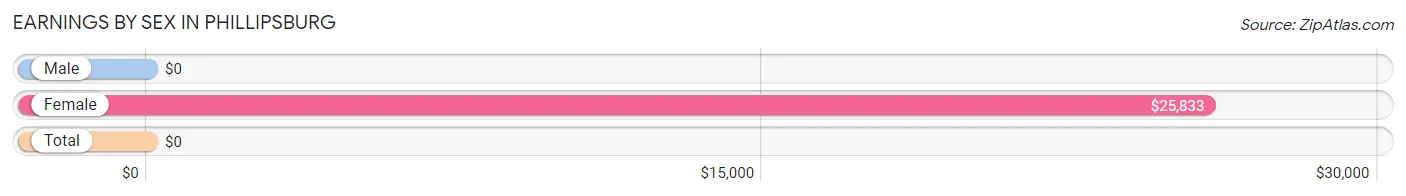
| Sex | Number | Average Earnings |
| Male | 78 (61.9%) | $0 |
| Female | 48 (38.1%) | $25,833 |
| Total | 126 (100.0%) | $0 |
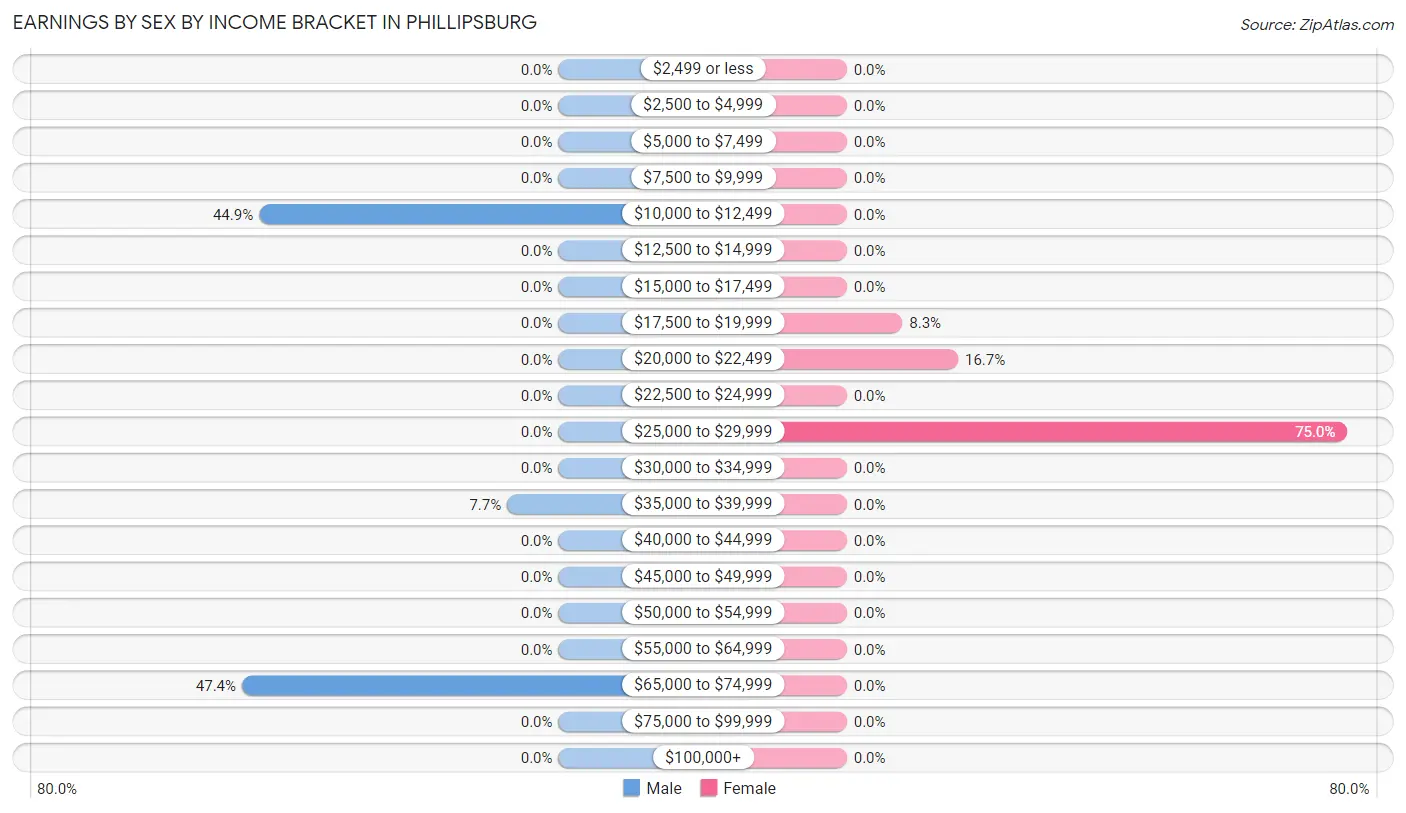
Earnings by Sex by Income Bracket in Phillipsburg
The most common earnings brackets in Phillipsburg are $65,000 to $74,999 for men (37 | 47.4%) and $25,000 to $29,999 for women (36 | 75.0%).
| Income | Male | Female |
| $2,499 or less | 0 (0.0%) | 0 (0.0%) |
| $2,500 to $4,999 | 0 (0.0%) | 0 (0.0%) |
| $5,000 to $7,499 | 0 (0.0%) | 0 (0.0%) |
| $7,500 to $9,999 | 0 (0.0%) | 0 (0.0%) |
| $10,000 to $12,499 | 35 (44.9%) | 0 (0.0%) |
| $12,500 to $14,999 | 0 (0.0%) | 0 (0.0%) |
| $15,000 to $17,499 | 0 (0.0%) | 0 (0.0%) |
| $17,500 to $19,999 | 0 (0.0%) | 4 (8.3%) |
| $20,000 to $22,499 | 0 (0.0%) | 8 (16.7%) |
| $22,500 to $24,999 | 0 (0.0%) | 0 (0.0%) |
| $25,000 to $29,999 | 0 (0.0%) | 36 (75.0%) |
| $30,000 to $34,999 | 0 (0.0%) | 0 (0.0%) |
| $35,000 to $39,999 | 6 (7.7%) | 0 (0.0%) |
| $40,000 to $44,999 | 0 (0.0%) | 0 (0.0%) |
| $45,000 to $49,999 | 0 (0.0%) | 0 (0.0%) |
| $50,000 to $54,999 | 0 (0.0%) | 0 (0.0%) |
| $55,000 to $64,999 | 0 (0.0%) | 0 (0.0%) |
| $65,000 to $74,999 | 37 (47.4%) | 0 (0.0%) |
| $75,000 to $99,999 | 0 (0.0%) | 0 (0.0%) |
| $100,000+ | 0 (0.0%) | 0 (0.0%) |
| Total | 78 (100.0%) | 48 (100.0%) |
Earnings by Sex by Educational Attainment in Phillipsburg
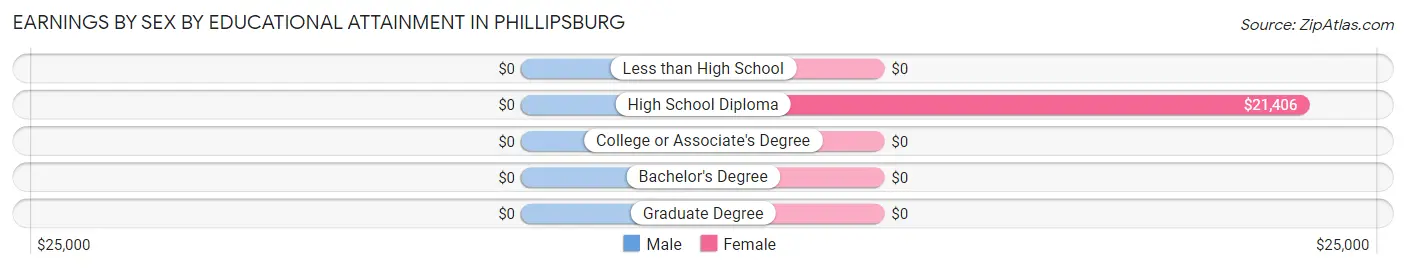
| Educational Attainment | Male Income | Female Income |
| Less than High School | - | - |
| High School Diploma | - | - |
| College or Associate's Degree | - | - |
| Bachelor's Degree | - | - |
| Graduate Degree | - | - |
| Total | - | - |
Family Income in Phillipsburg
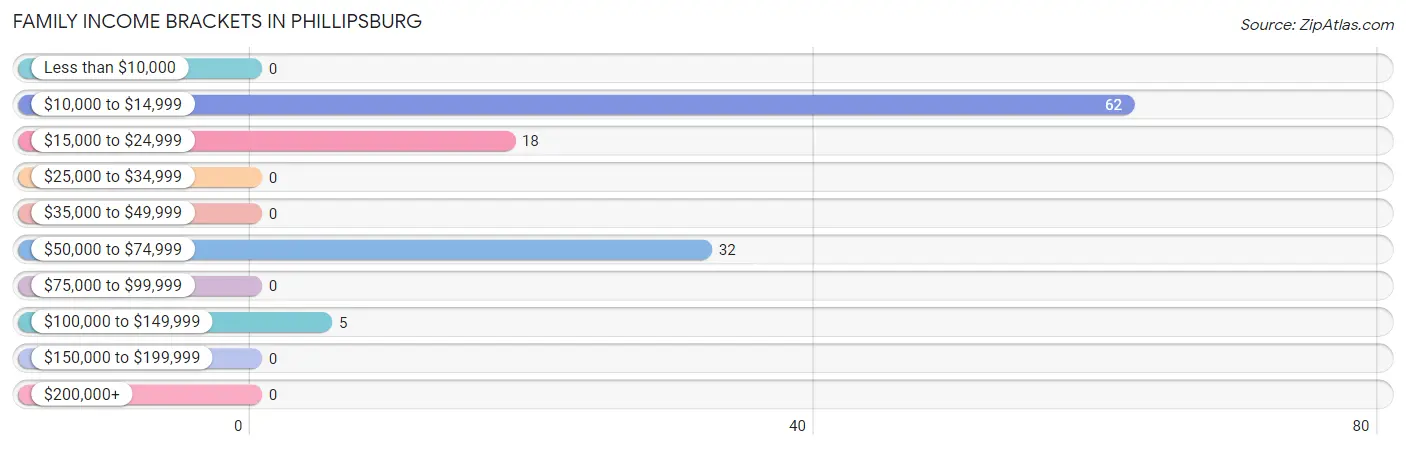
Family Income Brackets in Phillipsburg
According to the Phillipsburg family income data, there are 62 families falling into the $10,000 to $14,999 income range, which is the most common income bracket and makes up 53.0% of all families.
| Income Bracket | # Families | % Families |
| Less than $10,000 | 0 | 0.0% |
| $10,000 to $14,999 | 62 | 53.0% |
| $15,000 to $24,999 | 18 | 15.4% |
| $25,000 to $34,999 | 0 | 0.0% |
| $35,000 to $49,999 | 0 | 0.0% |
| $50,000 to $74,999 | 32 | 27.4% |
| $75,000 to $99,999 | 0 | 0.0% |
| $100,000 to $149,999 | 5 | 4.3% |
| $150,000 to $199,999 | 0 | 0.0% |
| $200,000+ | 0 | 0.0% |
Family Income by Famaliy Size in Phillipsburg
| Income Bracket | # Families | Median Income |
| 2-Person Families | 45 (38.5%) | $0 |
| 3-Person Families | 32 (27.4%) | $0 |
| 4-Person Families | 40 (34.2%) | $0 |
| 5-Person Families | 0 (0.0%) | $0 |
| 6-Person Families | 0 (0.0%) | $0 |
| 7+ Person Families | 0 (0.0%) | $0 |
| Total | 117 (100.0%) | $0 |
Family Income by Number of Earners in Phillipsburg
| Number of Earners | # Families | Median Income |
| No Earners | 45 (38.5%) | $0 |
| 1 Earner | 67 (57.3%) | $0 |
| 2 Earners | 5 (4.3%) | $0 |
| 3+ Earners | 0 (0.0%) | $0 |
| Total | 117 (100.0%) | $0 |
Household Income in Phillipsburg
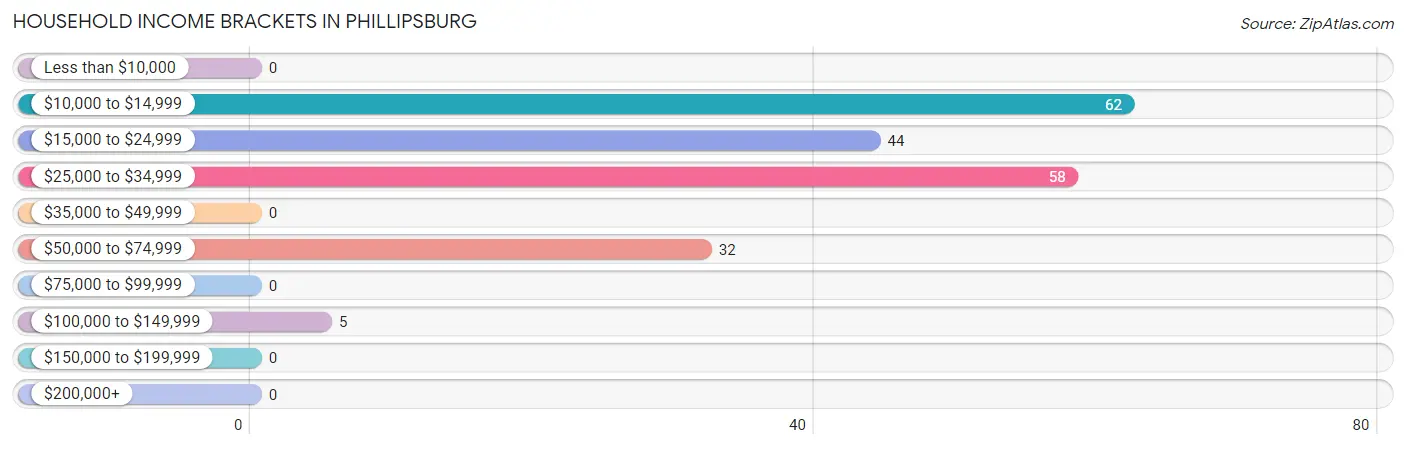
Household Income Brackets in Phillipsburg
With 62 households falling in the category, the $10,000 to $14,999 income range is the most frequent in Phillipsburg, accounting for 30.8% of all households.
| Income Bracket | # Households | % Households |
| Less than $10,000 | 0 | 0.0% |
| $10,000 to $14,999 | 62 | 30.8% |
| $15,000 to $24,999 | 44 | 21.9% |
| $25,000 to $34,999 | 58 | 28.9% |
| $35,000 to $49,999 | 0 | 0.0% |
| $50,000 to $74,999 | 32 | 15.9% |
| $75,000 to $99,999 | 0 | 0.0% |
| $100,000 to $149,999 | 5 | 2.5% |
| $150,000 to $199,999 | 0 | 0.0% |
| $200,000+ | 0 | 0.0% |
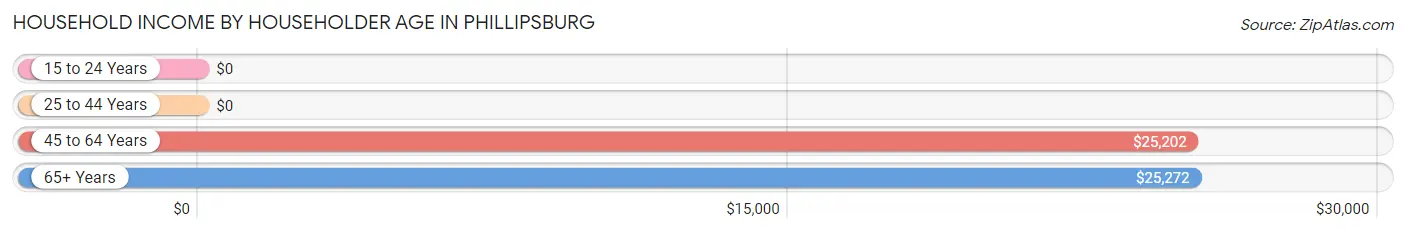
Household Income by Householder Age in Phillipsburg
The median household income in Phillipsburg is $23,942, with the highest median household income of $25,272 found in the 65+ years age bracket for the primary householder. A total of 41 households (20.4%) fall into this category.
| Income Bracket | # Households | Median Income |
| 15 to 24 Years | 0 (0.0%) | $0 |
| 25 to 44 Years | 85 (42.3%) | $0 |
| 45 to 64 Years | 75 (37.3%) | $25,202 |
| 65+ Years | 41 (20.4%) | $25,272 |
| Total | 201 (100.0%) | $23,942 |
Poverty in Phillipsburg
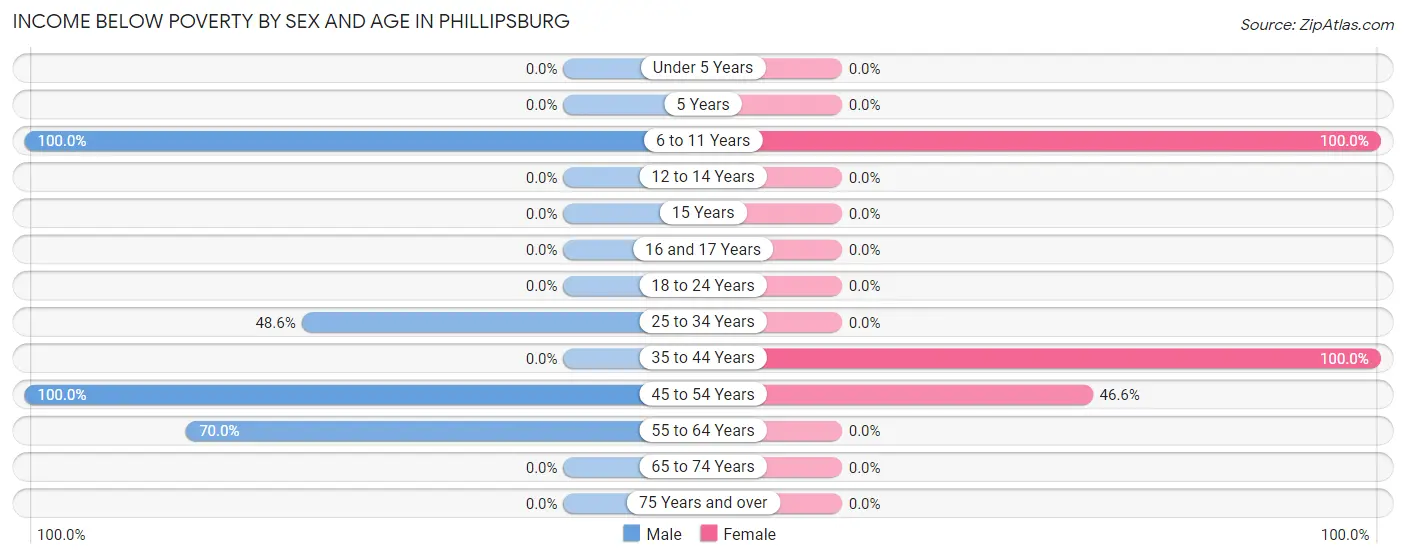
Income Below Poverty by Sex and Age in Phillipsburg
With 65.7% poverty level for males and 38.8% for females among the residents of Phillipsburg, 6 to 11 year old males and 6 to 11 year old females are the most vulnerable to poverty, with 109 males (100.0%) and 31 females (100.0%) in their respective age groups living below the poverty level.
| Age Bracket | Male | Female |
| Under 5 Years | 0 (0.0%) | 0 (0.0%) |
| 5 Years | 0 (0.0%) | 0 (0.0%) |
| 6 to 11 Years | 109 (100.0%) | 31 (100.0%) |
| 12 to 14 Years | 0 (0.0%) | 0 (0.0%) |
| 15 Years | 0 (0.0%) | 0 (0.0%) |
| 16 and 17 Years | 0 (0.0%) | 0 (0.0%) |
| 18 to 24 Years | 0 (0.0%) | 0 (0.0%) |
| 25 to 34 Years | 35 (48.6%) | 0 (0.0%) |
| 35 to 44 Years | 0 (0.0%) | 18 (100.0%) |
| 45 to 54 Years | 20 (100.0%) | 27 (46.6%) |
| 55 to 64 Years | 14 (70.0%) | 0 (0.0%) |
| 65 to 74 Years | 0 (0.0%) | 0 (0.0%) |
| 75 Years and over | 0 (0.0%) | 0 (0.0%) |
| Total | 178 (65.7%) | 76 (38.8%) |
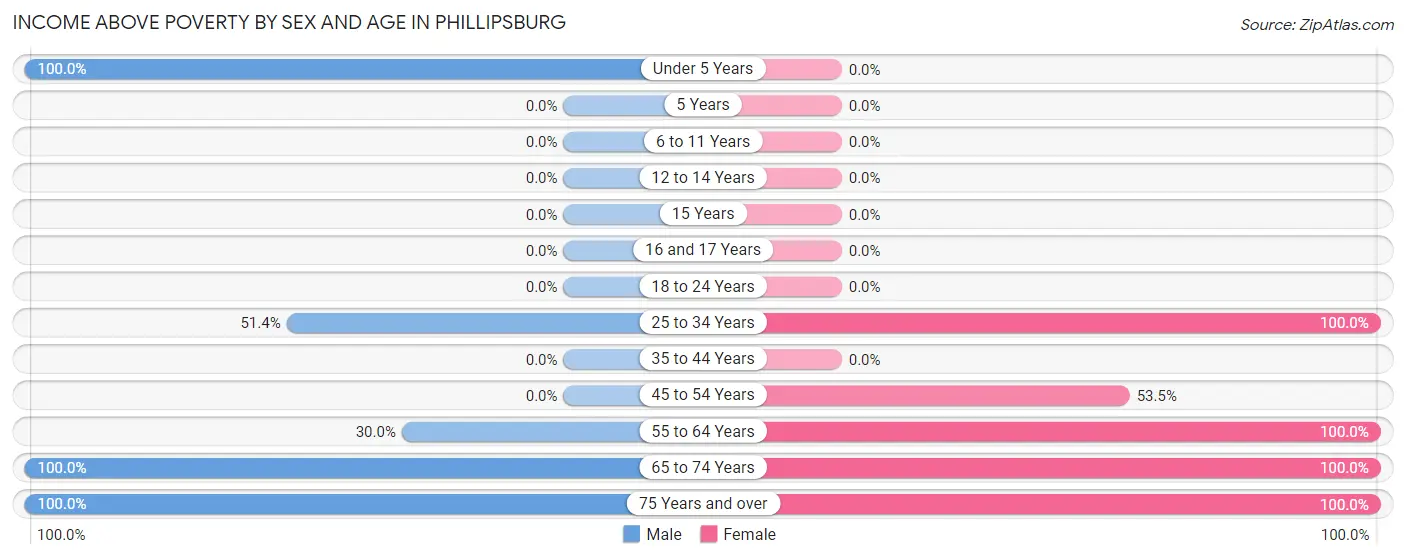
Income Above Poverty by Sex and Age in Phillipsburg
According to the poverty statistics in Phillipsburg, males aged under 5 years and females aged 25 to 34 years are the age groups that are most secure financially, with 100.0% of males and 100.0% of females in these age groups living above the poverty line.
| Age Bracket | Male | Female |
| Under 5 Years | 22 (100.0%) | 0 (0.0%) |
| 5 Years | 0 (0.0%) | 0 (0.0%) |
| 6 to 11 Years | 0 (0.0%) | 0 (0.0%) |
| 12 to 14 Years | 0 (0.0%) | 0 (0.0%) |
| 15 Years | 0 (0.0%) | 0 (0.0%) |
| 16 and 17 Years | 0 (0.0%) | 0 (0.0%) |
| 18 to 24 Years | 0 (0.0%) | 0 (0.0%) |
| 25 to 34 Years | 37 (51.4%) | 32 (100.0%) |
| 35 to 44 Years | 0 (0.0%) | 0 (0.0%) |
| 45 to 54 Years | 0 (0.0%) | 31 (53.4%) |
| 55 to 64 Years | 6 (30.0%) | 17 (100.0%) |
| 65 to 74 Years | 15 (100.0%) | 23 (100.0%) |
| 75 Years and over | 13 (100.0%) | 17 (100.0%) |
| Total | 93 (34.3%) | 120 (61.2%) |
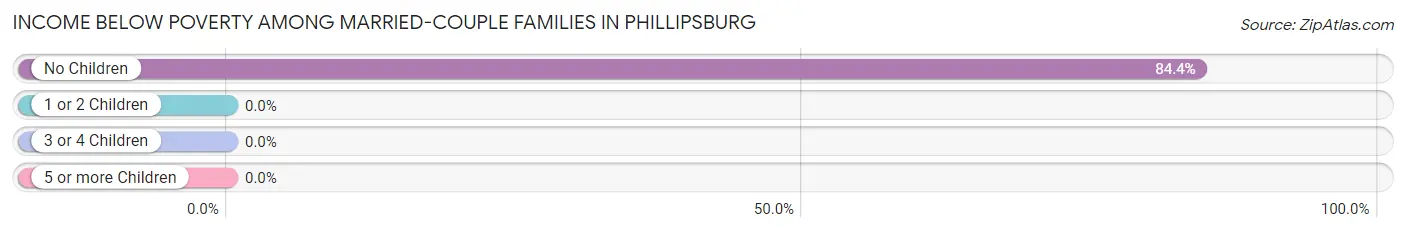
Income Below Poverty Among Married-Couple Families in Phillipsburg
The poverty statistics for married-couple families in Phillipsburg show that 42.2% or 27 of the total 64 families live below the poverty line. Families with no children have the highest poverty rate of 84.4%, comprising of 27 families. On the other hand, families with 1 or 2 children have the lowest poverty rate of 0.0%, which includes 0 families.
| Children | Above Poverty | Below Poverty |
| No Children | 5 (15.6%) | 27 (84.4%) |
| 1 or 2 Children | 32 (100.0%) | 0 (0.0%) |
| 3 or 4 Children | 0 (0.0%) | 0 (0.0%) |
| 5 or more Children | 0 (0.0%) | 0 (0.0%) |
| Total | 37 (57.8%) | 27 (42.2%) |
Income Below Poverty Among Single-Parent Households in Phillipsburg
According to the poverty data in Phillipsburg, 100.0% or 35 single-father households and 100.0% or 18 single-mother households are living below the poverty line. Among single-father households, those with 3 or 4 children have the highest poverty rate, with 35 households (100.0%) experiencing poverty. Likewise, among single-mother households, those with 1 or 2 children have the highest poverty rate, with 18 households (100.0%) falling below the poverty line.
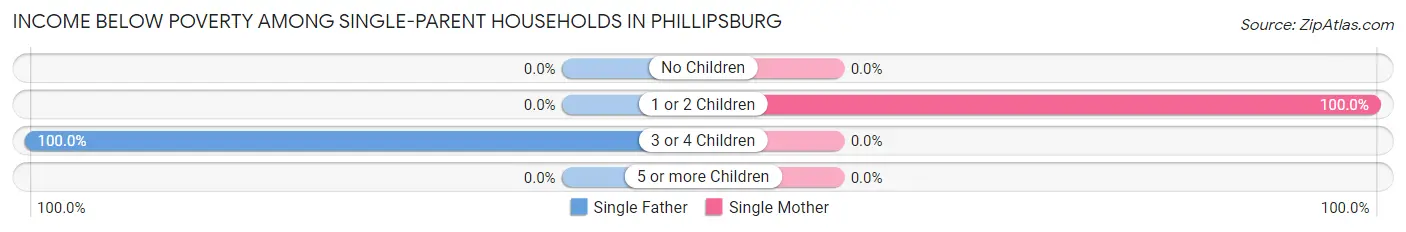
| Children | Single Father | Single Mother |
| No Children | 0 (0.0%) | 0 (0.0%) |
| 1 or 2 Children | 0 (0.0%) | 18 (100.0%) |
| 3 or 4 Children | 35 (100.0%) | 0 (0.0%) |
| 5 or more Children | 0 (0.0%) | 0 (0.0%) |
| Total | 35 (100.0%) | 18 (100.0%) |
Income Below Poverty Among Married-Couple vs Single-Parent Households in Phillipsburg
The poverty data for Phillipsburg shows that 27 of the married-couple family households (42.2%) and 53 of the single-parent households (100.0%) are living below the poverty level. Within the married-couple family households, those with no children have the highest poverty rate, with 27 households (84.4%) falling below the poverty line. Among the single-parent households, those with 1 or 2 children have the highest poverty rate, with 18 household (100.0%) living below poverty.
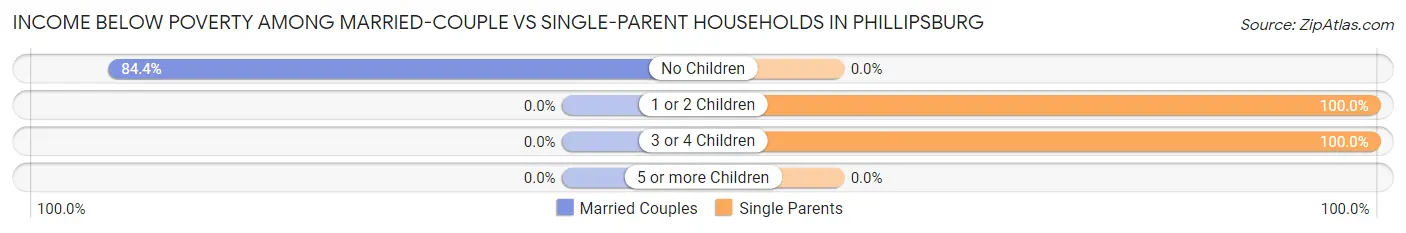
| Children | Married-Couple Families | Single-Parent Households |
| No Children | 27 (84.4%) | 0 (0.0%) |
| 1 or 2 Children | 0 (0.0%) | 18 (100.0%) |
| 3 or 4 Children | 0 (0.0%) | 35 (100.0%) |
| 5 or more Children | 0 (0.0%) | 0 (0.0%) |
| Total | 27 (42.2%) | 53 (100.0%) |
Race in Phillipsburg
The most populous races in Phillipsburg are Black / African American (304 | 65.1%), and Two or more Races (163 | 34.9%).
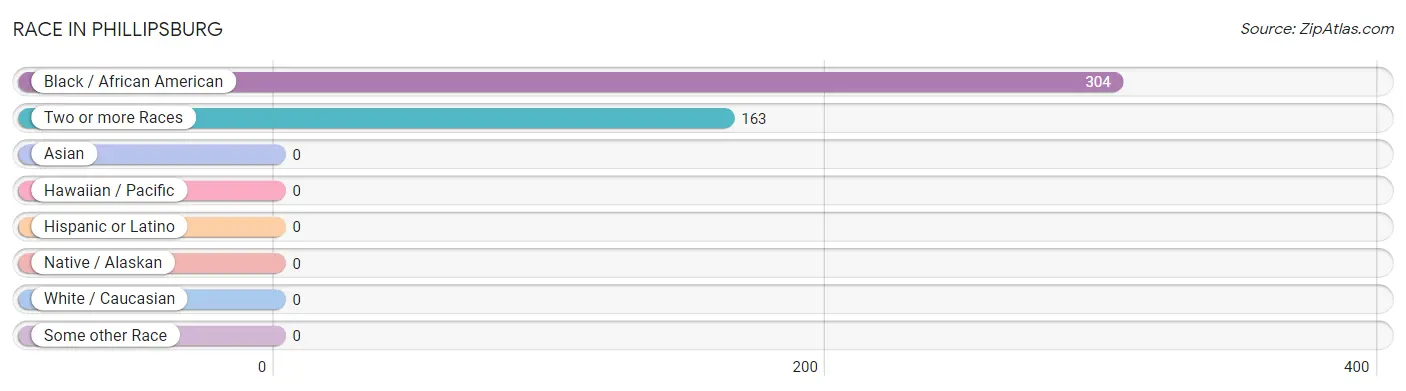
| Race | # Population | % Population |
| Asian | 0 | 0.0% |
| Black / African American | 304 | 65.1% |
| Hawaiian / Pacific | 0 | 0.0% |
| Hispanic or Latino | 0 | 0.0% |
| Native / Alaskan | 0 | 0.0% |
| White / Caucasian | 0 | 0.0% |
| Two or more Races | 163 | 34.9% |
| Some other Race | 0 | 0.0% |
| Total | 467 | 100.0% |
Ancestry in Phillipsburg
The most populous ancestries reported in Phillipsburg are American (122 | 26.1%), African (13 | 2.8%), and Subsaharan African (13 | 2.8%), together accounting for 31.7% of all Phillipsburg residents.
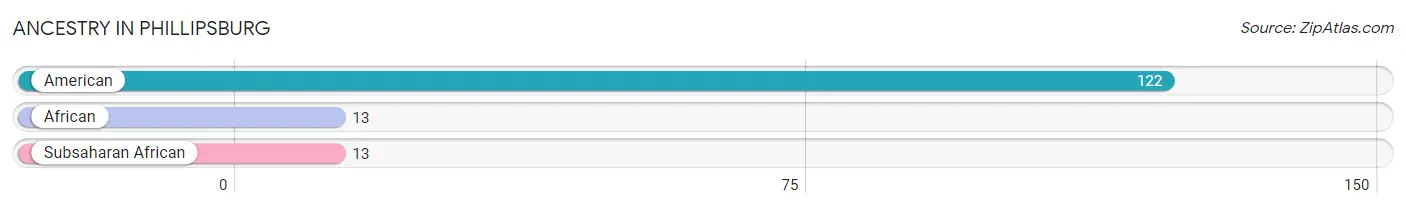
| Ancestry | # Population | % Population |
| African | 13 | 2.8% |
| American | 122 | 26.1% |
| Subsaharan African | 13 | 2.8% | View All 3 Rows |
Immigrants in Phillipsburg

| Immigration Origin | # Population | % Population | View All 0 Rows |
Sex and Age in Phillipsburg
Sex and Age in Phillipsburg
The most populous age groups in Phillipsburg are 10 to 14 Years (55 | 20.3%) for men and 25 to 29 Years (32 | 16.3%) for women.
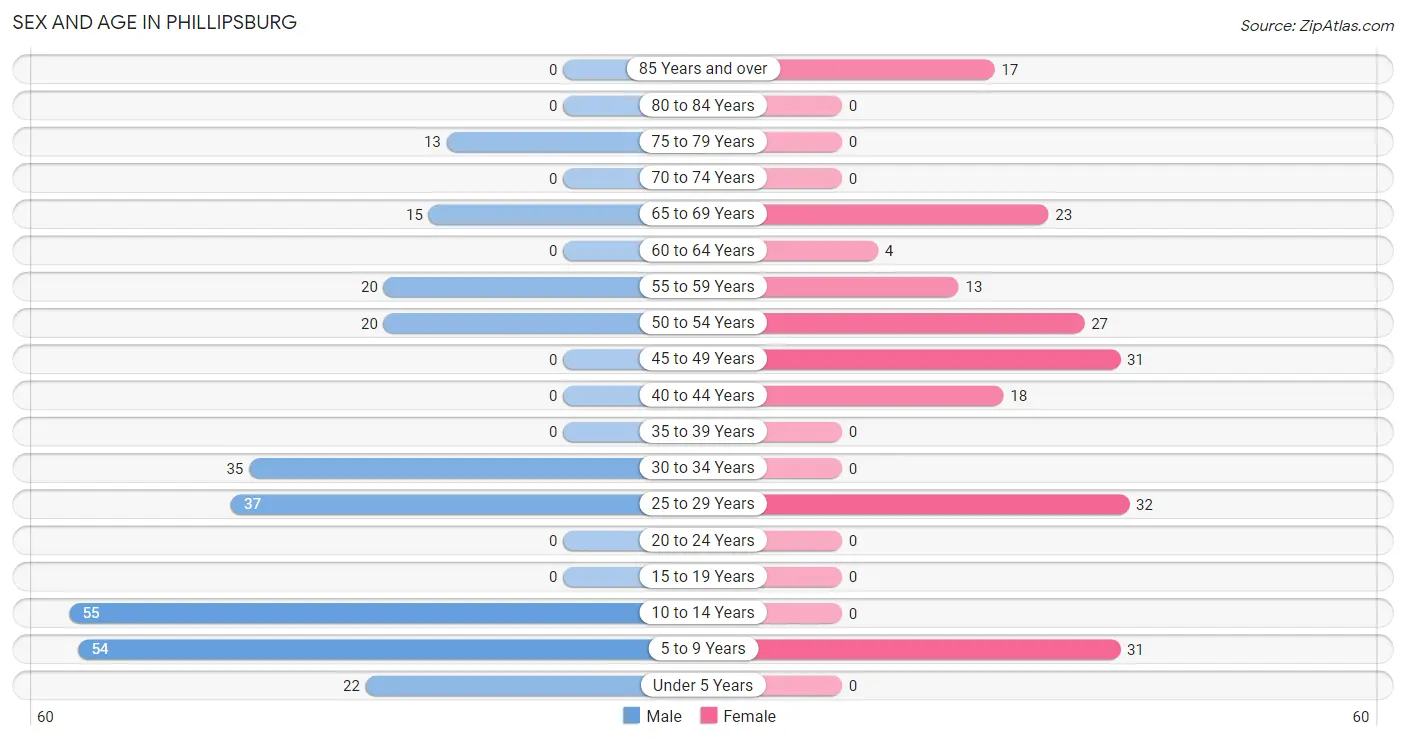
| Age Bracket | Male | Female |
| Under 5 Years | 22 (8.1%) | 0 (0.0%) |
| 5 to 9 Years | 54 (19.9%) | 31 (15.8%) |
| 10 to 14 Years | 55 (20.3%) | 0 (0.0%) |
| 15 to 19 Years | 0 (0.0%) | 0 (0.0%) |
| 20 to 24 Years | 0 (0.0%) | 0 (0.0%) |
| 25 to 29 Years | 37 (13.7%) | 32 (16.3%) |
| 30 to 34 Years | 35 (12.9%) | 0 (0.0%) |
| 35 to 39 Years | 0 (0.0%) | 0 (0.0%) |
| 40 to 44 Years | 0 (0.0%) | 18 (9.2%) |
| 45 to 49 Years | 0 (0.0%) | 31 (15.8%) |
| 50 to 54 Years | 20 (7.4%) | 27 (13.8%) |
| 55 to 59 Years | 20 (7.4%) | 13 (6.6%) |
| 60 to 64 Years | 0 (0.0%) | 4 (2.0%) |
| 65 to 69 Years | 15 (5.5%) | 23 (11.7%) |
| 70 to 74 Years | 0 (0.0%) | 0 (0.0%) |
| 75 to 79 Years | 13 (4.8%) | 0 (0.0%) |
| 80 to 84 Years | 0 (0.0%) | 0 (0.0%) |
| 85 Years and over | 0 (0.0%) | 17 (8.7%) |
| Total | 271 (100.0%) | 196 (100.0%) |
Families and Households in Phillipsburg
Median Family Size in Phillipsburg
The median family size in Phillipsburg is 3.15 persons per family, with single male/father families (35 | 29.9%) accounting for the largest median family size of 4.66 persons per family. On the other hand, single female/mother families (18 | 15.4%) represent the smallest median family size with 1.67 persons per family.
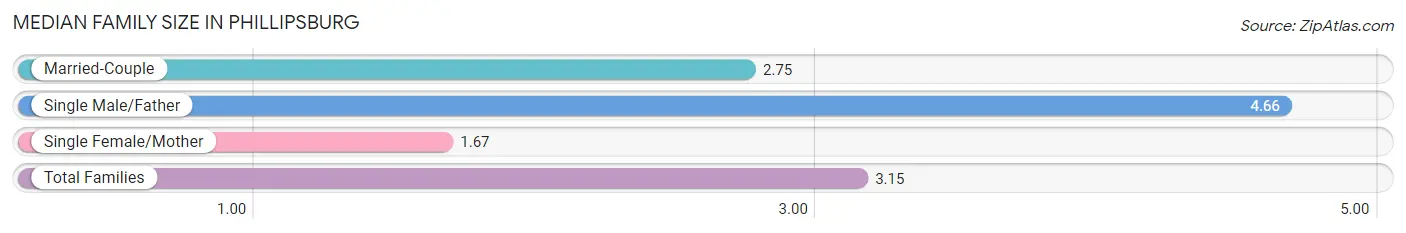
| Family Type | # Families | Family Size |
| Married-Couple | 64 (54.7%) | 2.75 |
| Single Male/Father | 35 (29.9%) | 4.66 |
| Single Female/Mother | 18 (15.4%) | 1.67 |
| Total Families | 117 (100.0%) | 3.15 |
Median Household Size in Phillipsburg
The median household size in Phillipsburg is 2.32 persons per household, with single male/father households (35 | 17.4%) accounting for the largest median household size of 4.66 persons per household. non-family households (84 | 41.8%) represent the smallest median household size with 1.17 persons per household.
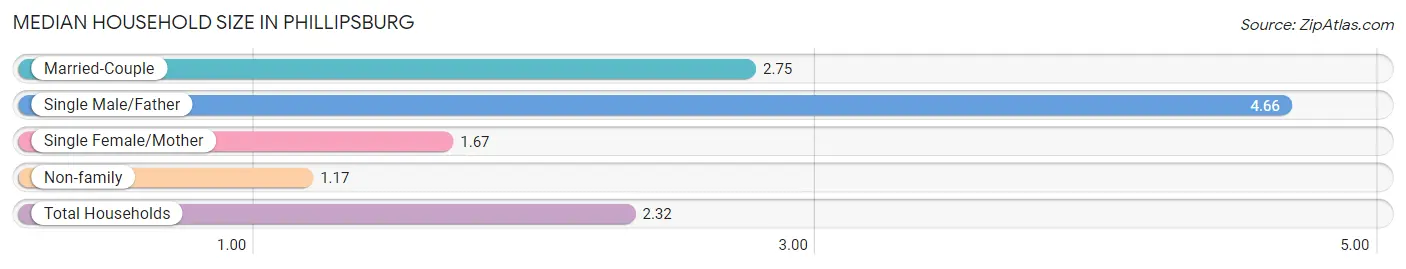
| Household Type | # Households | Household Size |
| Married-Couple | 64 (31.8%) | 2.75 |
| Single Male/Father | 35 (17.4%) | 4.66 |
| Single Female/Mother | 18 (9.0%) | 1.67 |
| Non-family | 84 (41.8%) | 1.17 |
| Total Households | 201 (100.0%) | 2.32 |
Household Size by Marriage Status in Phillipsburg
Out of a total of 201 households in Phillipsburg, 117 (58.2%) are family households, while 84 (41.8%) are nonfamily households. The most numerous type of family households are 2-person households, comprising 45, and the most common type of nonfamily households are 1-person households, comprising 76.
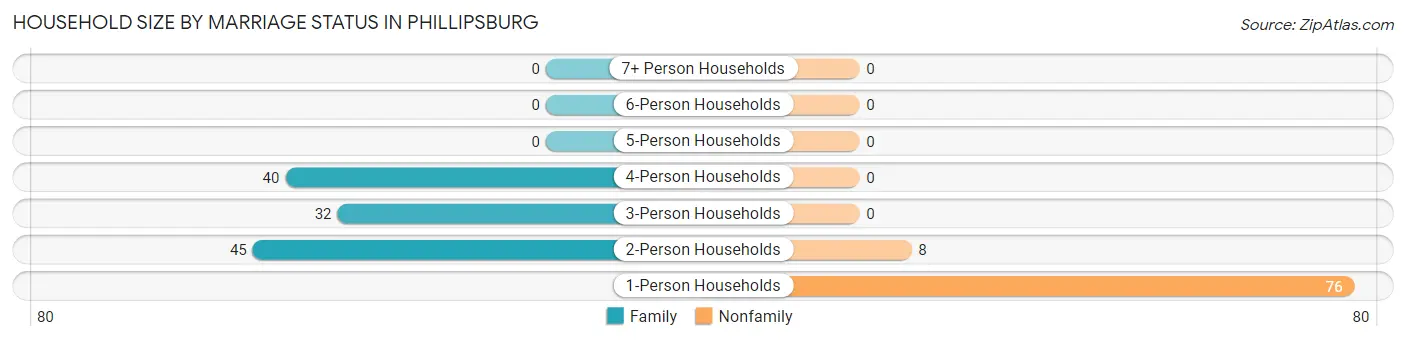
| Household Size | Family Households | Nonfamily Households |
| 1-Person Households | - | 76 (37.8%) |
| 2-Person Households | 45 (22.4%) | 8 (4.0%) |
| 3-Person Households | 32 (15.9%) | 0 (0.0%) |
| 4-Person Households | 40 (19.9%) | 0 (0.0%) |
| 5-Person Households | 0 (0.0%) | 0 (0.0%) |
| 6-Person Households | 0 (0.0%) | 0 (0.0%) |
| 7+ Person Households | 0 (0.0%) | 0 (0.0%) |
| Total | 117 (58.2%) | 84 (41.8%) |
Female Fertility in Phillipsburg
Fertility by Age in Phillipsburg
| Age Bracket | Women with Births | Births / 1,000 Women |
| 15 to 19 years | 0 (0.0%) | 0.0 |
| 20 to 34 years | 0 (0.0%) | 0.0 |
| 35 to 50 years | 0 (0.0%) | 0.0 |
| Total | 0 (0.0%) | 0.0 |
Fertility by Age by Marriage Status in Phillipsburg
| Age Bracket | Married | Unmarried |
| 15 to 19 years | 0 (0.0%) | 0 (0.0%) |
| 20 to 34 years | 0 (0.0%) | 0 (0.0%) |
| 35 to 50 years | 0 (0.0%) | 0 (0.0%) |
| Total | 0 (0.0%) | 0 (0.0%) |
Fertility by Education in Phillipsburg
| Educational Attainment | Women with Births | Births / 1,000 Women |
| Less than High School | 0 (0.0%) | 0.0 |
| High School Diploma | 0 (0.0%) | 0.0 |
| College or Associate's Degree | 0 (0.0%) | 0.0 |
| Bachelor's Degree | 0 (0.0%) | 0.0 |
| Graduate Degree | 0 (0.0%) | 0.0 |
| Total | 0 (0.0%) | 0.0 |
Fertility by Education by Marriage Status in Phillipsburg
| Educational Attainment | Married | Unmarried |
| Less than High School | 0 (0.0%) | 0 (0.0%) |
| High School Diploma | 0 (0.0%) | 0 (0.0%) |
| College or Associate's Degree | 0 (0.0%) | 0 (0.0%) |
| Bachelor's Degree | 0 (0.0%) | 0 (0.0%) |
| Graduate Degree | 0 (0.0%) | 0 (0.0%) |
| Total | 0 (0.0%) | 0 (0.0%) |
Employment Characteristics in Phillipsburg
Employment by Class of Employer in Phillipsburg
Among the 52 employed individuals in Phillipsburg, private company employees (47 | 90.4%), and state government employees (5 | 9.6%) make up the most common classes of employment.
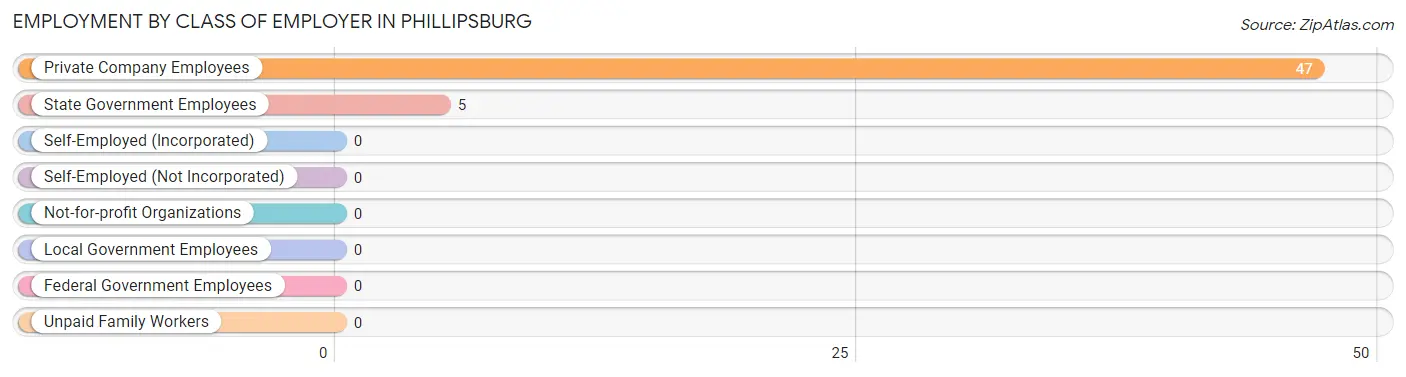
| Employer Class | # Employees | % Employees |
| Private Company Employees | 47 | 90.4% |
| Self-Employed (Incorporated) | 0 | 0.0% |
| Self-Employed (Not Incorporated) | 0 | 0.0% |
| Not-for-profit Organizations | 0 | 0.0% |
| Local Government Employees | 0 | 0.0% |
| State Government Employees | 5 | 9.6% |
| Federal Government Employees | 0 | 0.0% |
| Unpaid Family Workers | 0 | 0.0% |
| Total | 52 | 100.0% |
Employment Status by Age in Phillipsburg
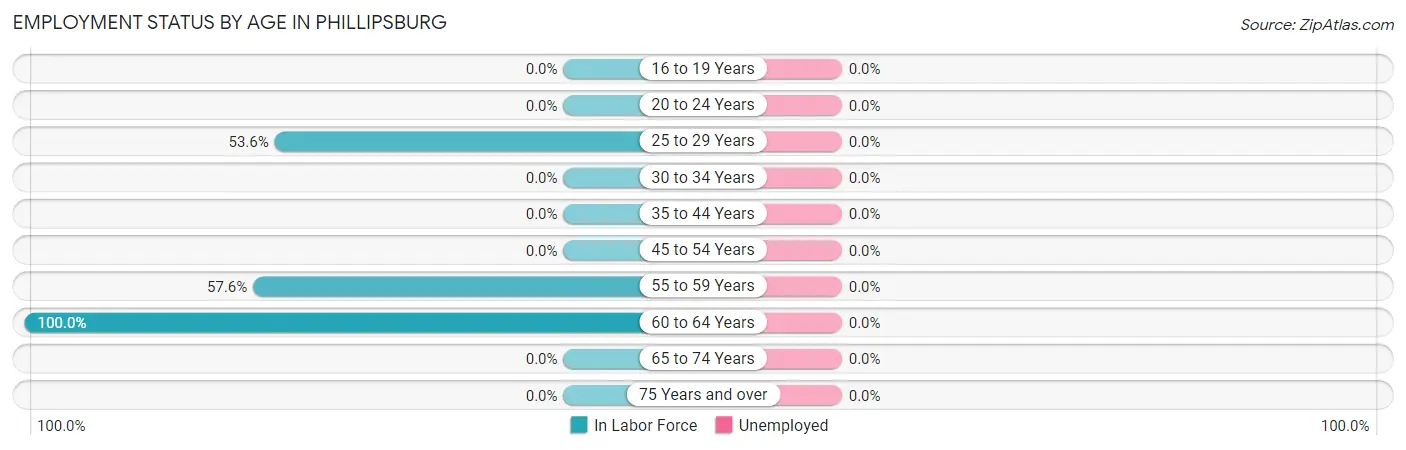
| Age Bracket | In Labor Force | Unemployed |
| 16 to 19 Years | 0 (0.0%) | 0 (0.0%) |
| 20 to 24 Years | 0 (0.0%) | 0 (0.0%) |
| 25 to 29 Years | 37 (53.6%) | 0 (0.0%) |
| 30 to 34 Years | 0 (0.0%) | 0 (0.0%) |
| 35 to 44 Years | 0 (0.0%) | 0 (0.0%) |
| 45 to 54 Years | 0 (0.0%) | 0 (0.0%) |
| 55 to 59 Years | 19 (57.6%) | 0 (0.0%) |
| 60 to 64 Years | 4 (100.0%) | 0 (0.0%) |
| 65 to 74 Years | 0 (0.0%) | 0 (0.0%) |
| 75 Years and over | 0 (0.0%) | 0 (0.0%) |
| Total | 60 (19.7%) | 0 (0.0%) |
Employment Status by Educational Attainment in Phillipsburg
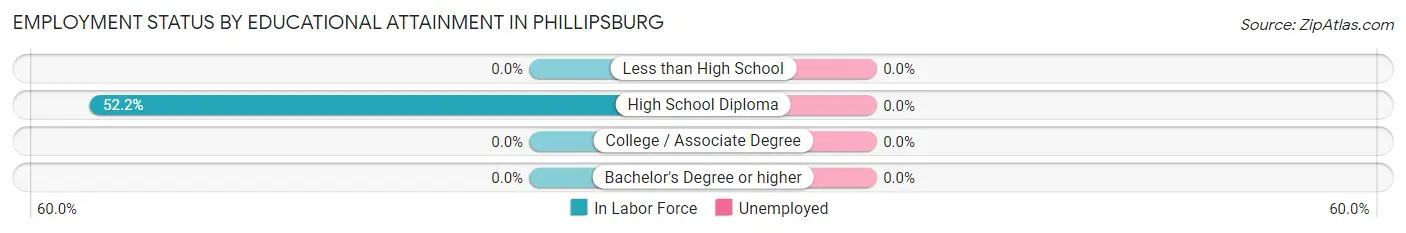
| Educational Attainment | In Labor Force | Unemployed |
| Less than High School | 0 (0.0%) | 0 (0.0%) |
| High School Diploma | 60 (52.2%) | 0 (0.0%) |
| College / Associate Degree | 0 (0.0%) | 0 (0.0%) |
| Bachelor's Degree or higher | 0 (0.0%) | 0 (0.0%) |
| Total | 60 (25.3%) | 0 (0.0%) |
Employment Occupations by Sex in Phillipsburg
Management, Business, Science and Arts Occupations
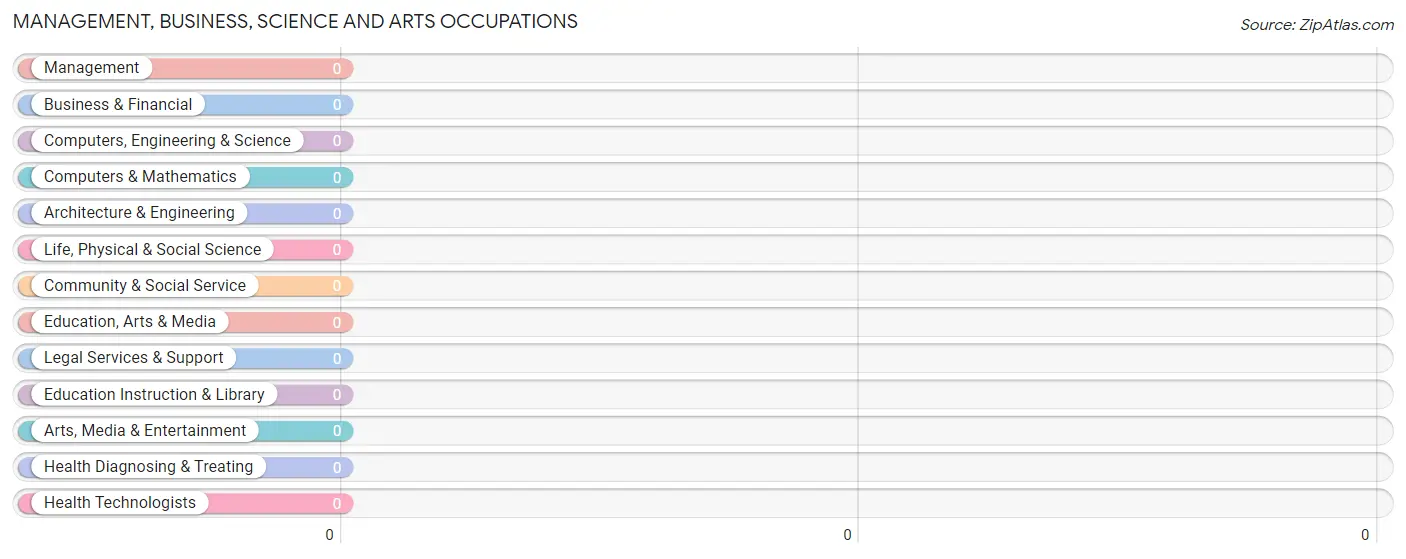
Management, Business, Science and Arts Occupations by Sex
| Occupation | Male | Female |
| Management | 0 (0.0%) | 0 (0.0%) |
| Business & Financial | 0 (0.0%) | 0 (0.0%) |
| Computers, Engineering & Science | 0 (0.0%) | 0 (0.0%) |
| Computers & Mathematics | 0 (0.0%) | 0 (0.0%) |
| Architecture & Engineering | 0 (0.0%) | 0 (0.0%) |
| Life, Physical & Social Science | 0 (0.0%) | 0 (0.0%) |
| Community & Social Service | 0 (0.0%) | 0 (0.0%) |
| Education, Arts & Media | 0 (0.0%) | 0 (0.0%) |
| Legal Services & Support | 0 (0.0%) | 0 (0.0%) |
| Education Instruction & Library | 0 (0.0%) | 0 (0.0%) |
| Arts, Media & Entertainment | 0 (0.0%) | 0 (0.0%) |
| Health Diagnosing & Treating | 0 (0.0%) | 0 (0.0%) |
| Health Technologists | 0 (0.0%) | 0 (0.0%) |
| Total (Category) | 0 (0.0%) | 0 (0.0%) |
| Total (Overall) | 43 (71.7%) | 17 (28.3%) |
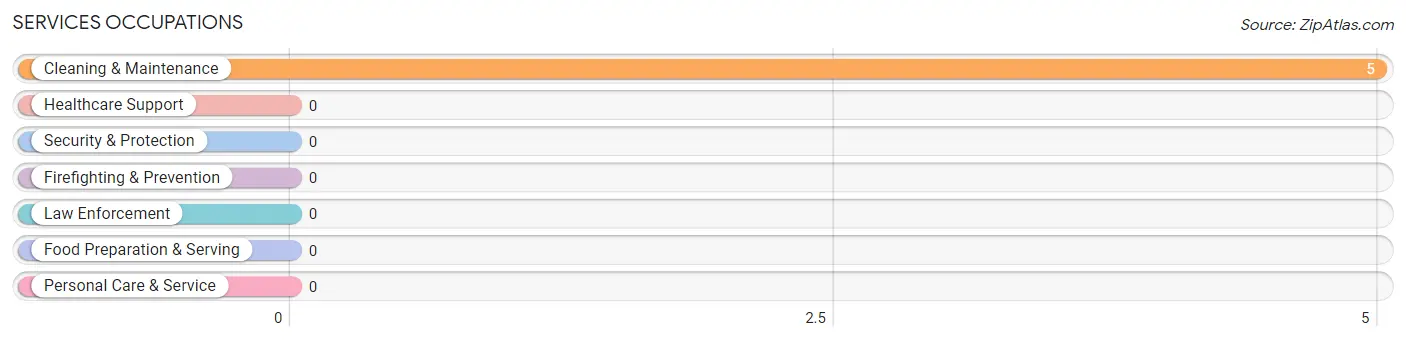
Services Occupations
The most common Services occupations in Phillipsburg are , and Cleaning & Maintenance (5 | 8.3%).
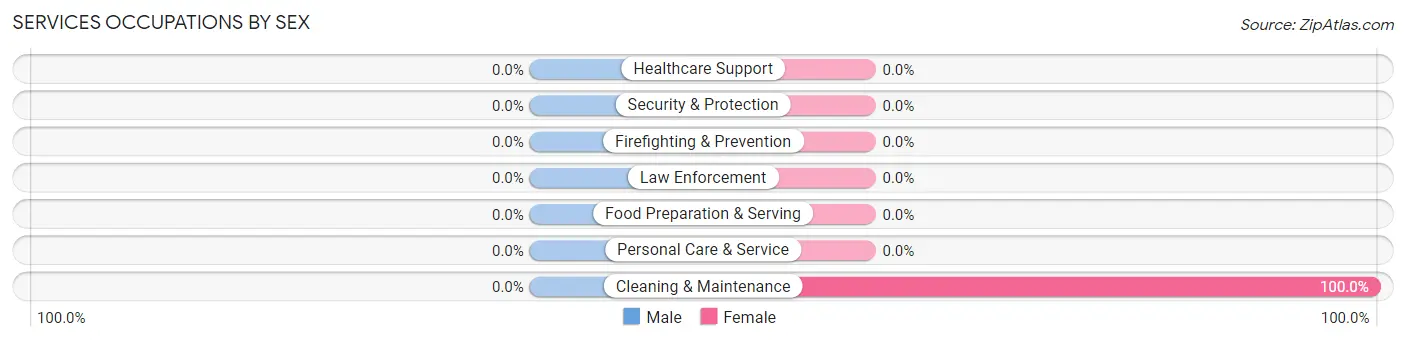
Services Occupations by Sex
| Occupation | Male | Female |
| Healthcare Support | 0 (0.0%) | 0 (0.0%) |
| Security & Protection | 0 (0.0%) | 0 (0.0%) |
| Firefighting & Prevention | 0 (0.0%) | 0 (0.0%) |
| Law Enforcement | 0 (0.0%) | 0 (0.0%) |
| Food Preparation & Serving | 0 (0.0%) | 0 (0.0%) |
| Cleaning & Maintenance | 0 (0.0%) | 5 (100.0%) |
| Personal Care & Service | 0 (0.0%) | 0 (0.0%) |
| Total (Category) | 0 (0.0%) | 5 (100.0%) |
| Total (Overall) | 43 (71.7%) | 17 (28.3%) |
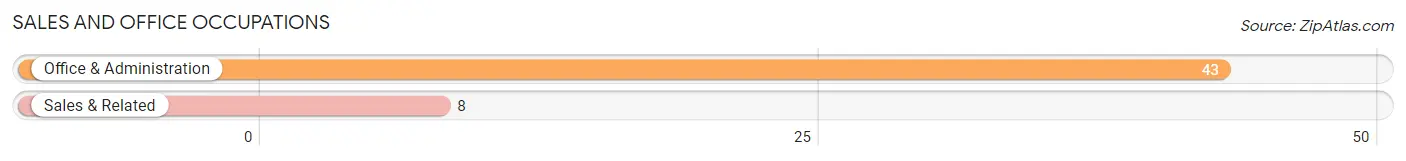
Sales and Office Occupations
The most common Sales and Office occupations in Phillipsburg are Office & Administration (43 | 71.7%), and Sales & Related (8 | 13.3%).
Sales and Office Occupations by Sex

| Occupation | Male | Female |
| Sales & Related | 0 (0.0%) | 8 (100.0%) |
| Office & Administration | 43 (100.0%) | 0 (0.0%) |
| Total (Category) | 43 (84.3%) | 8 (15.7%) |
| Total (Overall) | 43 (71.7%) | 17 (28.3%) |
Natural Resources, Construction and Maintenance Occupations
Natural Resources, Construction and Maintenance Occupations by Sex
| Occupation | Male | Female |
| Farming, Fishing & Forestry | 0 (0.0%) | 0 (0.0%) |
| Construction & Extraction | 0 (0.0%) | 0 (0.0%) |
| Installation, Maintenance & Repair | 0 (0.0%) | 0 (0.0%) |
| Total (Category) | 0 (0.0%) | 0 (0.0%) |
| Total (Overall) | 43 (71.7%) | 17 (28.3%) |
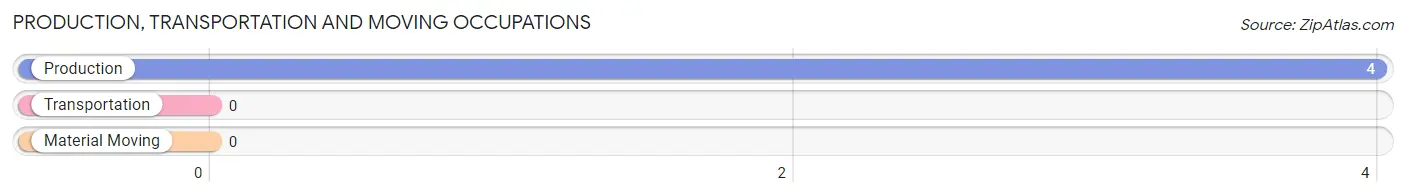
Production, Transportation and Moving Occupations
The most common Production, Transportation and Moving occupations in Phillipsburg are , and Production (4 | 6.7%).
Production, Transportation and Moving Occupations by Sex
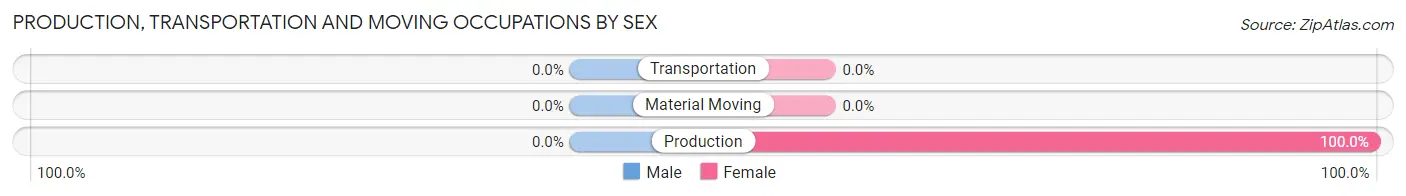
| Occupation | Male | Female |
| Production | 0 (0.0%) | 4 (100.0%) |
| Transportation | 0 (0.0%) | 0 (0.0%) |
| Material Moving | 0 (0.0%) | 0 (0.0%) |
| Total (Category) | 0 (0.0%) | 4 (100.0%) |
| Total (Overall) | 43 (71.7%) | 17 (28.3%) |
Employment Industries by Sex in Phillipsburg
Employment Industries in Phillipsburg
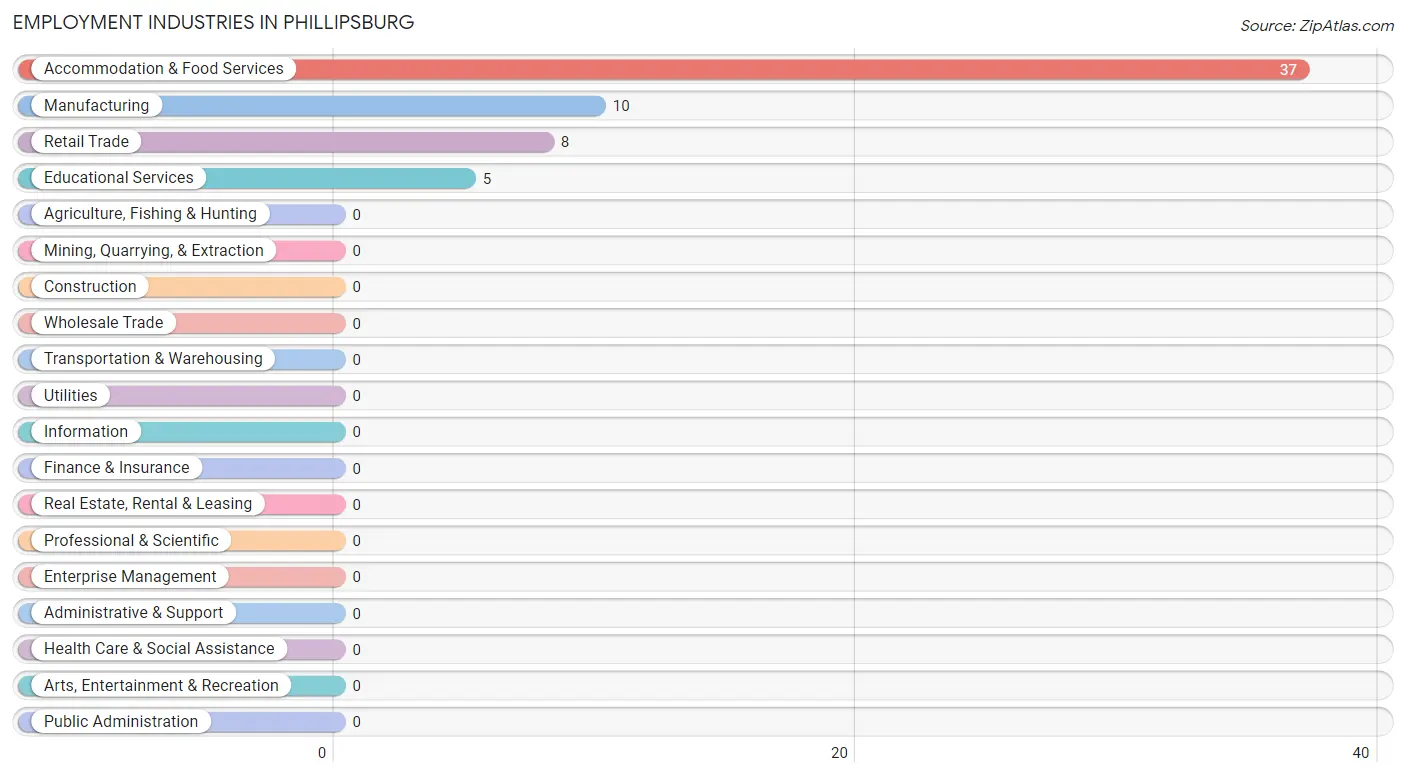
The major employment industries in Phillipsburg include Accommodation & Food Services (37 | 61.7%), Manufacturing (10 | 16.7%), Retail Trade (8 | 13.3%), and Educational Services (5 | 8.3%).
Employment Industries by Sex in Phillipsburg
The Phillipsburg industries that see more men than women are Accommodation & Food Services (100.0%), and Manufacturing (60.0%), whereas the industries that tend to have a higher number of women are Retail Trade (100.0%), Educational Services (100.0%), and Manufacturing (40.0%).
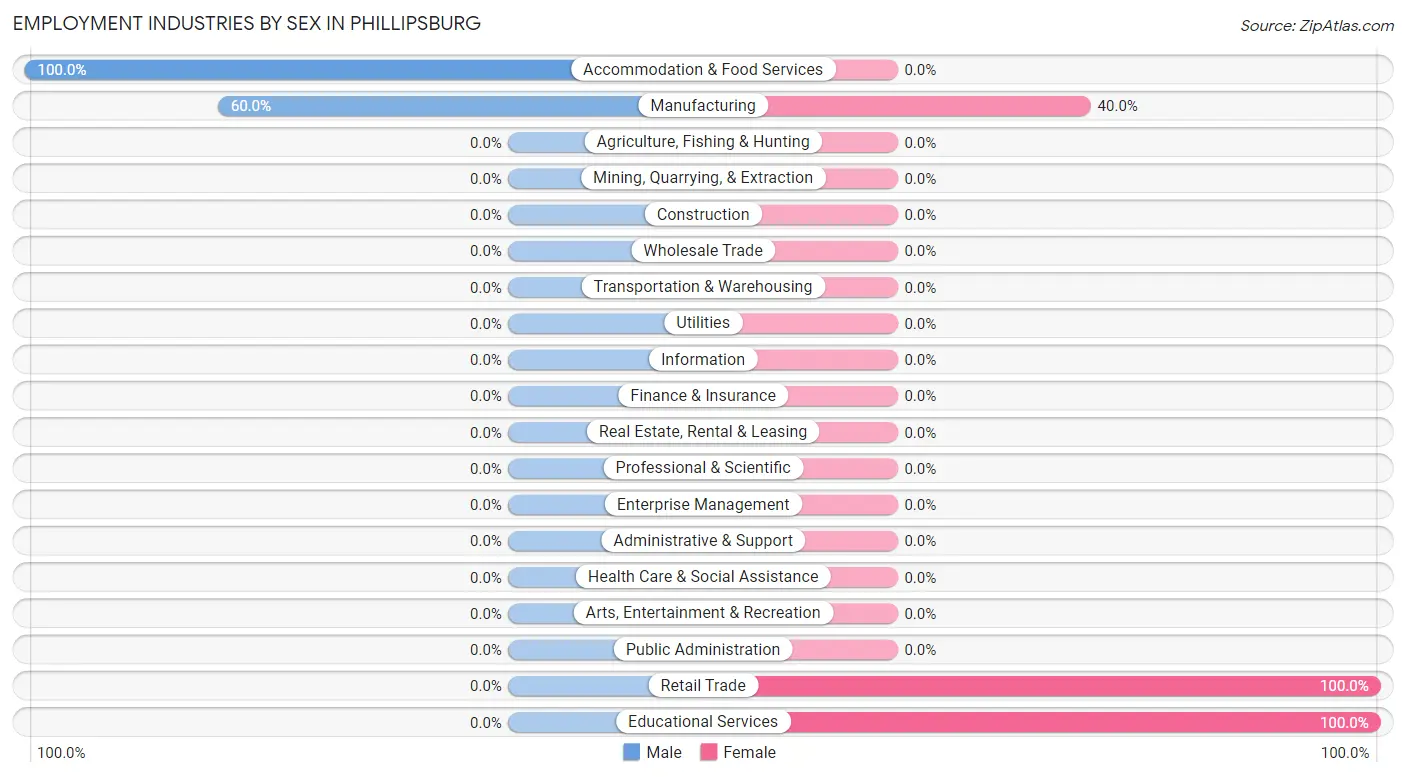
| Industry | Male | Female |
| Agriculture, Fishing & Hunting | 0 (0.0%) | 0 (0.0%) |
| Mining, Quarrying, & Extraction | 0 (0.0%) | 0 (0.0%) |
| Construction | 0 (0.0%) | 0 (0.0%) |
| Manufacturing | 6 (60.0%) | 4 (40.0%) |
| Wholesale Trade | 0 (0.0%) | 0 (0.0%) |
| Retail Trade | 0 (0.0%) | 8 (100.0%) |
| Transportation & Warehousing | 0 (0.0%) | 0 (0.0%) |
| Utilities | 0 (0.0%) | 0 (0.0%) |
| Information | 0 (0.0%) | 0 (0.0%) |
| Finance & Insurance | 0 (0.0%) | 0 (0.0%) |
| Real Estate, Rental & Leasing | 0 (0.0%) | 0 (0.0%) |
| Professional & Scientific | 0 (0.0%) | 0 (0.0%) |
| Enterprise Management | 0 (0.0%) | 0 (0.0%) |
| Administrative & Support | 0 (0.0%) | 0 (0.0%) |
| Educational Services | 0 (0.0%) | 5 (100.0%) |
| Health Care & Social Assistance | 0 (0.0%) | 0 (0.0%) |
| Arts, Entertainment & Recreation | 0 (0.0%) | 0 (0.0%) |
| Accommodation & Food Services | 37 (100.0%) | 0 (0.0%) |
| Public Administration | 0 (0.0%) | 0 (0.0%) |
| Total | 43 (71.7%) | 17 (28.3%) |
Education in Phillipsburg
School Enrollment in Phillipsburg
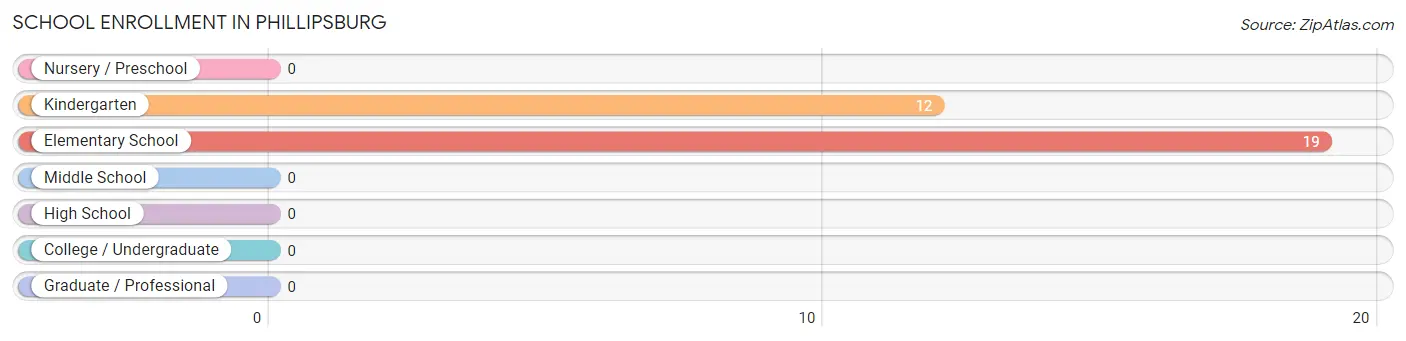
The most common levels of schooling among the 31 students in Phillipsburg are elementary school (19 | 61.3%), and kindergarten (12 | 38.7%).
| School Level | # Students | % Students |
| Nursery / Preschool | 0 | 0.0% |
| Kindergarten | 12 | 38.7% |
| Elementary School | 19 | 61.3% |
| Middle School | 0 | 0.0% |
| High School | 0 | 0.0% |
| College / Undergraduate | 0 | 0.0% |
| Graduate / Professional | 0 | 0.0% |
| Total | 31 | 100.0% |
School Enrollment by Age by Funding Source in Phillipsburg
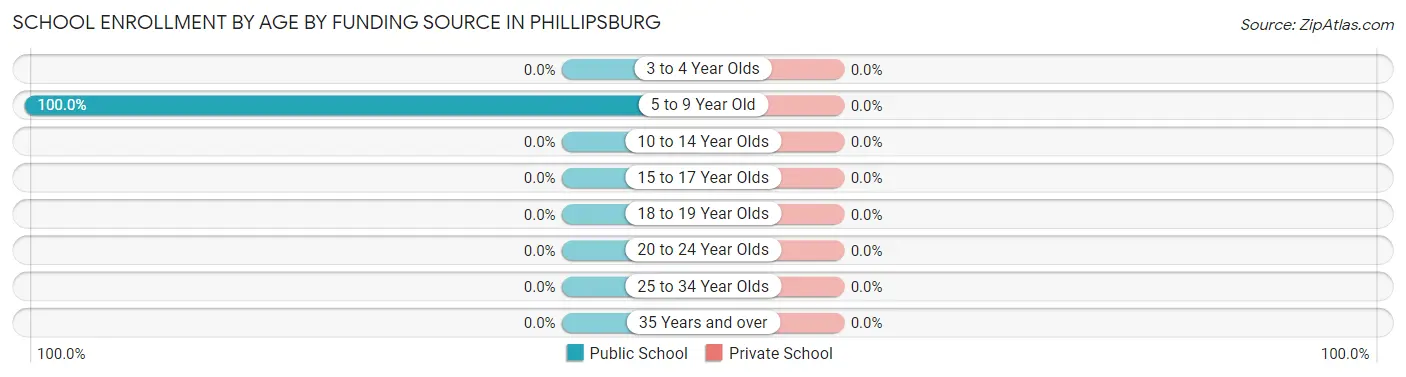
| Age Bracket | Public School | Private School |
| 3 to 4 Year Olds | 0 (0.0%) | 0 (0.0%) |
| 5 to 9 Year Old | 31 (100.0%) | 0 (0.0%) |
| 10 to 14 Year Olds | 0 (0.0%) | 0 (0.0%) |
| 15 to 17 Year Olds | 0 (0.0%) | 0 (0.0%) |
| 18 to 19 Year Olds | 0 (0.0%) | 0 (0.0%) |
| 20 to 24 Year Olds | 0 (0.0%) | 0 (0.0%) |
| 25 to 34 Year Olds | 0 (0.0%) | 0 (0.0%) |
| 35 Years and over | 0 (0.0%) | 0 (0.0%) |
| Total | 31 (100.0%) | 0 (0.0%) |
Educational Attainment by Field of Study in Phillipsburg
| Field of Study | # Graduates | % Graduates |
| Computers & Mathematics | 0 | 0.0% |
| Bio, Nature & Agricultural | 0 | 0.0% |
| Physical & Health Sciences | 0 | 0.0% |
| Psychology | 0 | 0.0% |
| Social Sciences | 0 | 0.0% |
| Engineering | 0 | 0.0% |
| Multidisciplinary Studies | 0 | 0.0% |
| Science & Technology | 0 | 0.0% |
| Business | 0 | 0.0% |
| Education | 0 | 0.0% |
| Literature & Languages | 0 | 0.0% |
| Liberal Arts & History | 0 | 0.0% |
| Visual & Performing Arts | 0 | 0.0% |
| Communications | 0 | 0.0% |
| Arts & Humanities | 0 | 0.0% |
| Total | 0 | 0.0% |
Transportation & Commute in Phillipsburg
Vehicle Availability by Sex in Phillipsburg
The most prevalent vehicle ownership categories in Phillipsburg are males with 1 vehicle (43, accounting for 100.0%) and females with 1 vehicle (5, making up 477.8%).
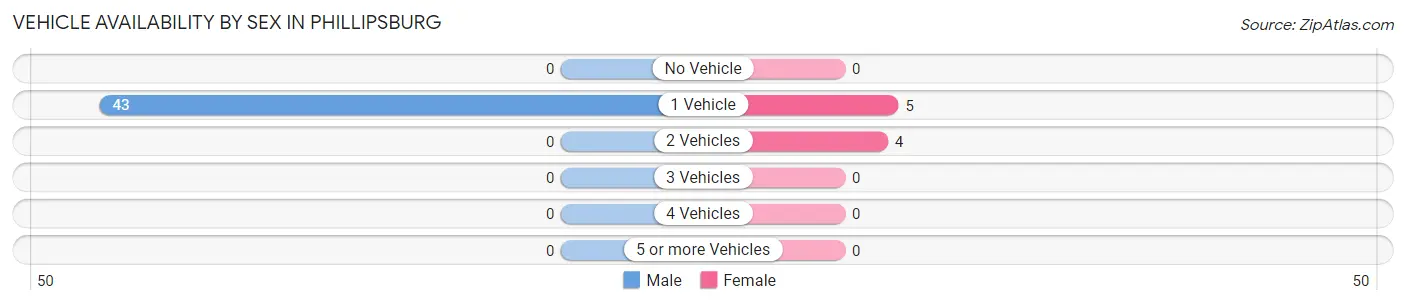
| Vehicles Available | Male | Female |
| No Vehicle | 0 (0.0%) | 0 (0.0%) |
| 1 Vehicle | 43 (100.0%) | 5 (55.6%) |
| 2 Vehicles | 0 (0.0%) | 4 (44.4%) |
| 3 Vehicles | 0 (0.0%) | 0 (0.0%) |
| 4 Vehicles | 0 (0.0%) | 0 (0.0%) |
| 5 or more Vehicles | 0 (0.0%) | 0 (0.0%) |
| Total | 43 (100.0%) | 9 (100.0%) |
Commute Time in Phillipsburg
The most frequently occuring commute durations in Phillipsburg are 45 to 59 minutes (37 commuters, 71.2%), 15 to 19 minutes (11 commuters, 21.1%), and 20 to 24 minutes (4 commuters, 7.7%).
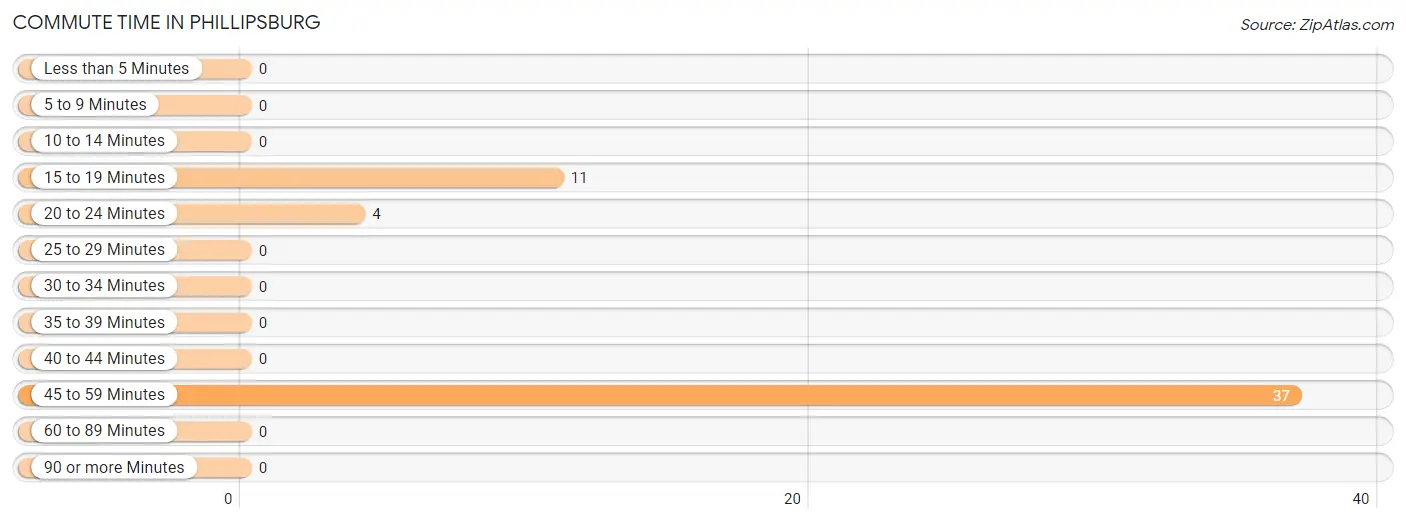
| Commute Time | # Commuters | % Commuters |
| Less than 5 Minutes | 0 | 0.0% |
| 5 to 9 Minutes | 0 | 0.0% |
| 10 to 14 Minutes | 0 | 0.0% |
| 15 to 19 Minutes | 11 | 21.1% |
| 20 to 24 Minutes | 4 | 7.7% |
| 25 to 29 Minutes | 0 | 0.0% |
| 30 to 34 Minutes | 0 | 0.0% |
| 35 to 39 Minutes | 0 | 0.0% |
| 40 to 44 Minutes | 0 | 0.0% |
| 45 to 59 Minutes | 37 | 71.2% |
| 60 to 89 Minutes | 0 | 0.0% |
| 90 or more Minutes | 0 | 0.0% |
Commute Time by Sex in Phillipsburg
The most common commute times in Phillipsburg are 45 to 59 minutes (37 commuters, 86.1%) for males and 15 to 19 minutes (5 commuters, 55.6%) for females.
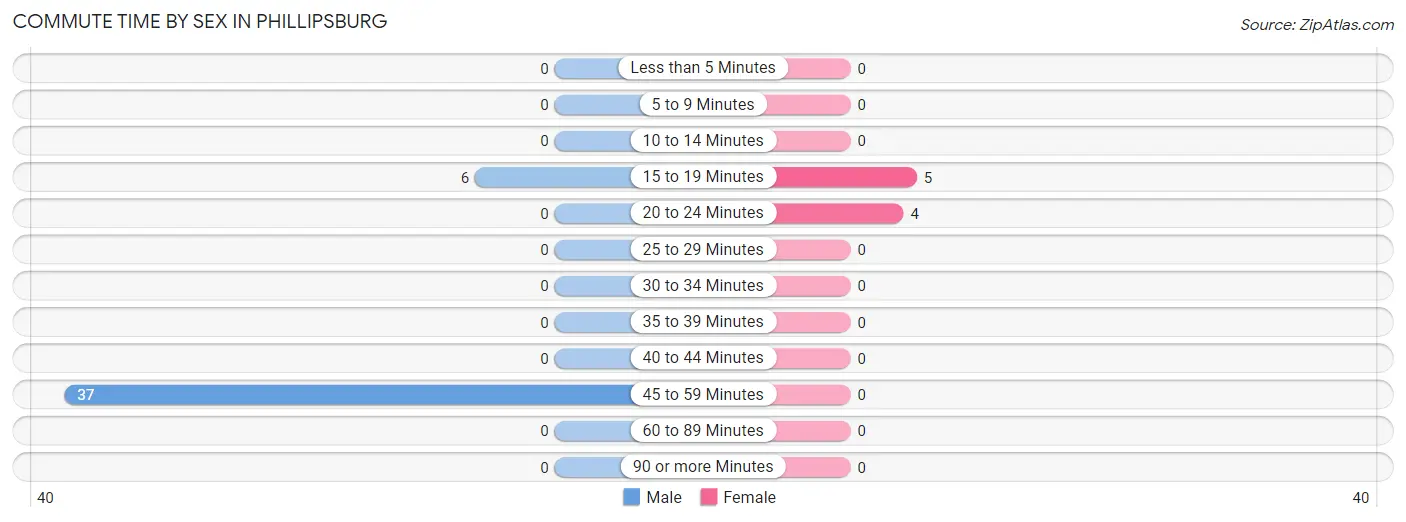
| Commute Time | Male | Female |
| Less than 5 Minutes | 0 (0.0%) | 0 (0.0%) |
| 5 to 9 Minutes | 0 (0.0%) | 0 (0.0%) |
| 10 to 14 Minutes | 0 (0.0%) | 0 (0.0%) |
| 15 to 19 Minutes | 6 (14.0%) | 5 (55.6%) |
| 20 to 24 Minutes | 0 (0.0%) | 4 (44.4%) |
| 25 to 29 Minutes | 0 (0.0%) | 0 (0.0%) |
| 30 to 34 Minutes | 0 (0.0%) | 0 (0.0%) |
| 35 to 39 Minutes | 0 (0.0%) | 0 (0.0%) |
| 40 to 44 Minutes | 0 (0.0%) | 0 (0.0%) |
| 45 to 59 Minutes | 37 (86.1%) | 0 (0.0%) |
| 60 to 89 Minutes | 0 (0.0%) | 0 (0.0%) |
| 90 or more Minutes | 0 (0.0%) | 0 (0.0%) |
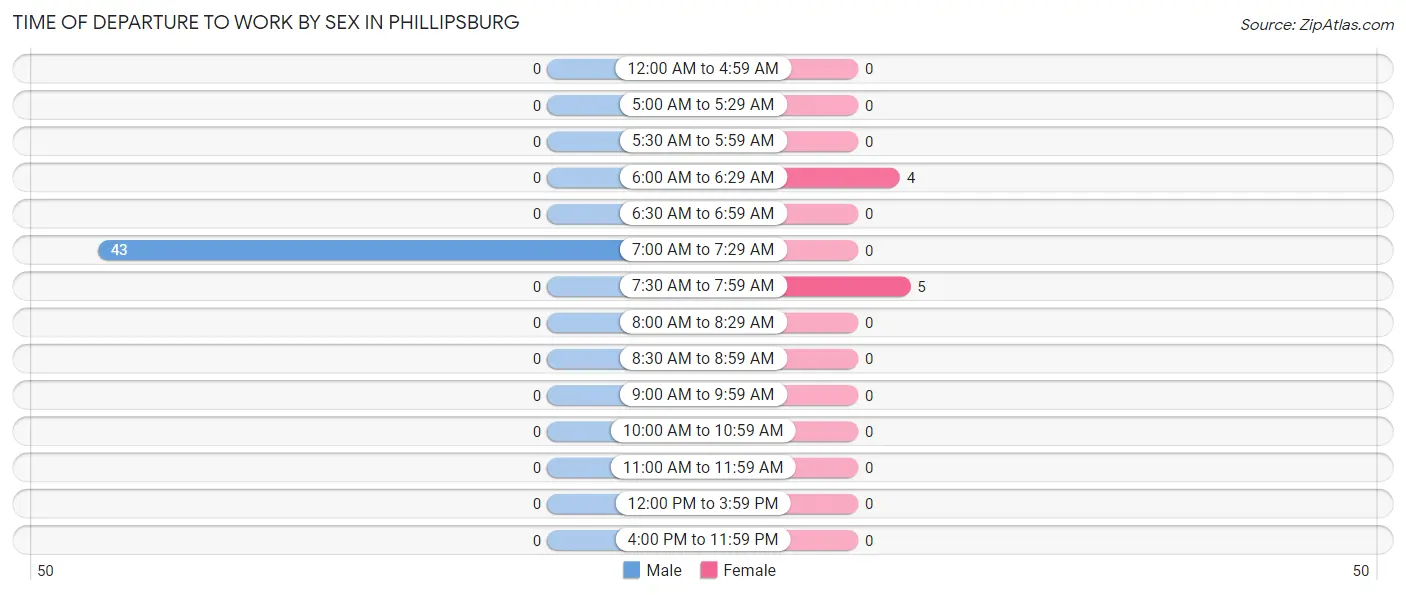
Time of Departure to Work by Sex in Phillipsburg
The most frequent times of departure to work in Phillipsburg are 7:00 AM to 7:29 AM (43, 100.0%) for males and 7:30 AM to 7:59 AM (5, 55.6%) for females.
| Time of Departure | Male | Female |
| 12:00 AM to 4:59 AM | 0 (0.0%) | 0 (0.0%) |
| 5:00 AM to 5:29 AM | 0 (0.0%) | 0 (0.0%) |
| 5:30 AM to 5:59 AM | 0 (0.0%) | 0 (0.0%) |
| 6:00 AM to 6:29 AM | 0 (0.0%) | 4 (44.4%) |
| 6:30 AM to 6:59 AM | 0 (0.0%) | 0 (0.0%) |
| 7:00 AM to 7:29 AM | 43 (100.0%) | 0 (0.0%) |
| 7:30 AM to 7:59 AM | 0 (0.0%) | 5 (55.6%) |
| 8:00 AM to 8:29 AM | 0 (0.0%) | 0 (0.0%) |
| 8:30 AM to 8:59 AM | 0 (0.0%) | 0 (0.0%) |
| 9:00 AM to 9:59 AM | 0 (0.0%) | 0 (0.0%) |
| 10:00 AM to 10:59 AM | 0 (0.0%) | 0 (0.0%) |
| 11:00 AM to 11:59 AM | 0 (0.0%) | 0 (0.0%) |
| 12:00 PM to 3:59 PM | 0 (0.0%) | 0 (0.0%) |
| 4:00 PM to 11:59 PM | 0 (0.0%) | 0 (0.0%) |
| Total | 43 (100.0%) | 9 (100.0%) |
Housing Occupancy in Phillipsburg
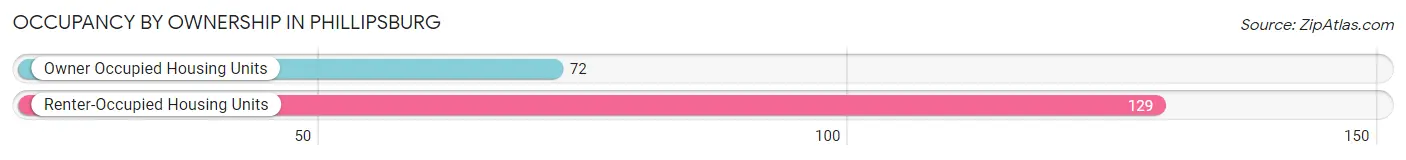
Occupancy by Ownership in Phillipsburg
Of the total 201 dwellings in Phillipsburg, owner-occupied units account for 72 (35.8%), while renter-occupied units make up 129 (64.2%).
| Occupancy | # Housing Units | % Housing Units |
| Owner Occupied Housing Units | 72 | 35.8% |
| Renter-Occupied Housing Units | 129 | 64.2% |
| Total Occupied Housing Units | 201 | 100.0% |
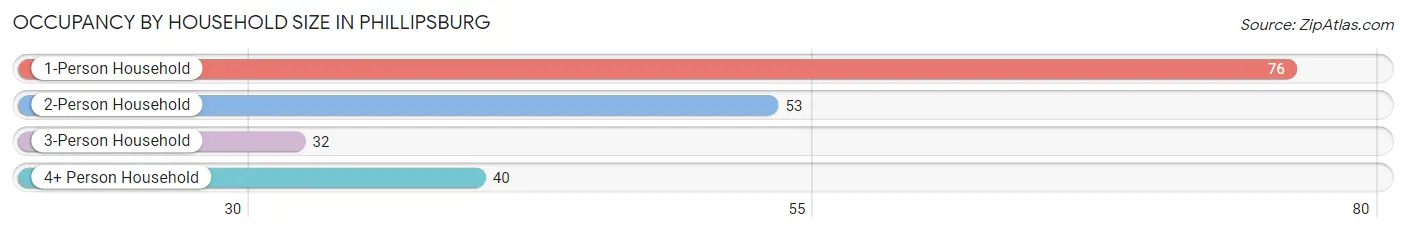
Occupancy by Household Size in Phillipsburg
| Household Size | # Housing Units | % Housing Units |
| 1-Person Household | 76 | 37.8% |
| 2-Person Household | 53 | 26.4% |
| 3-Person Household | 32 | 15.9% |
| 4+ Person Household | 40 | 19.9% |
| Total Housing Units | 201 | 100.0% |
Occupancy by Ownership by Household Size in Phillipsburg
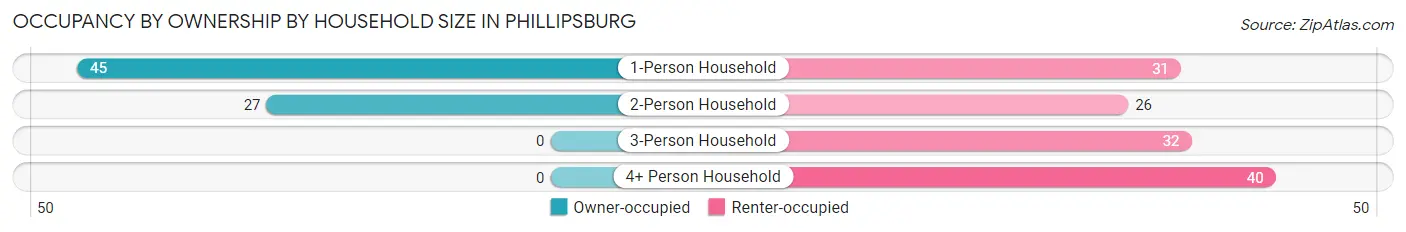
| Household Size | Owner-occupied | Renter-occupied |
| 1-Person Household | 45 (59.2%) | 31 (40.8%) |
| 2-Person Household | 27 (50.9%) | 26 (49.1%) |
| 3-Person Household | 0 (0.0%) | 32 (100.0%) |
| 4+ Person Household | 0 (0.0%) | 40 (100.0%) |
| Total Housing Units | 72 (35.8%) | 129 (64.2%) |
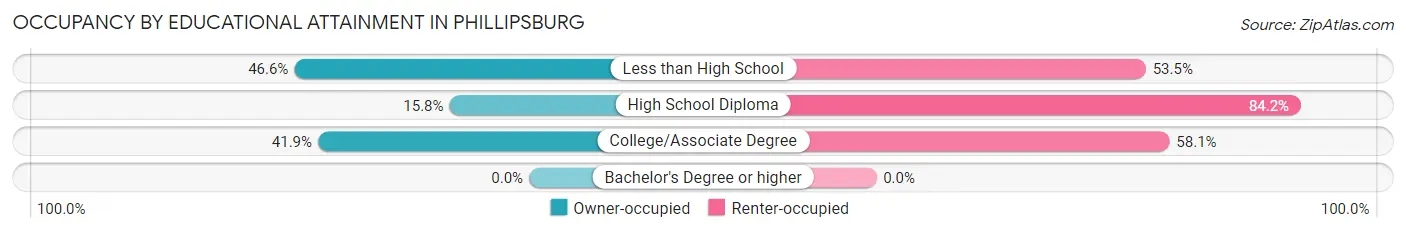
Occupancy by Educational Attainment in Phillipsburg
| Household Size | Owner-occupied | Renter-occupied |
| Less than High School | 27 (46.6%) | 31 (53.4%) |
| High School Diploma | 9 (15.8%) | 48 (84.2%) |
| College/Associate Degree | 36 (41.9%) | 50 (58.1%) |
| Bachelor's Degree or higher | 0 (0.0%) | 0 (0.0%) |
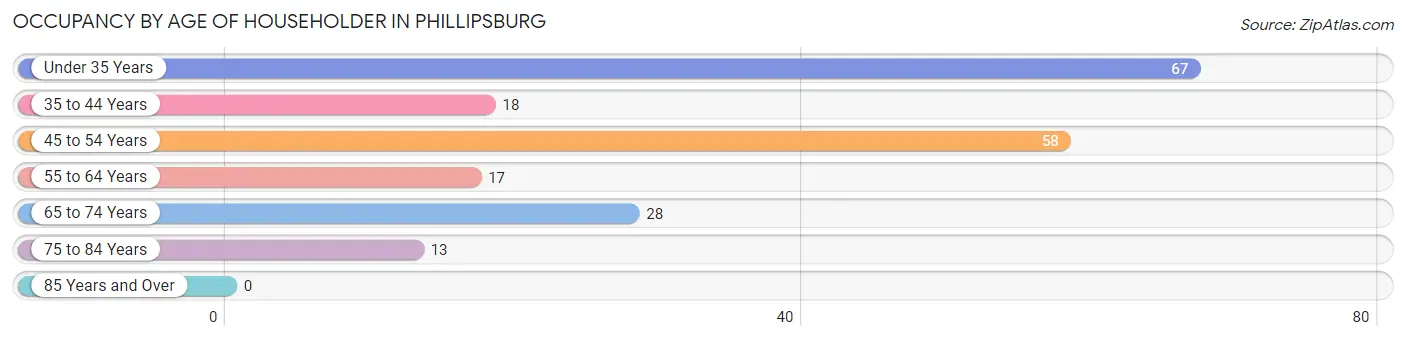
Occupancy by Age of Householder in Phillipsburg
| Age Bracket | # Households | % Households |
| Under 35 Years | 67 | 33.3% |
| 35 to 44 Years | 18 | 9.0% |
| 45 to 54 Years | 58 | 28.9% |
| 55 to 64 Years | 17 | 8.5% |
| 65 to 74 Years | 28 | 13.9% |
| 75 to 84 Years | 13 | 6.5% |
| 85 Years and Over | 0 | 0.0% |
| Total | 201 | 100.0% |
Housing Finances in Phillipsburg
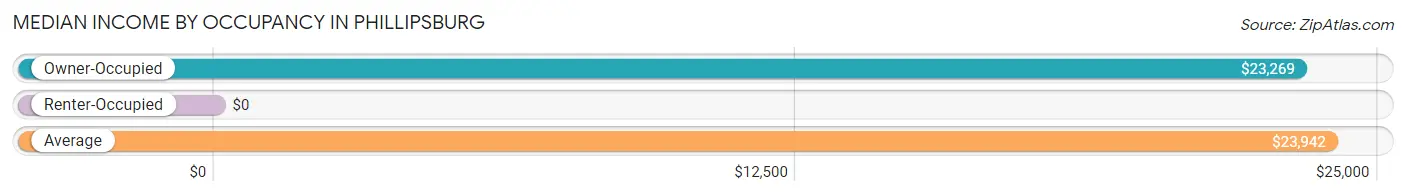
Median Income by Occupancy in Phillipsburg
| Occupancy Type | # Households | Median Income |
| Owner-Occupied | 72 (35.8%) | $23,269 |
| Renter-Occupied | 129 (64.2%) | $0 |
| Average | 201 (100.0%) | $23,942 |
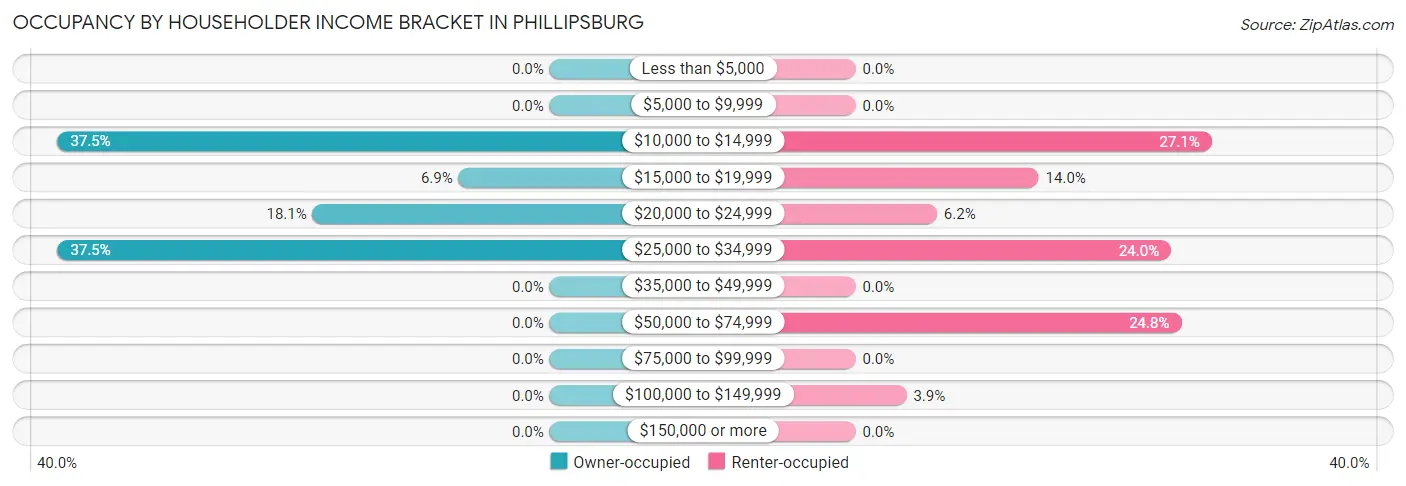
Occupancy by Householder Income Bracket in Phillipsburg
| Income Bracket | Owner-occupied | Renter-occupied |
| Less than $5,000 | 0 (0.0%) | 0 (0.0%) |
| $5,000 to $9,999 | 0 (0.0%) | 0 (0.0%) |
| $10,000 to $14,999 | 27 (37.5%) | 35 (27.1%) |
| $15,000 to $19,999 | 5 (6.9%) | 18 (14.0%) |
| $20,000 to $24,999 | 13 (18.1%) | 8 (6.2%) |
| $25,000 to $34,999 | 27 (37.5%) | 31 (24.0%) |
| $35,000 to $49,999 | 0 (0.0%) | 0 (0.0%) |
| $50,000 to $74,999 | 0 (0.0%) | 32 (24.8%) |
| $75,000 to $99,999 | 0 (0.0%) | 0 (0.0%) |
| $100,000 to $149,999 | 0 (0.0%) | 5 (3.9%) |
| $150,000 or more | 0 (0.0%) | 0 (0.0%) |
| Total | 72 (100.0%) | 129 (100.0%) |
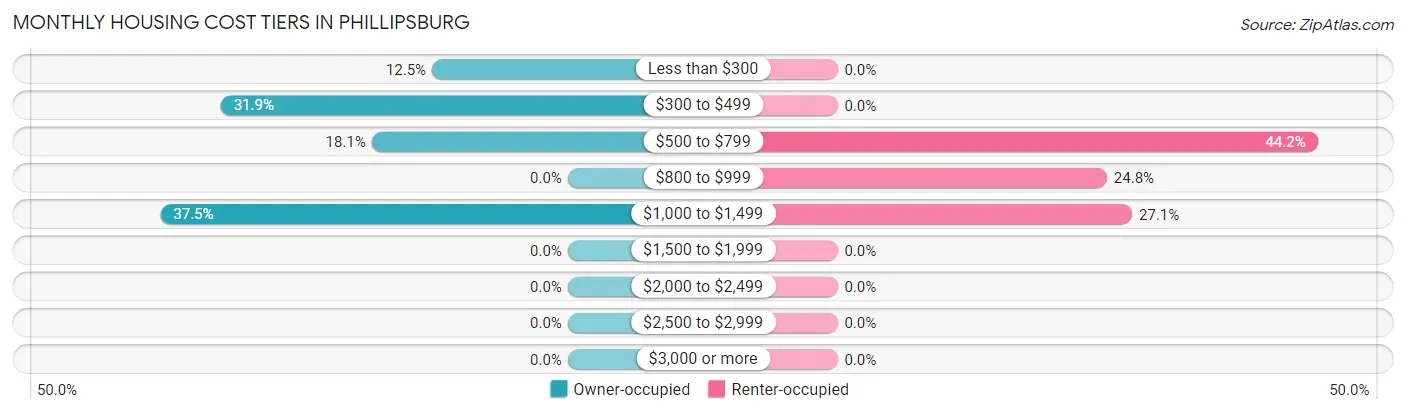
Monthly Housing Cost Tiers in Phillipsburg
| Monthly Cost | Owner-occupied | Renter-occupied |
| Less than $300 | 9 (12.5%) | 0 (0.0%) |
| $300 to $499 | 23 (31.9%) | 0 (0.0%) |
| $500 to $799 | 13 (18.1%) | 57 (44.2%) |
| $800 to $999 | 0 (0.0%) | 32 (24.8%) |
| $1,000 to $1,499 | 27 (37.5%) | 35 (27.1%) |
| $1,500 to $1,999 | 0 (0.0%) | 0 (0.0%) |
| $2,000 to $2,499 | 0 (0.0%) | 0 (0.0%) |
| $2,500 to $2,999 | 0 (0.0%) | 0 (0.0%) |
| $3,000 or more | 0 (0.0%) | 0 (0.0%) |
| Total | 72 (100.0%) | 129 (100.0%) |
Physical Housing Characteristics in Phillipsburg
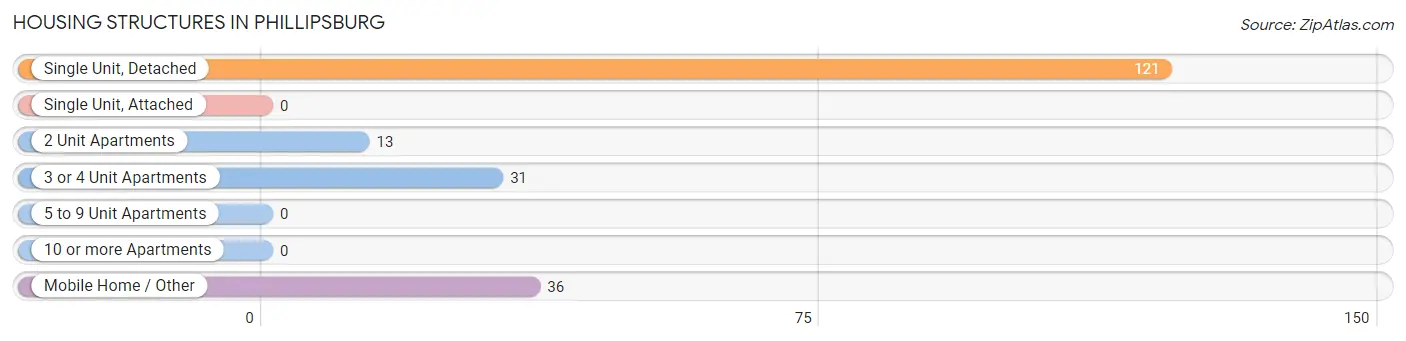
Housing Structures in Phillipsburg
| Structure Type | # Housing Units | % Housing Units |
| Single Unit, Detached | 121 | 60.2% |
| Single Unit, Attached | 0 | 0.0% |
| 2 Unit Apartments | 13 | 6.5% |
| 3 or 4 Unit Apartments | 31 | 15.4% |
| 5 to 9 Unit Apartments | 0 | 0.0% |
| 10 or more Apartments | 0 | 0.0% |
| Mobile Home / Other | 36 | 17.9% |
| Total | 201 | 100.0% |
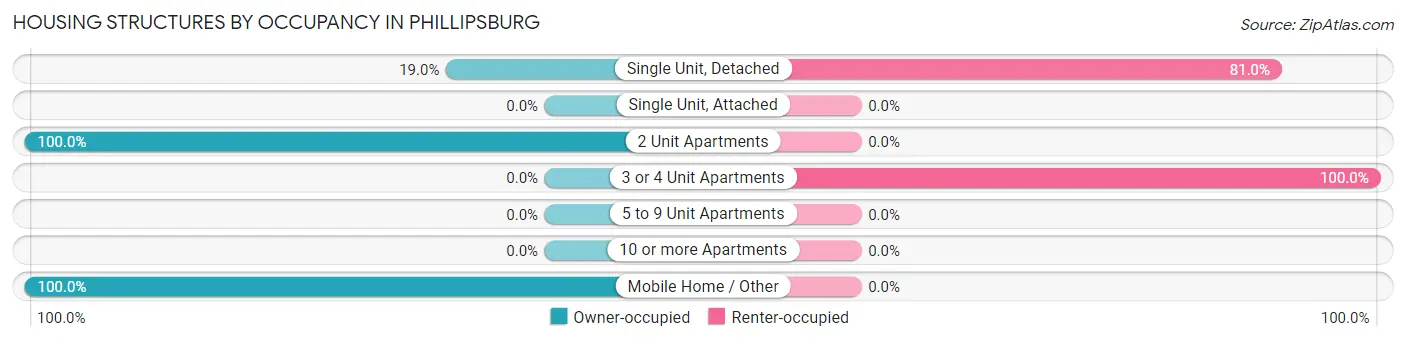
Housing Structures by Occupancy in Phillipsburg
| Structure Type | Owner-occupied | Renter-occupied |
| Single Unit, Detached | 23 (19.0%) | 98 (81.0%) |
| Single Unit, Attached | 0 (0.0%) | 0 (0.0%) |
| 2 Unit Apartments | 13 (100.0%) | 0 (0.0%) |
| 3 or 4 Unit Apartments | 0 (0.0%) | 31 (100.0%) |
| 5 to 9 Unit Apartments | 0 (0.0%) | 0 (0.0%) |
| 10 or more Apartments | 0 (0.0%) | 0 (0.0%) |
| Mobile Home / Other | 36 (100.0%) | 0 (0.0%) |
| Total | 72 (35.8%) | 129 (64.2%) |
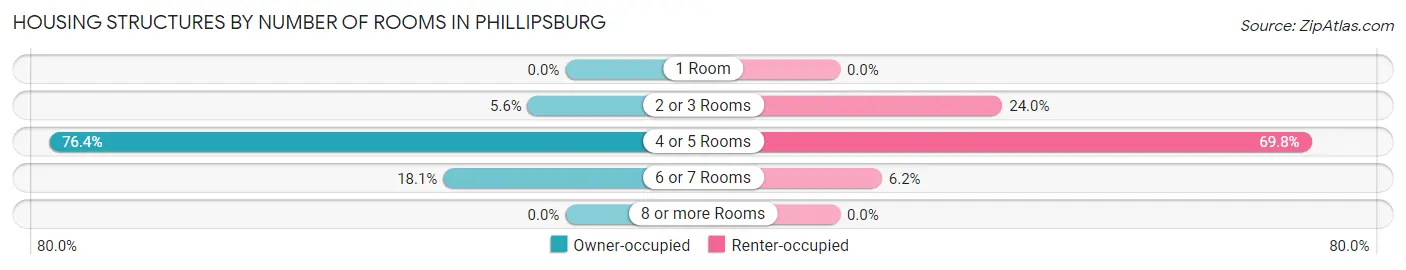
Housing Structures by Number of Rooms in Phillipsburg
| Number of Rooms | Owner-occupied | Renter-occupied |
| 1 Room | 0 (0.0%) | 0 (0.0%) |
| 2 or 3 Rooms | 4 (5.6%) | 31 (24.0%) |
| 4 or 5 Rooms | 55 (76.4%) | 90 (69.8%) |
| 6 or 7 Rooms | 13 (18.1%) | 8 (6.2%) |
| 8 or more Rooms | 0 (0.0%) | 0 (0.0%) |
| Total | 72 (100.0%) | 129 (100.0%) |
Housing Structure by Heating Type in Phillipsburg
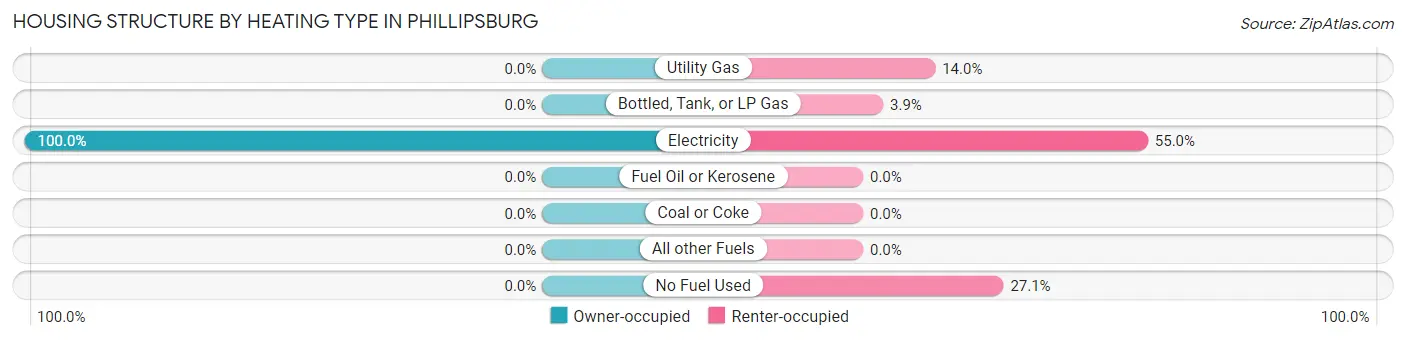
| Heating Type | Owner-occupied | Renter-occupied |
| Utility Gas | 0 (0.0%) | 18 (14.0%) |
| Bottled, Tank, or LP Gas | 0 (0.0%) | 5 (3.9%) |
| Electricity | 72 (100.0%) | 71 (55.0%) |
| Fuel Oil or Kerosene | 0 (0.0%) | 0 (0.0%) |
| Coal or Coke | 0 (0.0%) | 0 (0.0%) |
| All other Fuels | 0 (0.0%) | 0 (0.0%) |
| No Fuel Used | 0 (0.0%) | 35 (27.1%) |
| Total | 72 (100.0%) | 129 (100.0%) |
Household Vehicle Usage in Phillipsburg
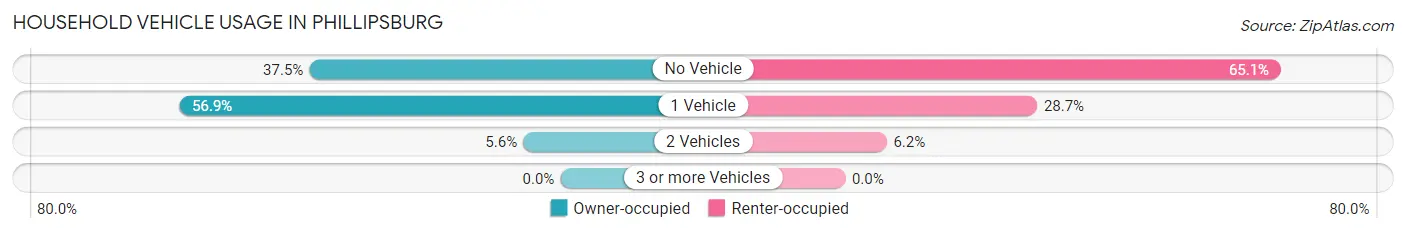
| Vehicles per Household | Owner-occupied | Renter-occupied |
| No Vehicle | 27 (37.5%) | 84 (65.1%) |
| 1 Vehicle | 41 (56.9%) | 37 (28.7%) |
| 2 Vehicles | 4 (5.6%) | 8 (6.2%) |
| 3 or more Vehicles | 0 (0.0%) | 0 (0.0%) |
| Total | 72 (100.0%) | 129 (100.0%) |
Real Estate & Mortgages in Phillipsburg
Real Estate and Mortgage Overview in Phillipsburg
| Characteristic | Without Mortgage | With Mortgage |
| Housing Units | 59 | 13 |
| Median Property Value | $9,999 | $0 |
| Median Household Income | - | - |
| Monthly Housing Costs | - | - |
| Real Estate Taxes | - | - |
Property Value by Mortgage Status in Phillipsburg
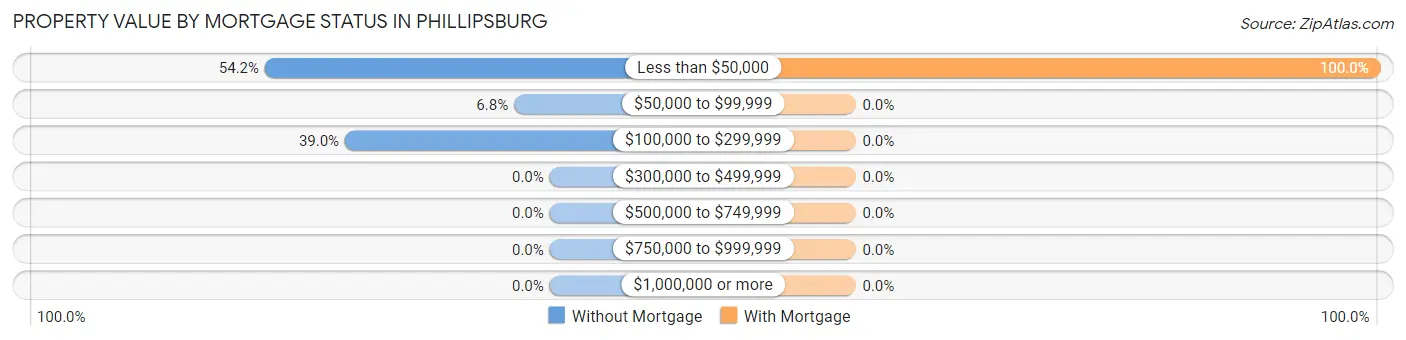
| Property Value | Without Mortgage | With Mortgage |
| Less than $50,000 | 32 (54.2%) | 13 (100.0%) |
| $50,000 to $99,999 | 4 (6.8%) | 0 (0.0%) |
| $100,000 to $299,999 | 23 (39.0%) | 0 (0.0%) |
| $300,000 to $499,999 | 0 (0.0%) | 0 (0.0%) |
| $500,000 to $749,999 | 0 (0.0%) | 0 (0.0%) |
| $750,000 to $999,999 | 0 (0.0%) | 0 (0.0%) |
| $1,000,000 or more | 0 (0.0%) | 0 (0.0%) |
| Total | 59 (100.0%) | 13 (100.0%) |
Household Income by Mortgage Status in Phillipsburg
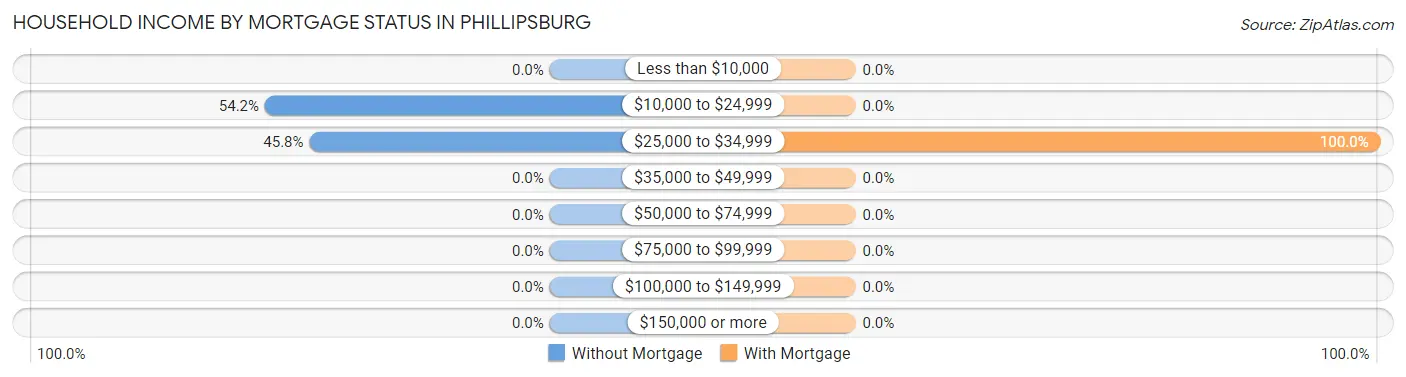
| Household Income | Without Mortgage | With Mortgage |
| Less than $10,000 | 0 (0.0%) | 0 (0.0%) |
| $10,000 to $24,999 | 32 (54.2%) | 0 (0.0%) |
| $25,000 to $34,999 | 27 (45.8%) | 13 (100.0%) |
| $35,000 to $49,999 | 0 (0.0%) | 0 (0.0%) |
| $50,000 to $74,999 | 0 (0.0%) | 0 (0.0%) |
| $75,000 to $99,999 | 0 (0.0%) | 0 (0.0%) |
| $100,000 to $149,999 | 0 (0.0%) | 0 (0.0%) |
| $150,000 or more | 0 (0.0%) | 0 (0.0%) |
| Total | 59 (100.0%) | 13 (100.0%) |
Property Value to Household Income Ratio in Phillipsburg
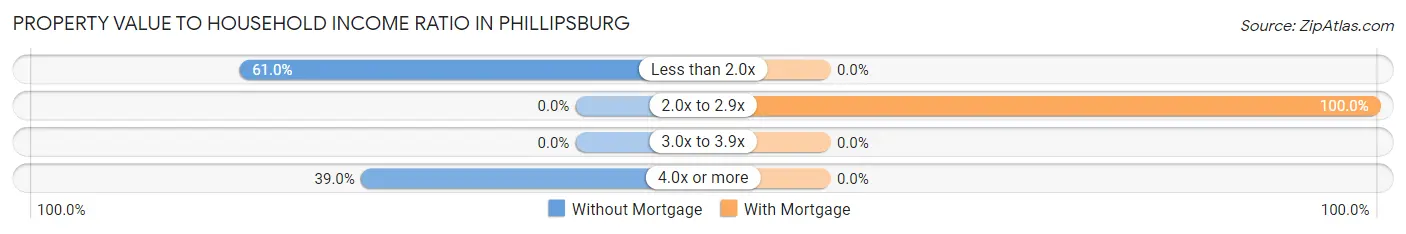
| Value-to-Income Ratio | Without Mortgage | With Mortgage |
| Less than 2.0x | 36 (61.0%) | 0 (0.0%) |
| 2.0x to 2.9x | 0 (0.0%) | 13 (100.0%) |
| 3.0x to 3.9x | 0 (0.0%) | 0 (0.0%) |
| 4.0x or more | 23 (39.0%) | 0 (0.0%) |
| Total | 59 (100.0%) | 13 (100.0%) |
Real Estate Taxes by Mortgage Status in Phillipsburg
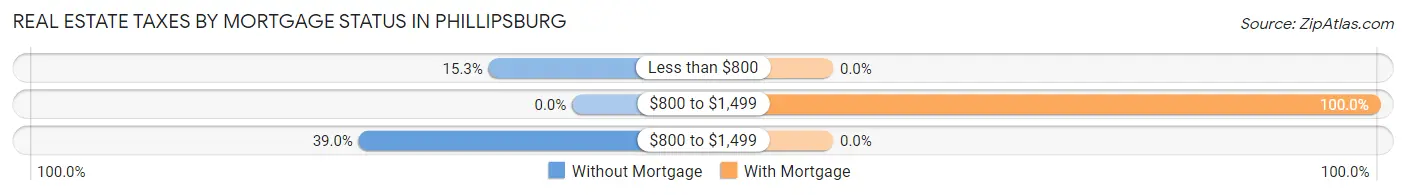
| Property Taxes | Without Mortgage | With Mortgage |
| Less than $800 | 9 (15.2%) | 0 (0.0%) |
| $800 to $1,499 | 0 (0.0%) | 13 (100.0%) |
| $800 to $1,499 | 23 (39.0%) | 0 (0.0%) |
| Total | 59 (100.0%) | 13 (100.0%) |
Health & Disability in Phillipsburg
Health Insurance Coverage by Age in Phillipsburg
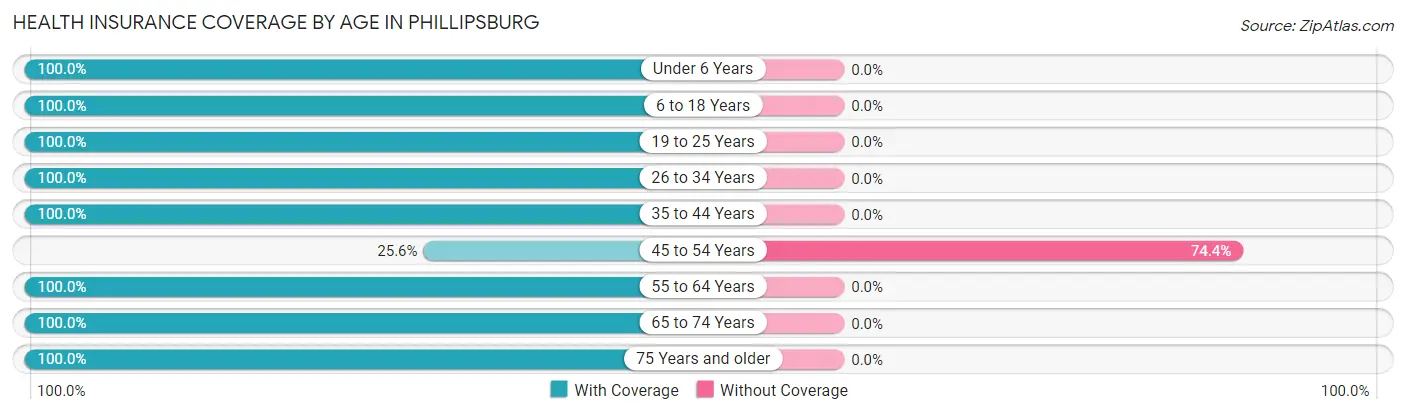
| Age Bracket | With Coverage | Without Coverage |
| Under 6 Years | 22 (100.0%) | 0 (0.0%) |
| 6 to 18 Years | 140 (100.0%) | 0 (0.0%) |
| 19 to 25 Years | 32 (100.0%) | 0 (0.0%) |
| 26 to 34 Years | 72 (100.0%) | 0 (0.0%) |
| 35 to 44 Years | 18 (100.0%) | 0 (0.0%) |
| 45 to 54 Years | 20 (25.6%) | 58 (74.4%) |
| 55 to 64 Years | 37 (100.0%) | 0 (0.0%) |
| 65 to 74 Years | 38 (100.0%) | 0 (0.0%) |
| 75 Years and older | 30 (100.0%) | 0 (0.0%) |
| Total | 409 (87.6%) | 58 (12.4%) |
Health Insurance Coverage by Citizenship Status in Phillipsburg
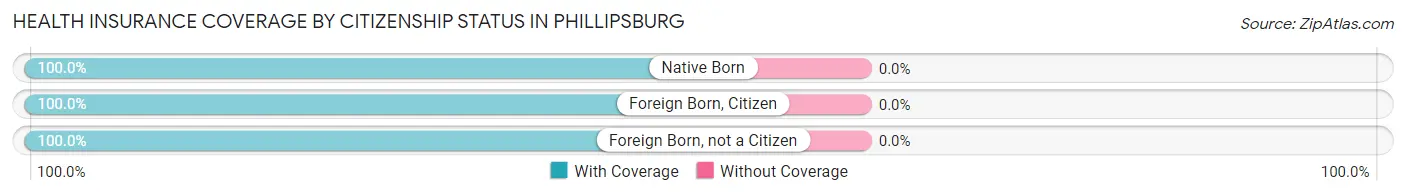
| Citizenship Status | With Coverage | Without Coverage |
| Native Born | 22 (100.0%) | 0 (0.0%) |
| Foreign Born, Citizen | 140 (100.0%) | 0 (0.0%) |
| Foreign Born, not a Citizen | 32 (100.0%) | 0 (0.0%) |
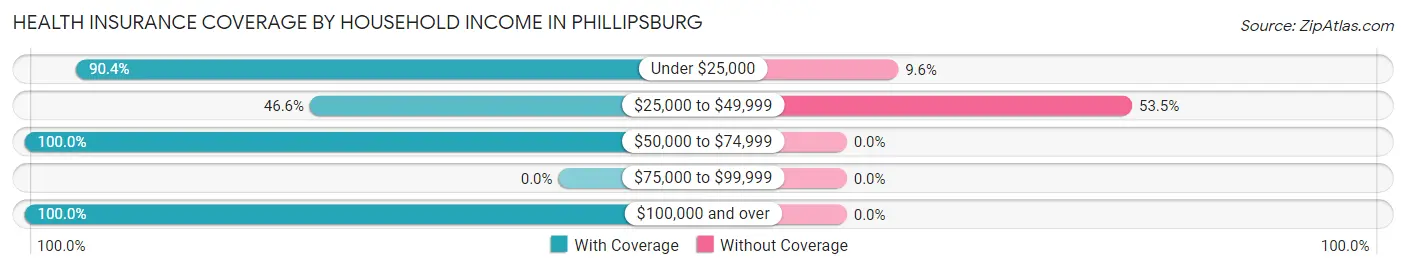
Health Insurance Coverage by Household Income in Phillipsburg
| Household Income | With Coverage | Without Coverage |
| Under $25,000 | 253 (90.4%) | 27 (9.6%) |
| $25,000 to $49,999 | 27 (46.6%) | 31 (53.4%) |
| $50,000 to $74,999 | 91 (100.0%) | 0 (0.0%) |
| $75,000 to $99,999 | 0 (0.0%) | 0 (0.0%) |
| $100,000 and over | 38 (100.0%) | 0 (0.0%) |
Public vs Private Health Insurance Coverage by Age in Phillipsburg
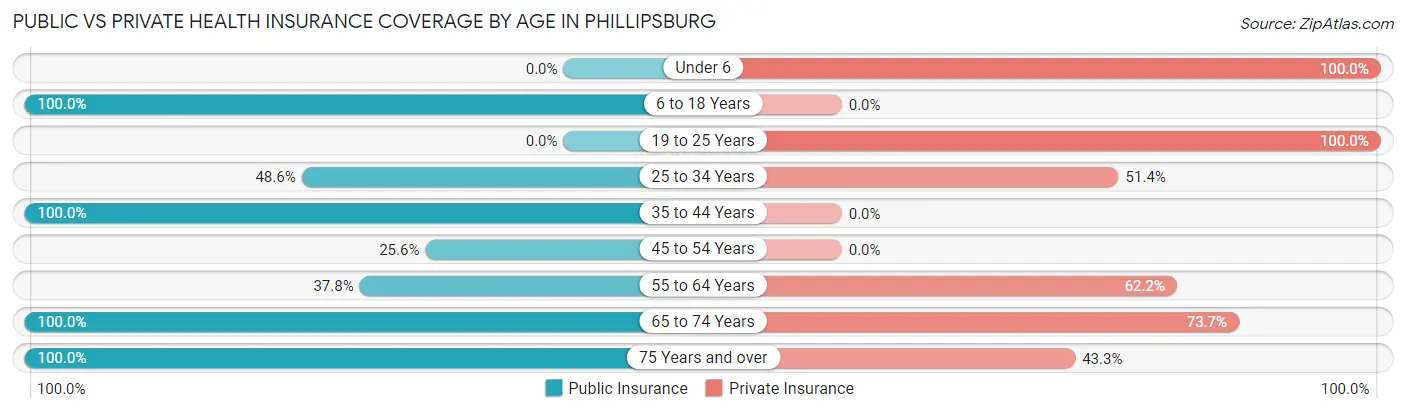
| Age Bracket | Public Insurance | Private Insurance |
| Under 6 | 0 (0.0%) | 22 (100.0%) |
| 6 to 18 Years | 140 (100.0%) | 0 (0.0%) |
| 19 to 25 Years | 0 (0.0%) | 32 (100.0%) |
| 25 to 34 Years | 35 (48.6%) | 37 (51.4%) |
| 35 to 44 Years | 18 (100.0%) | 0 (0.0%) |
| 45 to 54 Years | 20 (25.6%) | 0 (0.0%) |
| 55 to 64 Years | 14 (37.8%) | 23 (62.2%) |
| 65 to 74 Years | 38 (100.0%) | 28 (73.7%) |
| 75 Years and over | 30 (100.0%) | 13 (43.3%) |
| Total | 295 (63.2%) | 155 (33.2%) |
Disability Status by Sex by Age in Phillipsburg
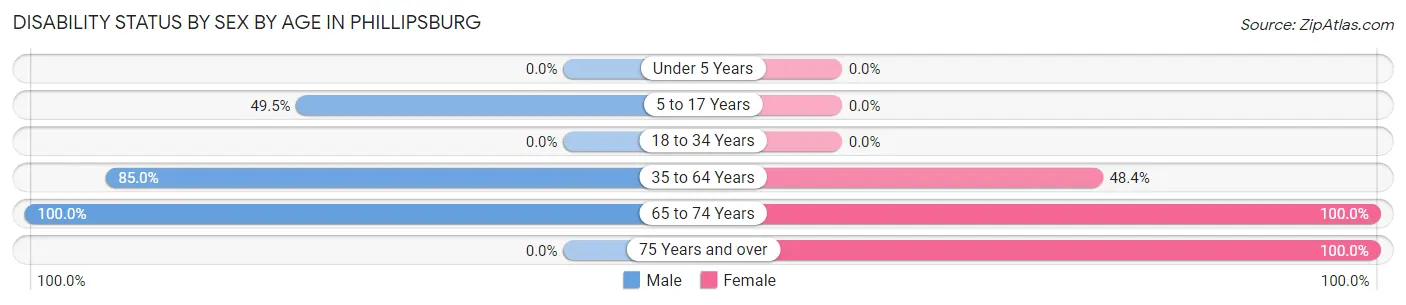
| Age Bracket | Male | Female |
| Under 5 Years | 0 (0.0%) | 0 (0.0%) |
| 5 to 17 Years | 54 (49.5%) | 0 (0.0%) |
| 18 to 34 Years | 0 (0.0%) | 0 (0.0%) |
| 35 to 64 Years | 34 (85.0%) | 45 (48.4%) |
| 65 to 74 Years | 15 (100.0%) | 23 (100.0%) |
| 75 Years and over | 0 (0.0%) | 17 (100.0%) |
Disability Class by Sex by Age in Phillipsburg
Disability Class: Hearing Difficulty
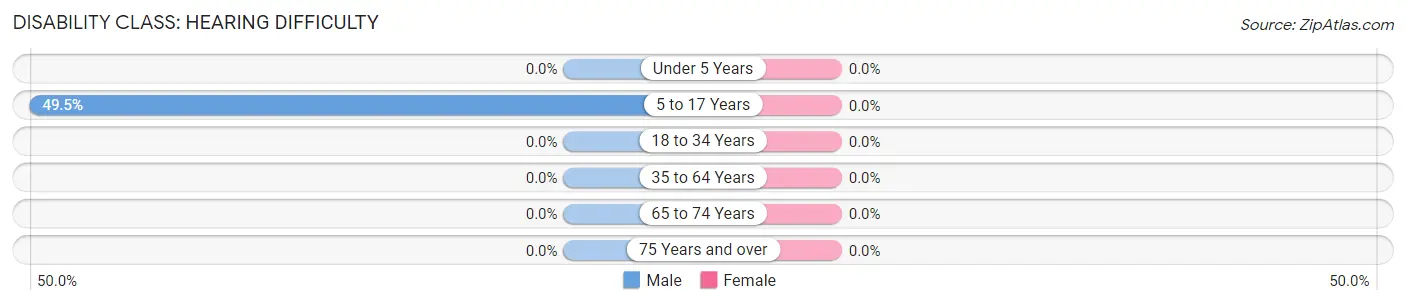
| Age Bracket | Male | Female |
| Under 5 Years | 0 (0.0%) | 0 (0.0%) |
| 5 to 17 Years | 54 (49.5%) | 0 (0.0%) |
| 18 to 34 Years | 0 (0.0%) | 0 (0.0%) |
| 35 to 64 Years | 0 (0.0%) | 0 (0.0%) |
| 65 to 74 Years | 0 (0.0%) | 0 (0.0%) |
| 75 Years and over | 0 (0.0%) | 0 (0.0%) |
Disability Class: Vision Difficulty
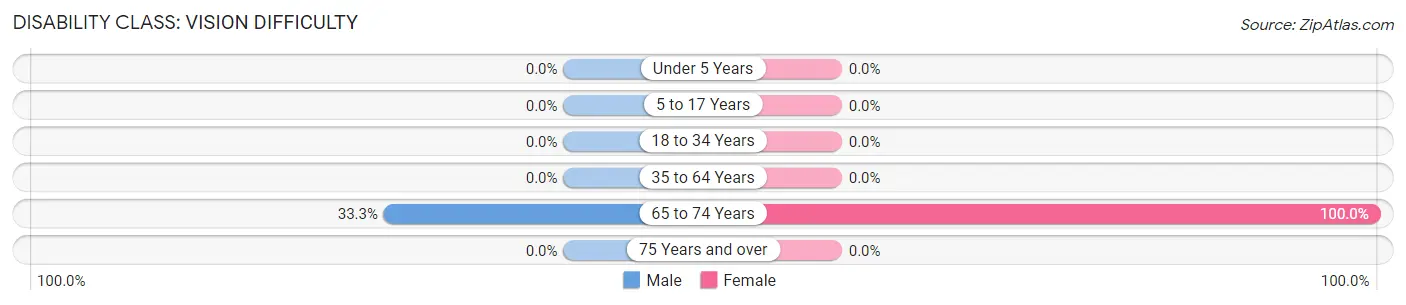
| Age Bracket | Male | Female |
| Under 5 Years | 0 (0.0%) | 0 (0.0%) |
| 5 to 17 Years | 0 (0.0%) | 0 (0.0%) |
| 18 to 34 Years | 0 (0.0%) | 0 (0.0%) |
| 35 to 64 Years | 0 (0.0%) | 0 (0.0%) |
| 65 to 74 Years | 5 (33.3%) | 23 (100.0%) |
| 75 Years and over | 0 (0.0%) | 0 (0.0%) |
Disability Class: Cognitive Difficulty
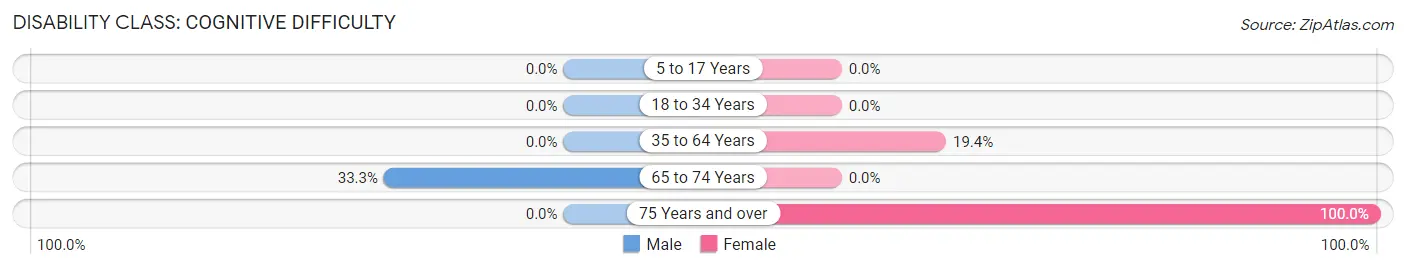
| Age Bracket | Male | Female |
| 5 to 17 Years | 0 (0.0%) | 0 (0.0%) |
| 18 to 34 Years | 0 (0.0%) | 0 (0.0%) |
| 35 to 64 Years | 0 (0.0%) | 18 (19.4%) |
| 65 to 74 Years | 5 (33.3%) | 0 (0.0%) |
| 75 Years and over | 0 (0.0%) | 17 (100.0%) |
Disability Class: Ambulatory Difficulty
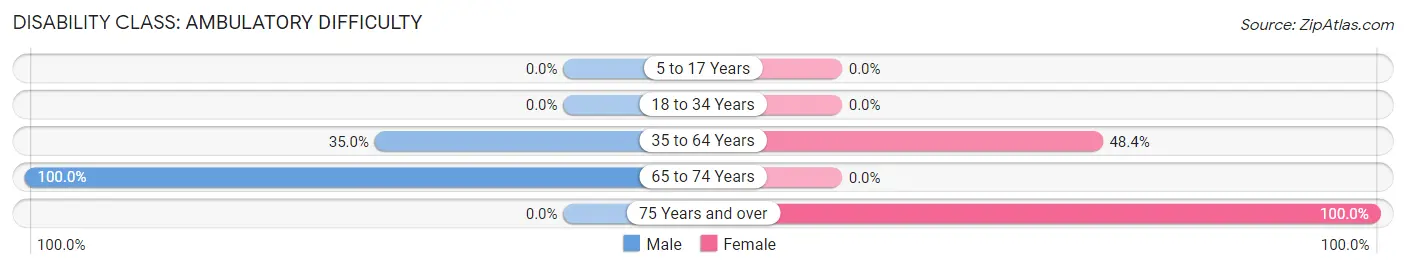
| Age Bracket | Male | Female |
| 5 to 17 Years | 0 (0.0%) | 0 (0.0%) |
| 18 to 34 Years | 0 (0.0%) | 0 (0.0%) |
| 35 to 64 Years | 14 (35.0%) | 45 (48.4%) |
| 65 to 74 Years | 15 (100.0%) | 0 (0.0%) |
| 75 Years and over | 0 (0.0%) | 17 (100.0%) |
Disability Class: Self-Care Difficulty
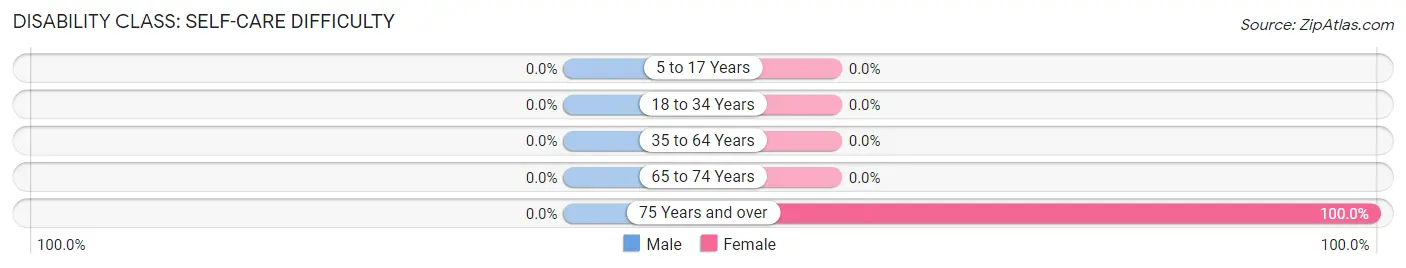
| Age Bracket | Male | Female |
| 5 to 17 Years | 0 (0.0%) | 0 (0.0%) |
| 18 to 34 Years | 0 (0.0%) | 0 (0.0%) |
| 35 to 64 Years | 0 (0.0%) | 0 (0.0%) |
| 65 to 74 Years | 0 (0.0%) | 0 (0.0%) |
| 75 Years and over | 0 (0.0%) | 17 (100.0%) |
Technology Access in Phillipsburg
Computing Device Access in Phillipsburg
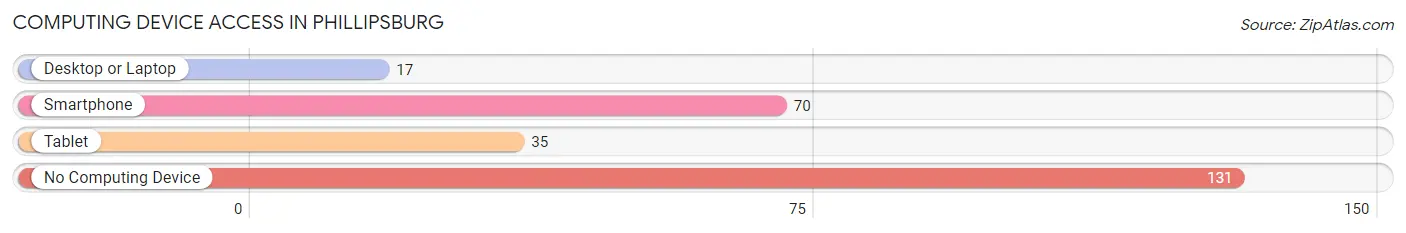
| Device Type | # Households | % Households |
| Desktop or Laptop | 17 | 8.5% |
| Smartphone | 70 | 34.8% |
| Tablet | 35 | 17.4% |
| No Computing Device | 131 | 65.2% |
| Total | 201 | 100.0% |
Internet Access in Phillipsburg
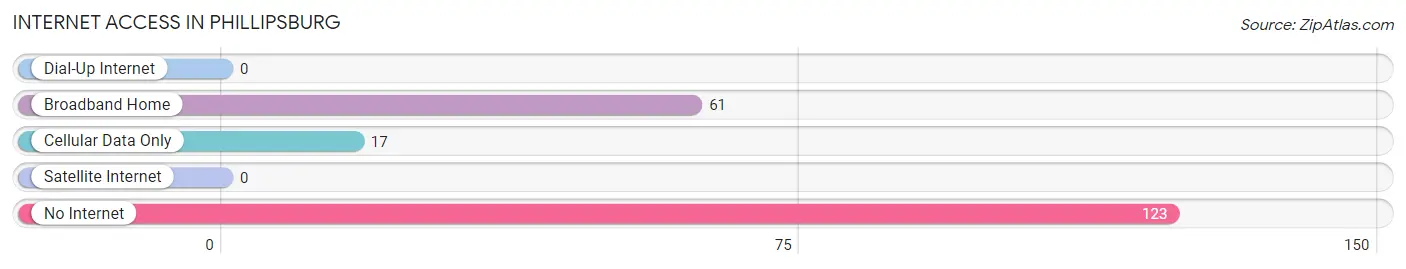
| Internet Type | # Households | % Households |
| Dial-Up Internet | 0 | 0.0% |
| Broadband Home | 61 | 30.3% |
| Cellular Data Only | 17 | 8.5% |
| Satellite Internet | 0 | 0.0% |
| No Internet | 123 | 61.2% |
| Total | 201 | 100.0% |
Phillipsburg Summary
Phillipsburg is a small town located in the state of Georgia, United States. It is situated in the southwestern part of the state, in the county of Decatur. The town has a population of approximately 1,000 people, according to the 2010 census.
History
Phillipsburg was founded in 1820 by a group of settlers from North Carolina. The town was named after the Phillips family, who were among the first settlers. The town was originally a farming community, and the main crops grown were cotton, corn, and tobacco. The town was also known for its sawmills and gristmills.
In the late 19th century, the town began to grow and develop. The railroad was built through the town in 1883, and this helped to spur economic growth. The town also became a center for the timber industry, and several sawmills were built in the area.
In the early 20th century, the town began to decline. The timber industry began to decline, and the railroad was abandoned in the 1930s. The town was also hit hard by the Great Depression.
Geography
Phillipsburg is located in the southwestern part of Georgia, in the county of Decatur. The town is situated on the banks of the Oconee River. The town is surrounded by rolling hills and forests. The climate in the area is mild, with hot summers and mild winters.
Economy
The economy of Phillipsburg is largely based on agriculture. The main crops grown in the area are cotton, corn, and tobacco. The town also has several sawmills and gristmills.
The town also has a few small businesses, including a grocery store, a hardware store, and a few restaurants. The town also has a few small manufacturing companies.
Demographics
According to the 2010 census, the population of Phillipsburg was 1,000. The racial makeup of the town was 95.2% White, 2.2% African American, 0.7% Native American, 0.2% Asian, and 1.7% from other races. The median household income was $30,000, and the median age was 38.
Conclusion
Phillipsburg is a small town located in the southwestern part of Georgia. The town has a population of approximately 1,000 people, and the economy is largely based on agriculture. The town also has a few small businesses, and the racial makeup of the town is mostly White. Phillipsburg is a quiet and peaceful town, and it is a great place to live and raise a family.
Common Questions
What is Per Capita Income in Phillipsburg?
Per Capita income in Phillipsburg is $14,236.
What is the Median Household income in Phillipsburg?
Median Household Income in Phillipsburg is $23,942.
What is Inequality or Gini Index in Phillipsburg?
Inequality or Gini Index in Phillipsburg is 0.38.
What is the Total Population of Phillipsburg?
Total Population of Phillipsburg is 467.
What is the Total Male Population of Phillipsburg?
Total Male Population of Phillipsburg is 271.
What is the Total Female Population of Phillipsburg?
Total Female Population of Phillipsburg is 196.
What is the Ratio of Males per 100 Females in Phillipsburg?
There are 138.27 Males per 100 Females in Phillipsburg.
What is the Ratio of Females per 100 Males in Phillipsburg?
There are 72.32 Females per 100 Males in Phillipsburg.
What is the Median Population Age in Phillipsburg?
Median Population Age in Phillipsburg is 31.1 Years.
What is the Average Family Size in Phillipsburg
Average Family Size in Phillipsburg is 3.1 People.
What is the Average Household Size in Phillipsburg
Average Household Size in Phillipsburg is 2.3 People.
How Large is the Labor Force in Phillipsburg?
There are 60 People in the Labor Forcein in Phillipsburg.
What is the Percentage of People in the Labor Force in Phillipsburg?
19.7% of People are in the Labor Force in Phillipsburg.