Zip Codes with the Highest Poverty Level Among Children Under the Age of 5 in Atlanta, GA
RELATED REPORTS & OPTIONS
Highest Poverty | Child 0-5
Atlanta
Compare Zip Codes
Map of Zip Codes with the Highest Poverty Level Among Children Under the Age of 5 in Atlanta
1.0%
51.9%
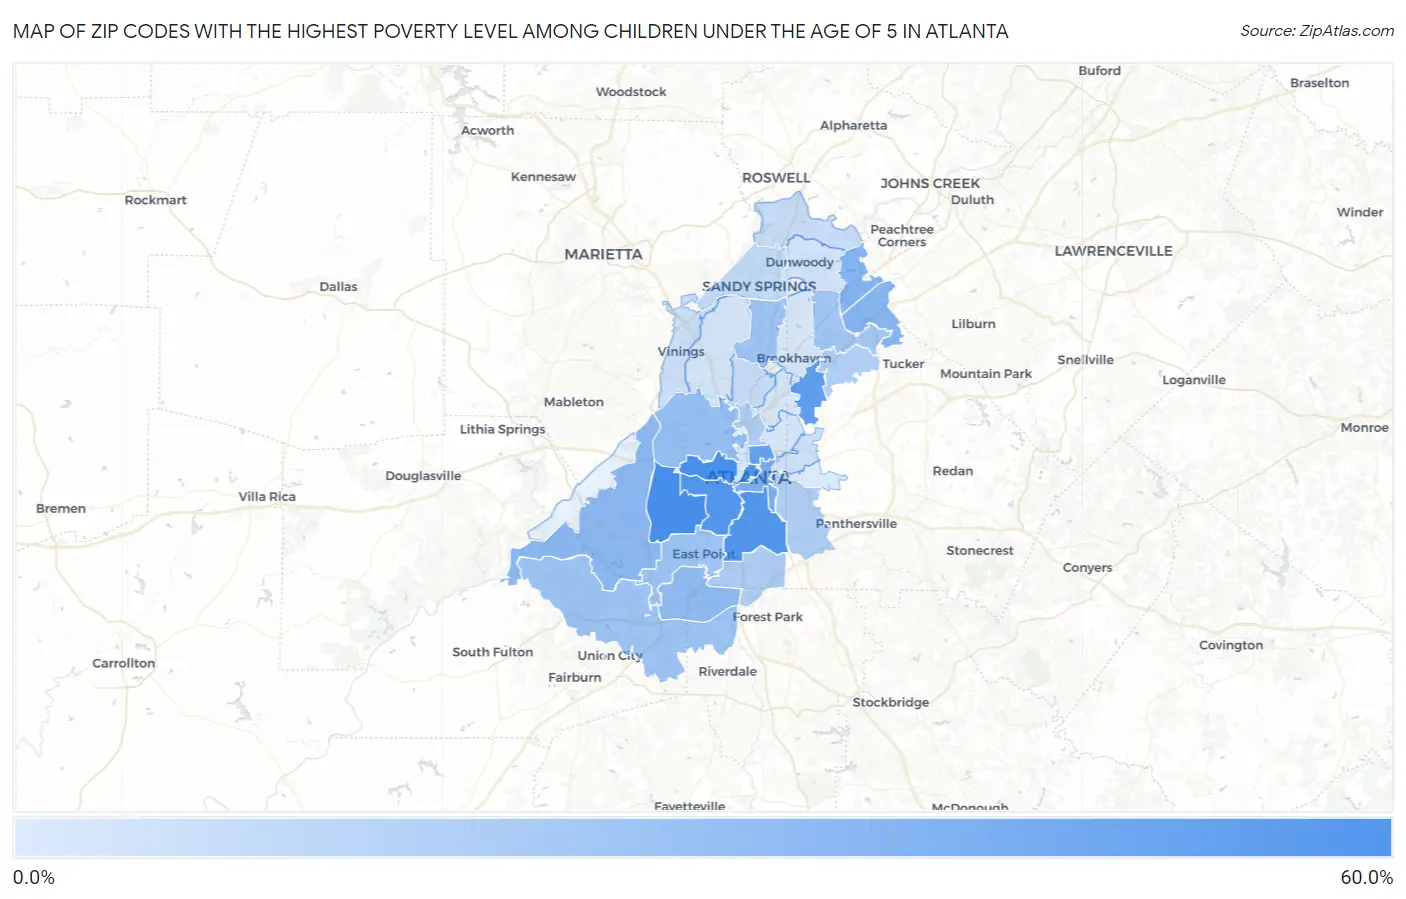
Zip Codes with the Highest Poverty Level Among Children Under the Age of 5 in Atlanta, GA
| Zip Code | Child Poverty | vs State | vs National | |
| 1. | 30311 | 51.9% | 20.3%(+31.6)#59 | 18.1%(+33.8)#2,352 |
| 2. | 30314 | 51.8% | 20.3%(+31.5)#60 | 18.1%(+33.7)#2,357 |
| 3. | 30303 | 48.7% | 20.3%(+28.4)#74 | 18.1%(+30.7)#2,730 |
| 4. | 30315 | 47.4% | 20.3%(+27.1)#78 | 18.1%(+29.4)#2,873 |
| 5. | 30310 | 46.2% | 20.3%(+25.9)#83 | 18.1%(+28.2)#3,009 |
| 6. | 30329 | 42.0% | 20.3%(+21.7)#115 | 18.1%(+24.0)#3,653 |
| 7. | 30308 | 39.7% | 20.3%(+19.3)#123 | 18.1%(+21.6)#4,091 |
| 8. | 30312 | 31.9% | 20.3%(+11.5)#189 | 18.1%(+13.8)#5,871 |
| 9. | 30360 | 28.6% | 20.3%(+8.25)#215 | 18.1%(+10.5)#6,769 |
| 10. | 30340 | 27.5% | 20.3%(+7.14)#227 | 18.1%(+9.41)#7,141 |
| 11. | 30331 | 26.0% | 20.3%(+5.68)#243 | 18.1%(+7.95)#7,635 |
| 12. | 30337 | 24.4% | 20.3%(+4.02)#255 | 18.1%(+6.29)#8,224 |
| 13. | 30318 | 22.6% | 20.3%(+2.29)#280 | 18.1%(+4.56)#8,910 |
| 14. | 30344 | 20.0% | 20.3%(-0.362)#314 | 18.1%(+1.91)#10,086 |
| 15. | 30349 | 19.5% | 20.3%(-0.854)#320 | 18.1%(+1.42)#10,274 |
| 16. | 30342 | 18.8% | 20.3%(-1.58)#327 | 18.1%(+0.691)#10,603 |
| 17. | 30341 | 18.2% | 20.3%(-2.16)#335 | 18.1%(+0.111)#10,889 |
| 18. | 30354 | 14.8% | 20.3%(-5.53)#372 | 18.1%(-3.25)#12,579 |
| 19. | 30345 | 14.2% | 20.3%(-6.16)#385 | 18.1%(-3.89)#12,943 |
| 20. | 30309 | 13.8% | 20.3%(-6.52)#390 | 18.1%(-4.25)#13,146 |
| 21. | 30316 | 13.6% | 20.3%(-6.70)#394 | 18.1%(-4.42)#13,234 |
| 22. | 30328 | 8.2% | 20.3%(-12.1)#461 | 18.1%(-9.87)#16,646 |
| 23. | 30305 | 6.7% | 20.3%(-13.6)#477 | 18.1%(-11.4)#17,588 |
| 24. | 30350 | 6.7% | 20.3%(-13.6)#478 | 18.1%(-11.4)#17,599 |
| 25. | 30339 | 5.7% | 20.3%(-14.6)#495 | 18.1%(-12.4)#18,290 |
| 26. | 30307 | 4.8% | 20.3%(-15.6)#506 | 18.1%(-13.3)#18,923 |
| 27. | 30338 | 3.9% | 20.3%(-16.4)#521 | 18.1%(-14.1)#19,555 |
| 28. | 30313 | 3.4% | 20.3%(-16.9)#527 | 18.1%(-14.6)#19,885 |
| 29. | 30327 | 3.1% | 20.3%(-17.3)#532 | 18.1%(-15.0)#20,132 |
| 30. | 30324 | 2.5% | 20.3%(-17.8)#542 | 18.1%(-15.5)#20,486 |
| 31. | 30319 | 2.2% | 20.3%(-18.2)#549 | 18.1%(-15.9)#20,716 |
| 32. | 30306 | 1.7% | 20.3%(-18.6)#552 | 18.1%(-16.3)#21,004 |
| 33. | 30317 | 1.0% | 20.3%(-19.3)#557 | 18.1%(-17.0)#21,375 |
1
Common Questions
What are the Top 10 Zip Codes with the Highest Poverty Level Among Children Under the Age of 5 in Atlanta, GA?
Top 10 Zip Codes with the Highest Poverty Level Among Children Under the Age of 5 in Atlanta, GA are:
What zip code has the Highest Poverty Level Among Children Under the Age of 5 in Atlanta, GA?
30311 has the Highest Poverty Level Among Children Under the Age of 5 in Atlanta, GA with 51.9%.
What is the Poverty Level Among Children Under the Age of 5 in Atlanta, GA?
Poverty Level Among Children Under the Age of 5 in Atlanta is 24.4%.
What is the Poverty Level Among Children Under the Age of 5 in Georgia?
Poverty Level Among Children Under the Age of 5 in Georgia is 20.3%.
What is the Poverty Level Among Children Under the Age of 5 in the United States?
Poverty Level Among Children Under the Age of 5 in the United States is 18.1%.