Zip Codes with the Highest Percentage of Population with a Degree in Visual and Performing Arts in Longmont, CO
RELATED REPORTS & OPTIONS
Visual and Performing Arts
Longmont
Compare Zip Codes
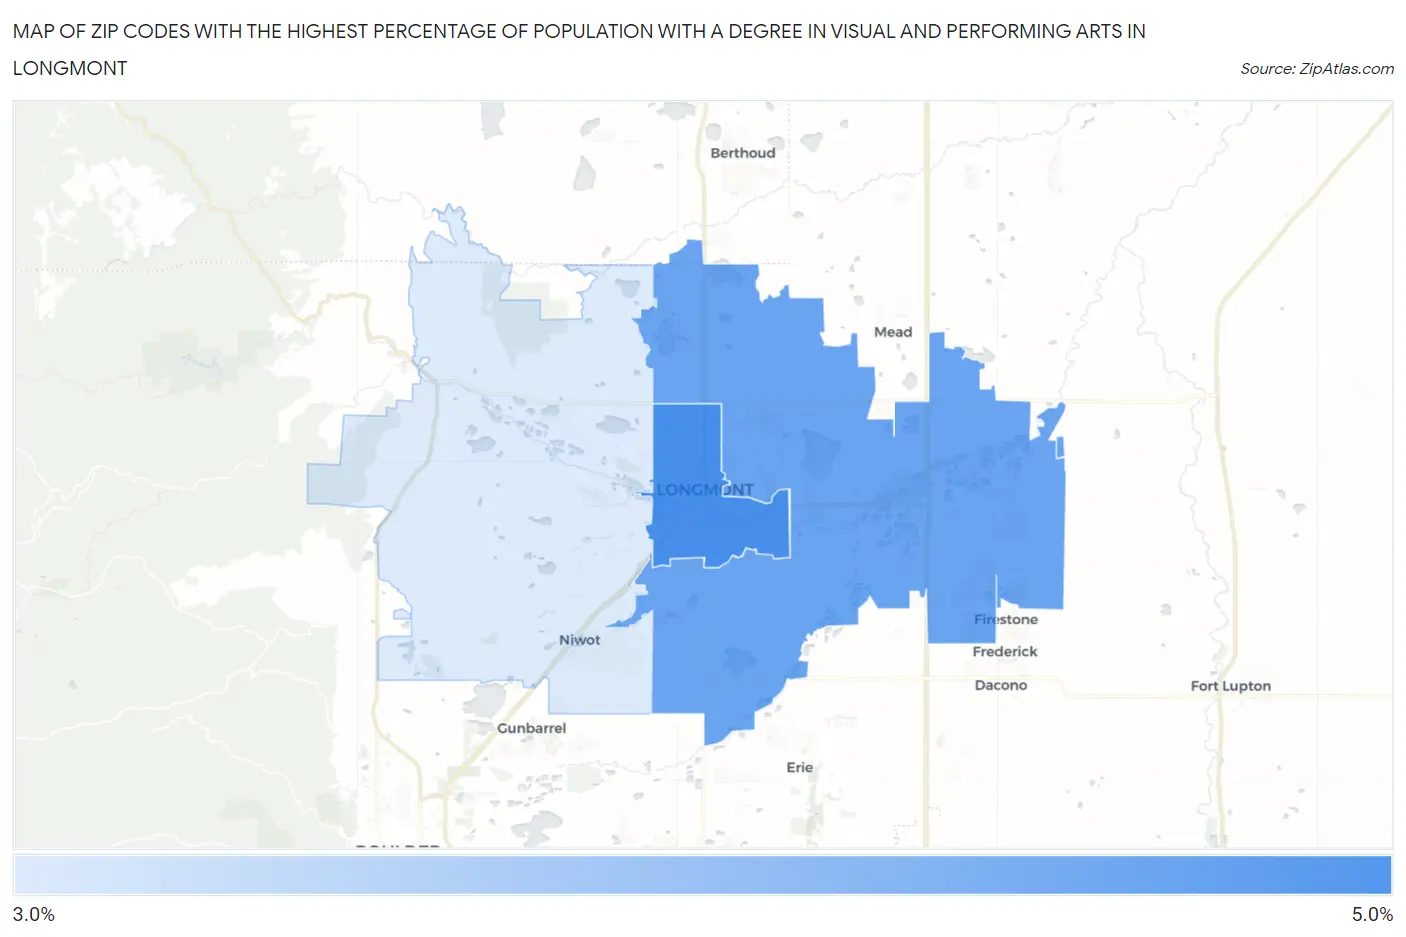
Map of Zip Codes with the Highest Percentage of Population with a Degree in Visual and Performing Arts in Longmont
3.3%
4.9%
Zip Codes with the Highest Percentage of Population with a Degree in Visual and Performing Arts in Longmont, CO
| Zip Code | % Graduates | vs State | vs National | |
| 1. | 80501 | 4.9% | 4.3%(+0.571)#147 | 4.3%(+0.646)#6,867 |
| 2. | 80504 | 4.5% | 4.3%(+0.196)#162 | 4.3%(+0.270)#7,753 |
| 3. | 80503 | 3.3% | 4.3%(-1.01)#224 | 4.3%(-0.935)#11,539 |
1
Common Questions
What are the Top Zip Codes with the Highest Percentage of Population with a Degree in Visual and Performing Arts in Longmont, CO?
Top Zip Codes with the Highest Percentage of Population with a Degree in Visual and Performing Arts in Longmont, CO are:
What zip code has the Highest Percentage of Population with a Degree in Visual and Performing Arts in Longmont, CO?
80501 has the Highest Percentage of Population with a Degree in Visual and Performing Arts in Longmont, CO with 4.9%.
What is the Percentage of Population with a Degree in Visual and Performing Arts in Longmont, CO?
Percentage of Population with a Degree in Visual and Performing Arts in Longmont is 4.1%.
What is the Percentage of Population with a Degree in Visual and Performing Arts in Colorado?
Percentage of Population with a Degree in Visual and Performing Arts in Colorado is 4.3%.
What is the Percentage of Population with a Degree in Visual and Performing Arts in the United States?
Percentage of Population with a Degree in Visual and Performing Arts in the United States is 4.3%.