City of Creede, CO Map & Demographics
City of Creede Map
City of Creede Overview
$29,850
PER CAPITA INCOME
$55,833
AVG FAMILY INCOME
$51,033
AVG HOUSEHOLD INCOME
66.9%
WAGE / INCOME GAP [ % ]
33.1¢/ $1
WAGE / INCOME GAP [ $ ]
0.34
INEQUALITY / GINI INDEX
280
TOTAL POPULATION
118
MALE POPULATION
162
FEMALE POPULATION
72.84
MALES / 100 FEMALES
137.29
FEMALES / 100 MALES
39.1
MEDIAN AGE
2.3
AVG FAMILY SIZE
1.6
AVG HOUSEHOLD SIZE
181
LABOR FORCE [ PEOPLE ]
73.3%
PERCENT IN LABOR FORCE
4.4%
UNEMPLOYMENT RATE
Income in City of Creede
Income Overview in City of Creede
Per Capita Income in City of Creede is $29,850, while median incomes of families and households are $55,833 and $51,033 respectively.
| Characteristic | Number | Measure |
| Per Capita Income | 280 | $29,850 |
| Median Family Income | 80 | $55,833 |
| Mean Family Income | 80 | $62,899 |
| Median Household Income | 169 | $51,033 |
| Mean Household Income | 169 | $49,220 |
| Income Deficit | 80 | $0 |
| Wage / Income Gap (%) | 280 | 66.94% |
| Wage / Income Gap ($) | 280 | 33.06¢ per $1 |
| Gini / Inequality Index | 280 | 0.34 |
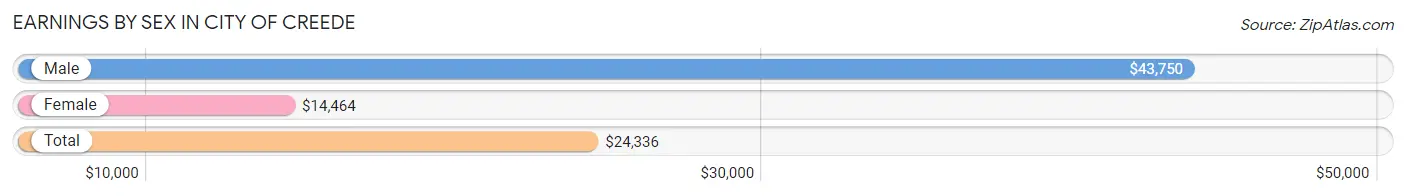
Earnings by Sex in City of Creede
Average Earnings in City of Creede are $24,336, $43,750 for men and $14,464 for women, a difference of 66.9%.
| Sex | Number | Average Earnings |
| Male | 99 (48.3%) | $43,750 |
| Female | 106 (51.7%) | $14,464 |
| Total | 205 (100.0%) | $24,336 |
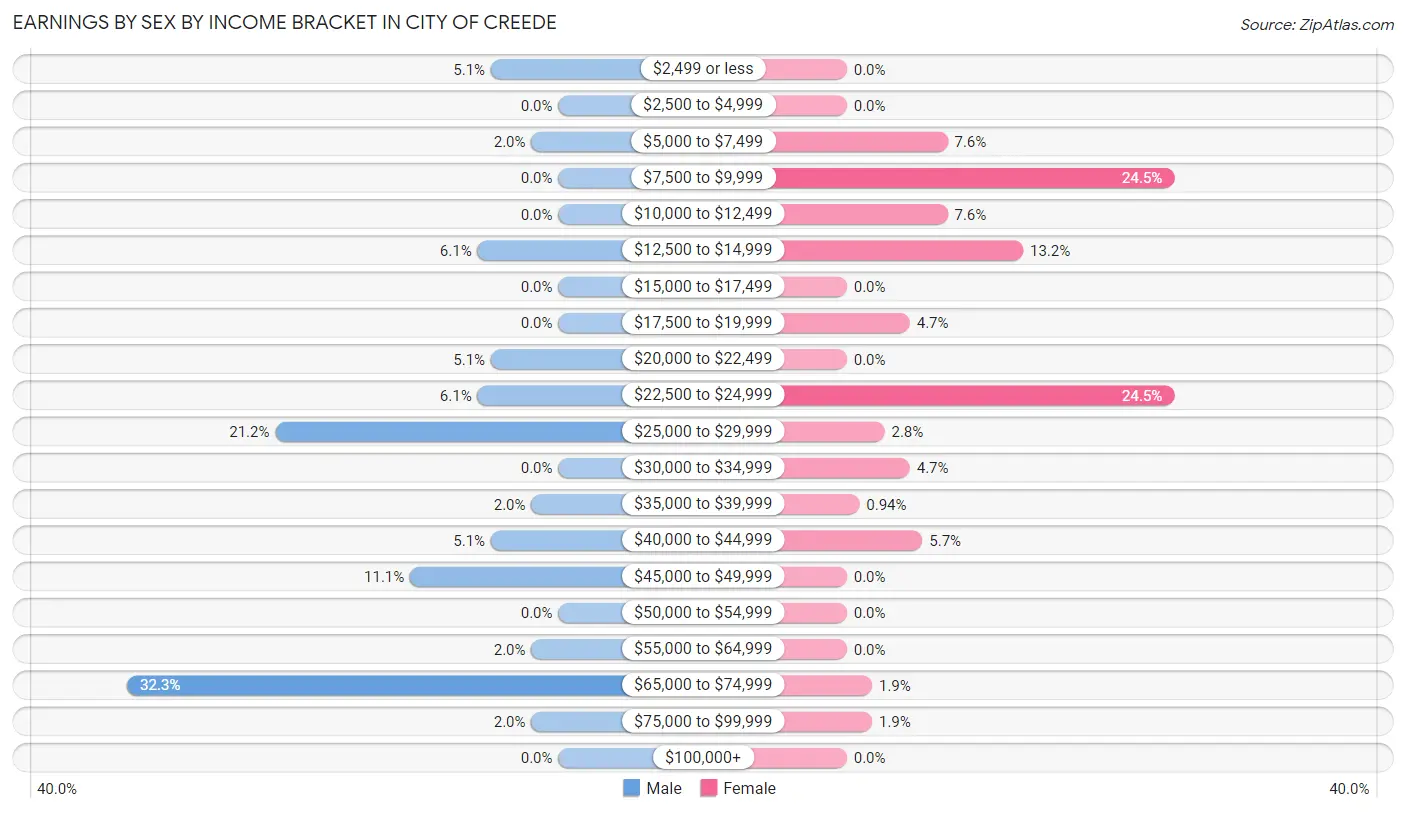
Earnings by Sex by Income Bracket in City of Creede
The most common earnings brackets in City of Creede are $65,000 to $74,999 for men (32 | 32.3%) and $7,500 to $9,999 for women (26 | 24.5%).
| Income | Male | Female |
| $2,499 or less | 5 (5.1%) | 0 (0.0%) |
| $2,500 to $4,999 | 0 (0.0%) | 0 (0.0%) |
| $5,000 to $7,499 | 2 (2.0%) | 8 (7.5%) |
| $7,500 to $9,999 | 0 (0.0%) | 26 (24.5%) |
| $10,000 to $12,499 | 0 (0.0%) | 8 (7.5%) |
| $12,500 to $14,999 | 6 (6.1%) | 14 (13.2%) |
| $15,000 to $17,499 | 0 (0.0%) | 0 (0.0%) |
| $17,500 to $19,999 | 0 (0.0%) | 5 (4.7%) |
| $20,000 to $22,499 | 5 (5.1%) | 0 (0.0%) |
| $22,500 to $24,999 | 6 (6.1%) | 26 (24.5%) |
| $25,000 to $29,999 | 21 (21.2%) | 3 (2.8%) |
| $30,000 to $34,999 | 0 (0.0%) | 5 (4.7%) |
| $35,000 to $39,999 | 2 (2.0%) | 1 (0.9%) |
| $40,000 to $44,999 | 5 (5.1%) | 6 (5.7%) |
| $45,000 to $49,999 | 11 (11.1%) | 0 (0.0%) |
| $50,000 to $54,999 | 0 (0.0%) | 0 (0.0%) |
| $55,000 to $64,999 | 2 (2.0%) | 0 (0.0%) |
| $65,000 to $74,999 | 32 (32.3%) | 2 (1.9%) |
| $75,000 to $99,999 | 2 (2.0%) | 2 (1.9%) |
| $100,000+ | 0 (0.0%) | 0 (0.0%) |
| Total | 99 (100.0%) | 106 (100.0%) |
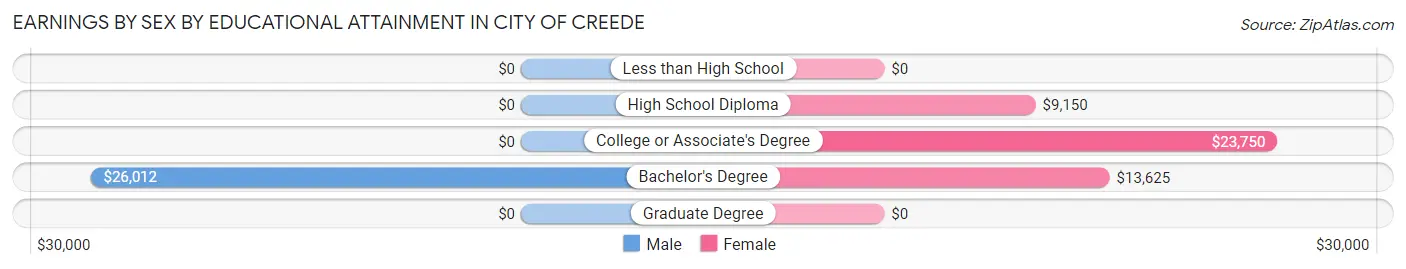
Earnings by Sex by Educational Attainment in City of Creede
Average earnings in City of Creede are $44,250 for men and $14,554 for women, a difference of 67.1%. Men with an educational attainment of bachelor's degree enjoy the highest average annual earnings of $26,012, while those with bachelor's degree education earn the least with $26,012. Women with an educational attainment of college or associate's degree earn the most with the average annual earnings of $23,750, while those with high school diploma education have the smallest earnings of $9,150.
| Educational Attainment | Male Income | Female Income |
| Less than High School | - | - |
| High School Diploma | - | - |
| College or Associate's Degree | - | - |
| Bachelor's Degree | $26,012 | $13,625 |
| Graduate Degree | - | - |
| Total | $44,250 | $14,554 |
Family Income in City of Creede
Family Income Brackets in City of Creede
According to the City of Creede family income data, there are 47 families falling into the $50,000 to $74,999 income range, which is the most common income bracket and makes up 58.8% of all families.
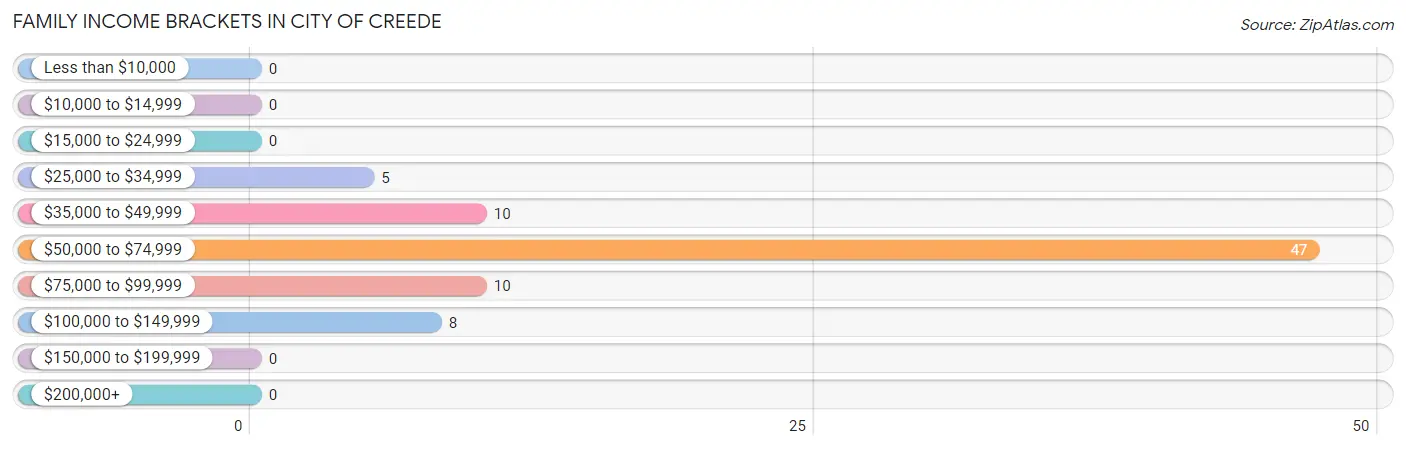
| Income Bracket | # Families | % Families |
| Less than $10,000 | 0 | 0.0% |
| $10,000 to $14,999 | 0 | 0.0% |
| $15,000 to $24,999 | 0 | 0.0% |
| $25,000 to $34,999 | 5 | 6.3% |
| $35,000 to $49,999 | 10 | 12.5% |
| $50,000 to $74,999 | 47 | 58.8% |
| $75,000 to $99,999 | 10 | 12.5% |
| $100,000 to $149,999 | 8 | 10.0% |
| $150,000 to $199,999 | 0 | 0.0% |
| $200,000+ | 0 | 0.0% |
Family Income by Famaliy Size in City of Creede
2-person families (64 | 80.0%) account for the highest median family income in City of Creede with $53,750 per family, while 2-person families (64 | 80.0%) have the highest median income of $26,875 per family member.
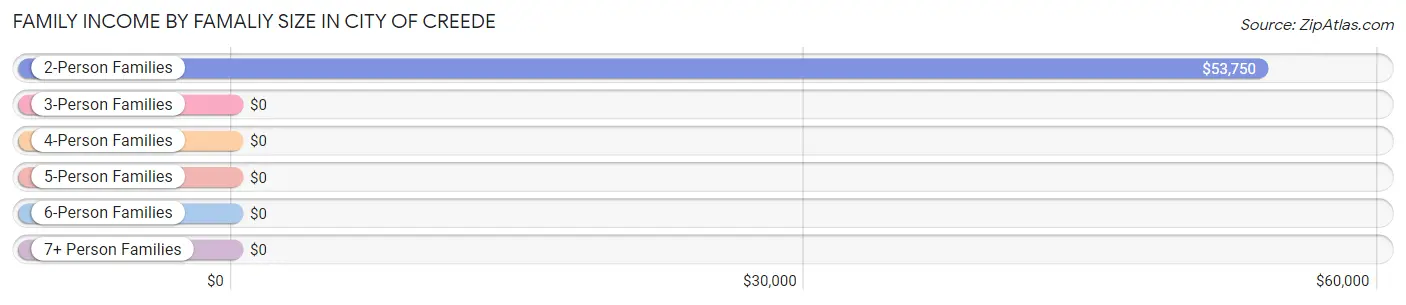
| Income Bracket | # Families | Median Income |
| 2-Person Families | 64 (80.0%) | $53,750 |
| 3-Person Families | 6 (7.5%) | $0 |
| 4-Person Families | 10 (12.5%) | $0 |
| 5-Person Families | 0 (0.0%) | $0 |
| 6-Person Families | 0 (0.0%) | $0 |
| 7+ Person Families | 0 (0.0%) | $0 |
| Total | 80 (100.0%) | $55,833 |
Family Income by Number of Earners in City of Creede
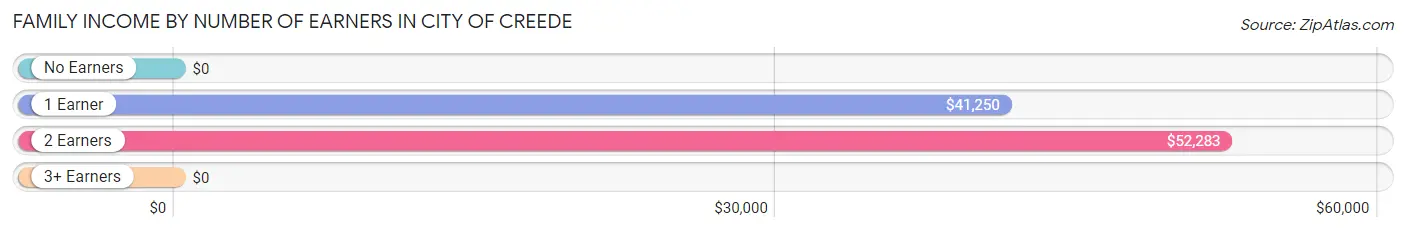
| Number of Earners | # Families | Median Income |
| No Earners | 12 (15.0%) | $0 |
| 1 Earner | 14 (17.5%) | $41,250 |
| 2 Earners | 54 (67.5%) | $52,283 |
| 3+ Earners | 0 (0.0%) | $0 |
| Total | 80 (100.0%) | $55,833 |
Household Income in City of Creede
Household Income Brackets in City of Creede
With 69 households falling in the category, the $50,000 to $74,999 income range is the most frequent in City of Creede, accounting for 40.8% of all households.
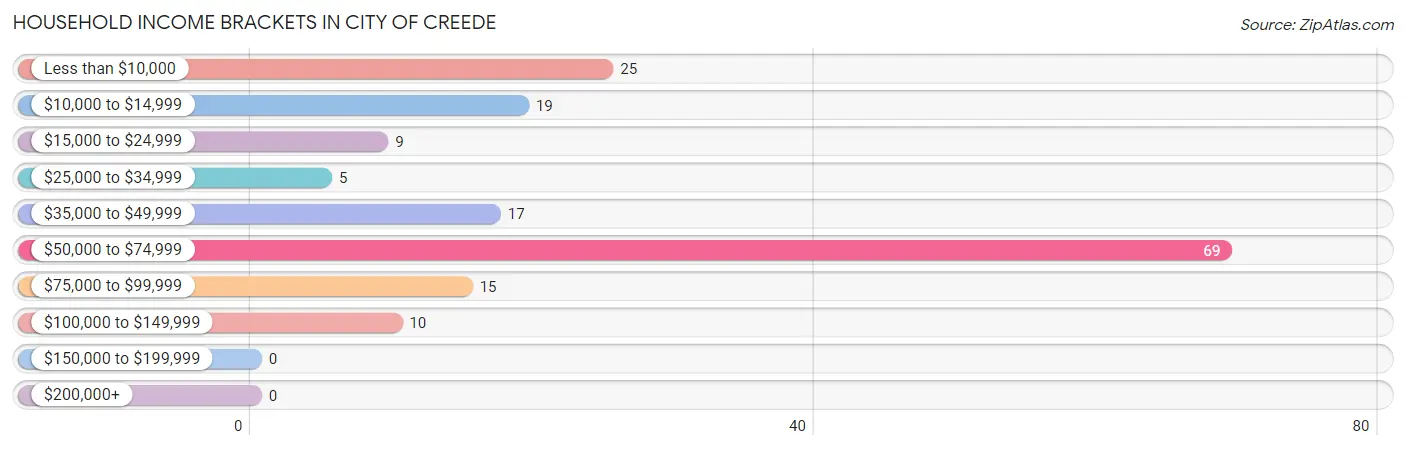
| Income Bracket | # Households | % Households |
| Less than $10,000 | 25 | 14.8% |
| $10,000 to $14,999 | 19 | 11.2% |
| $15,000 to $24,999 | 9 | 5.3% |
| $25,000 to $34,999 | 5 | 3.0% |
| $35,000 to $49,999 | 17 | 10.1% |
| $50,000 to $74,999 | 69 | 40.8% |
| $75,000 to $99,999 | 15 | 8.9% |
| $100,000 to $149,999 | 10 | 5.9% |
| $150,000 to $199,999 | 0 | 0.0% |
| $200,000+ | 0 | 0.0% |
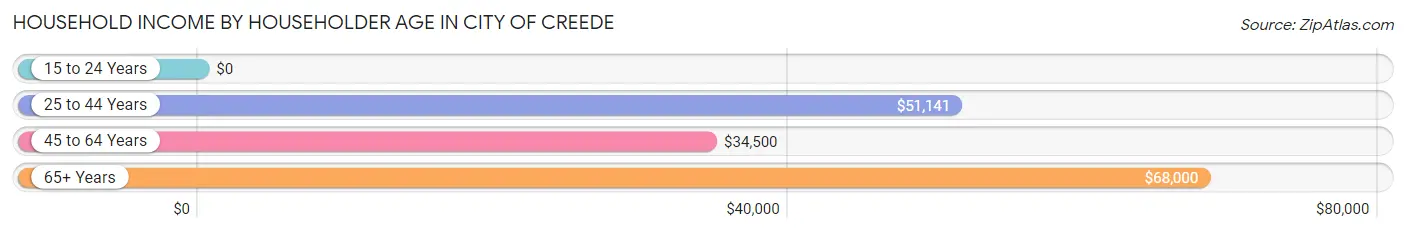
Household Income by Householder Age in City of Creede
The median household income in City of Creede is $51,033, with the highest median household income of $68,000 found in the 65+ years age bracket for the primary householder. A total of 22 households (13.0%) fall into this category.
| Income Bracket | # Households | Median Income |
| 15 to 24 Years | 0 (0.0%) | $0 |
| 25 to 44 Years | 97 (57.4%) | $51,141 |
| 45 to 64 Years | 50 (29.6%) | $34,500 |
| 65+ Years | 22 (13.0%) | $68,000 |
| Total | 169 (100.0%) | $51,033 |
Poverty in City of Creede
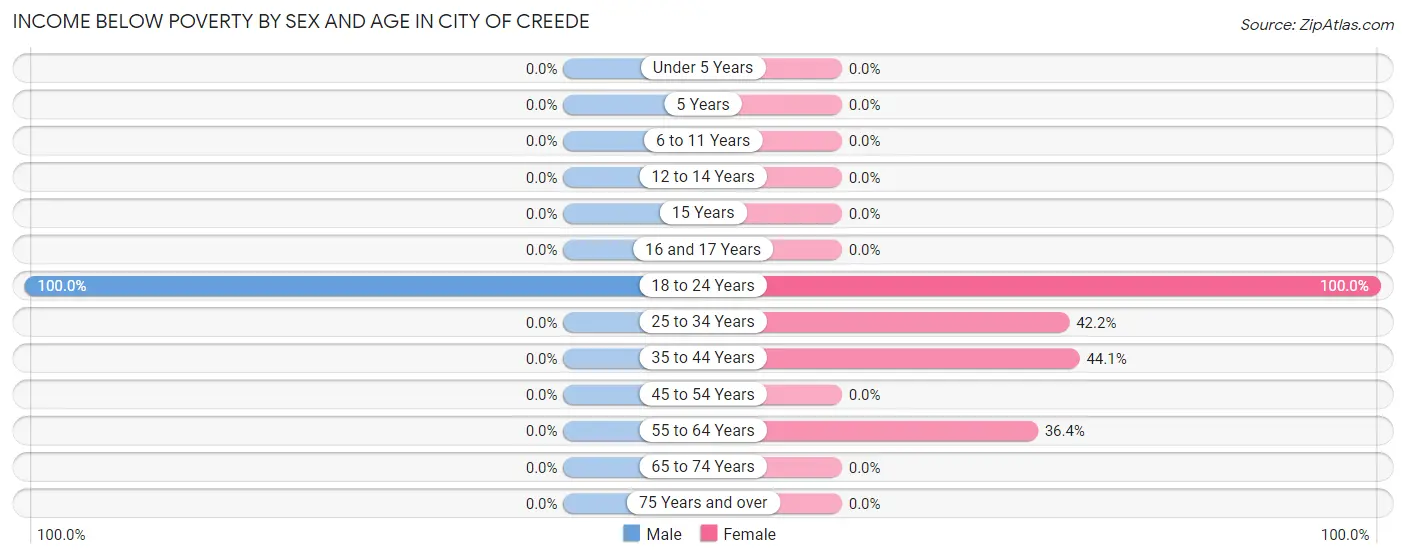
Income Below Poverty by Sex and Age in City of Creede
With 3.4% poverty level for males and 29.0% for females among the residents of City of Creede, 18 to 24 year old males and 18 to 24 year old females are the most vulnerable to poverty, with 4 males (100.0%) and 1 females (100.0%) in their respective age groups living below the poverty level.
| Age Bracket | Male | Female |
| Under 5 Years | 0 (0.0%) | 0 (0.0%) |
| 5 Years | 0 (0.0%) | 0 (0.0%) |
| 6 to 11 Years | 0 (0.0%) | 0 (0.0%) |
| 12 to 14 Years | 0 (0.0%) | 0 (0.0%) |
| 15 Years | 0 (0.0%) | 0 (0.0%) |
| 16 and 17 Years | 0 (0.0%) | 0 (0.0%) |
| 18 to 24 Years | 4 (100.0%) | 1 (100.0%) |
| 25 to 34 Years | 0 (0.0%) | 19 (42.2%) |
| 35 to 44 Years | 0 (0.0%) | 15 (44.1%) |
| 45 to 54 Years | 0 (0.0%) | 0 (0.0%) |
| 55 to 64 Years | 0 (0.0%) | 12 (36.4%) |
| 65 to 74 Years | 0 (0.0%) | 0 (0.0%) |
| 75 Years and over | 0 (0.0%) | 0 (0.0%) |
| Total | 4 (3.4%) | 47 (29.0%) |
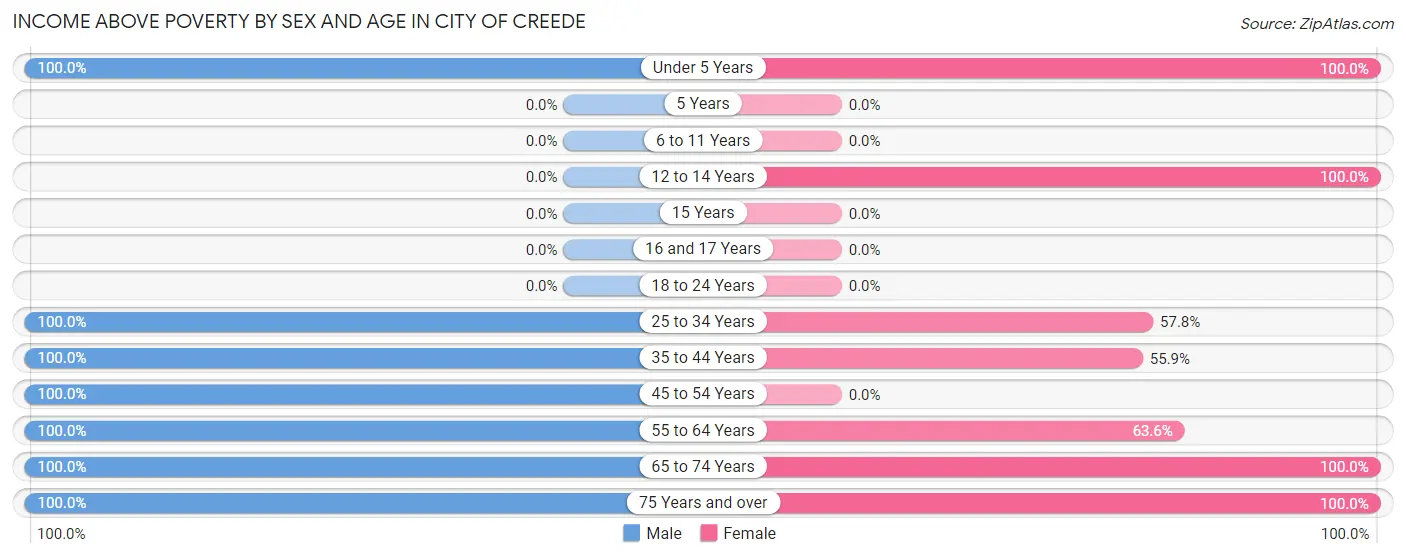
Income Above Poverty by Sex and Age in City of Creede
According to the poverty statistics in City of Creede, males aged under 5 years and females aged under 5 years are the age groups that are most secure financially, with 100.0% of males and 100.0% of females in these age groups living above the poverty line.
| Age Bracket | Male | Female |
| Under 5 Years | 1 (100.0%) | 26 (100.0%) |
| 5 Years | 0 (0.0%) | 0 (0.0%) |
| 6 to 11 Years | 0 (0.0%) | 0 (0.0%) |
| 12 to 14 Years | 0 (0.0%) | 6 (100.0%) |
| 15 Years | 0 (0.0%) | 0 (0.0%) |
| 16 and 17 Years | 0 (0.0%) | 0 (0.0%) |
| 18 to 24 Years | 0 (0.0%) | 0 (0.0%) |
| 25 to 34 Years | 39 (100.0%) | 26 (57.8%) |
| 35 to 44 Years | 19 (100.0%) | 19 (55.9%) |
| 45 to 54 Years | 19 (100.0%) | 0 (0.0%) |
| 55 to 64 Years | 21 (100.0%) | 21 (63.6%) |
| 65 to 74 Years | 5 (100.0%) | 12 (100.0%) |
| 75 Years and over | 10 (100.0%) | 5 (100.0%) |
| Total | 114 (96.6%) | 115 (71.0%) |
Income Below Poverty Among Married-Couple Families in City of Creede
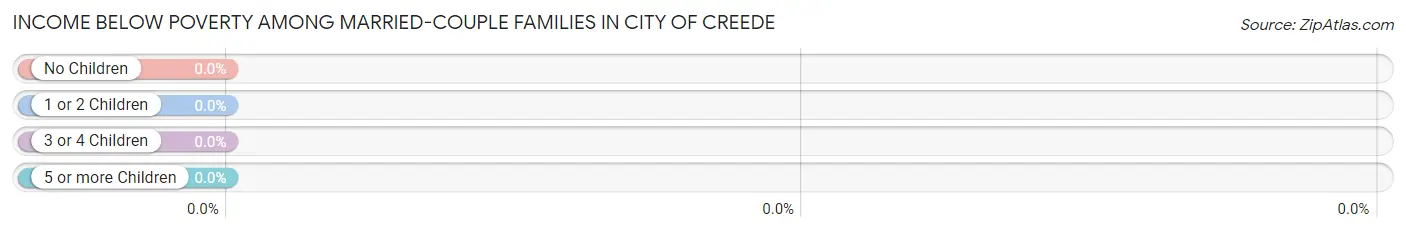
| Children | Above Poverty | Below Poverty |
| No Children | 55 (100.0%) | 0 (0.0%) |
| 1 or 2 Children | 16 (100.0%) | 0 (0.0%) |
| 3 or 4 Children | 0 (0.0%) | 0 (0.0%) |
| 5 or more Children | 0 (0.0%) | 0 (0.0%) |
| Total | 71 (100.0%) | 0 (0.0%) |
Income Below Poverty Among Single-Parent Households in City of Creede
| Children | Single Father | Single Mother |
| No Children | 0 (0.0%) | 0 (0.0%) |
| 1 or 2 Children | 0 (0.0%) | 0 (0.0%) |
| 3 or 4 Children | 0 (0.0%) | 0 (0.0%) |
| 5 or more Children | 0 (0.0%) | 0 (0.0%) |
| Total | 0 (0.0%) | 0 (0.0%) |
Income Below Poverty Among Married-Couple vs Single-Parent Households in City of Creede
| Children | Married-Couple Families | Single-Parent Households |
| No Children | 0 (0.0%) | 0 (0.0%) |
| 1 or 2 Children | 0 (0.0%) | 0 (0.0%) |
| 3 or 4 Children | 0 (0.0%) | 0 (0.0%) |
| 5 or more Children | 0 (0.0%) | 0 (0.0%) |
| Total | 0 (0.0%) | 0 (0.0%) |
Race in City of Creede
The most populous races in City of Creede are White / Caucasian (280 | 100.0%), and Hispanic or Latino (10 | 3.6%).
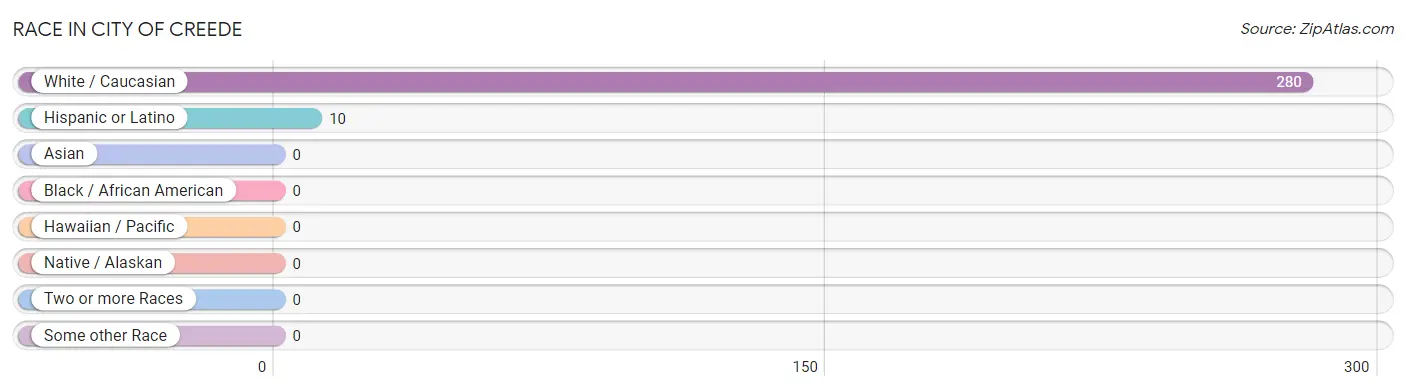
| Race | # Population | % Population |
| Asian | 0 | 0.0% |
| Black / African American | 0 | 0.0% |
| Hawaiian / Pacific | 0 | 0.0% |
| Hispanic or Latino | 10 | 3.6% |
| Native / Alaskan | 0 | 0.0% |
| White / Caucasian | 280 | 100.0% |
| Two or more Races | 0 | 0.0% |
| Some other Race | 0 | 0.0% |
| Total | 280 | 100.0% |
Ancestry in City of Creede
The most populous ancestries reported in City of Creede are German (71 | 25.4%), Irish (70 | 25.0%), Italian (36 | 12.9%), English (15 | 5.4%), and French Canadian (13 | 4.6%), together accounting for 73.2% of all City of Creede residents.
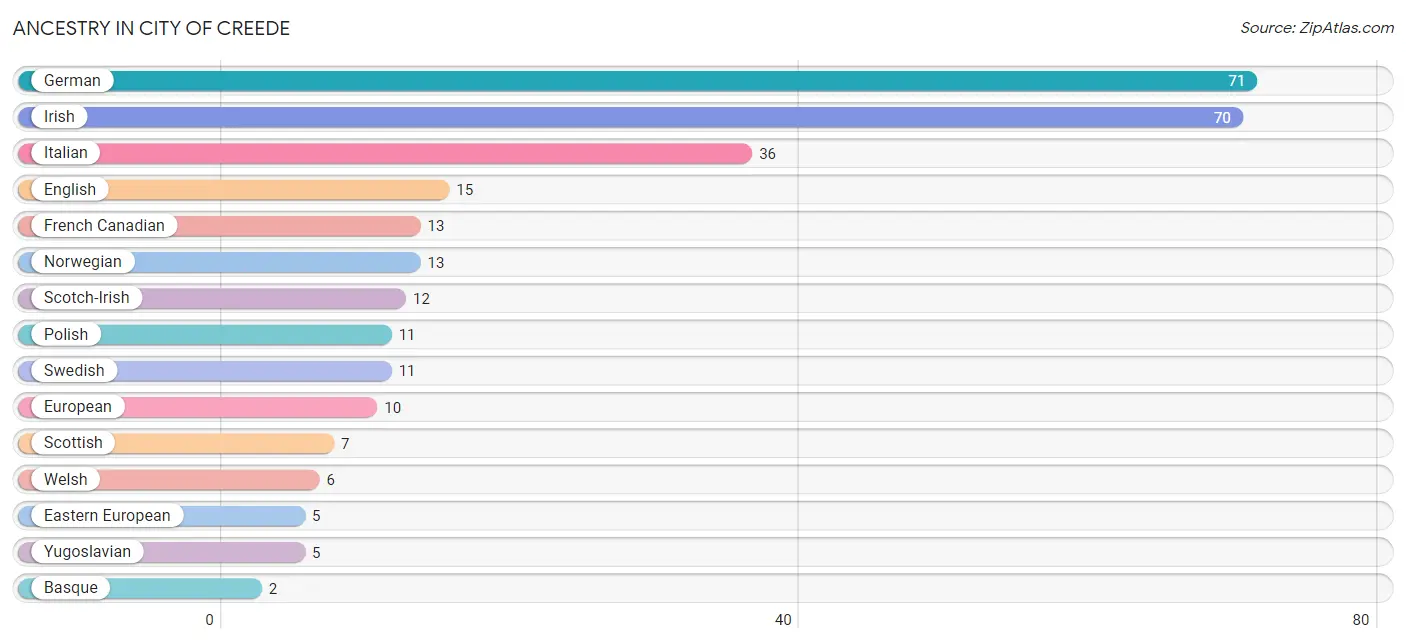
| Ancestry | # Population | % Population |
| Basque | 2 | 0.7% |
| Eastern European | 5 | 1.8% |
| English | 15 | 5.4% |
| European | 10 | 3.6% |
| French Canadian | 13 | 4.6% |
| German | 71 | 25.4% |
| Irish | 70 | 25.0% |
| Italian | 36 | 12.9% |
| Mexican | 2 | 0.7% |
| Norwegian | 13 | 4.6% |
| Polish | 11 | 3.9% |
| Scotch-Irish | 12 | 4.3% |
| Scottish | 7 | 2.5% |
| Swedish | 11 | 3.9% |
| Welsh | 6 | 2.1% |
| Yugoslavian | 5 | 1.8% | View All 16 Rows |
Immigrants in City of Creede

| Immigration Origin | # Population | % Population | View All 0 Rows |
Sex and Age in City of Creede
Sex and Age in City of Creede
The most populous age groups in City of Creede are 30 to 34 Years (39 | 33.1%) for men and 25 to 29 Years (42 | 25.9%) for women.
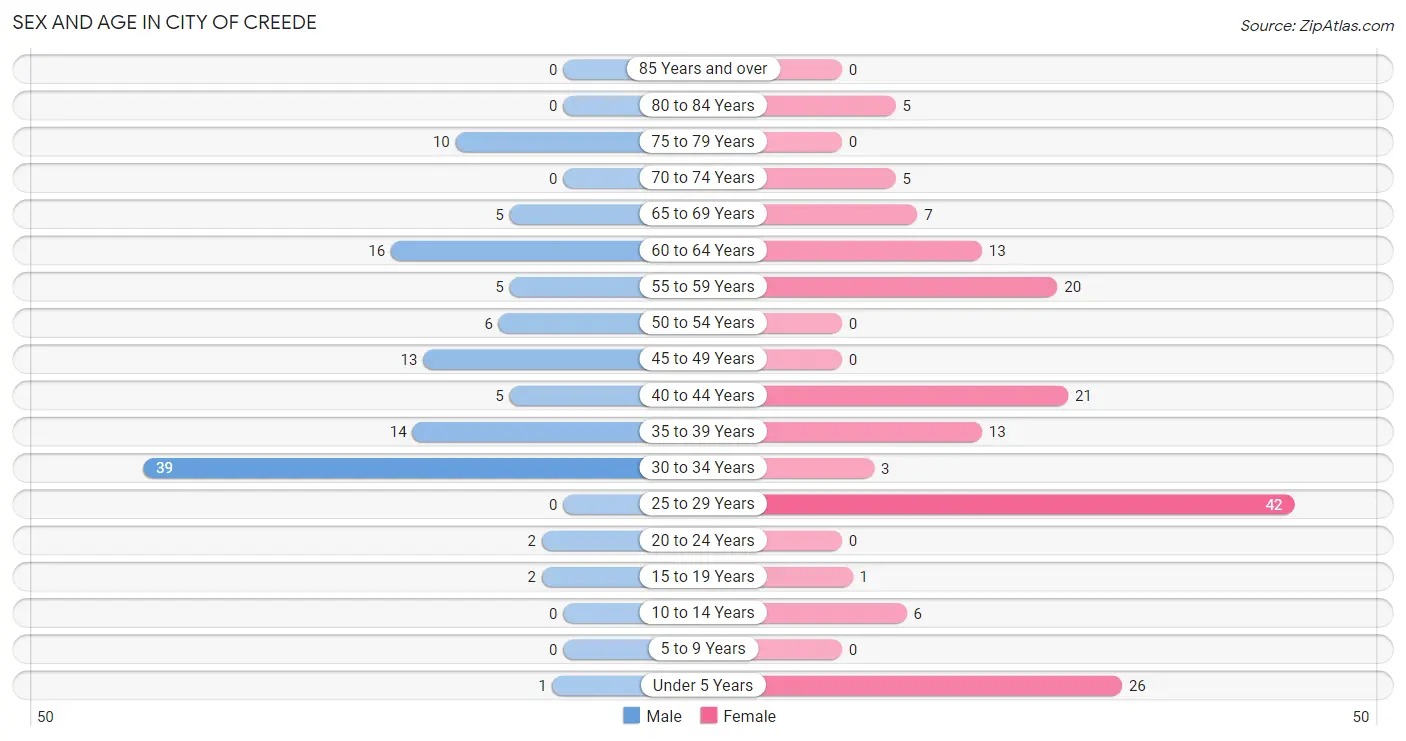
| Age Bracket | Male | Female |
| Under 5 Years | 1 (0.9%) | 26 (16.1%) |
| 5 to 9 Years | 0 (0.0%) | 0 (0.0%) |
| 10 to 14 Years | 0 (0.0%) | 6 (3.7%) |
| 15 to 19 Years | 2 (1.7%) | 1 (0.6%) |
| 20 to 24 Years | 2 (1.7%) | 0 (0.0%) |
| 25 to 29 Years | 0 (0.0%) | 42 (25.9%) |
| 30 to 34 Years | 39 (33.1%) | 3 (1.8%) |
| 35 to 39 Years | 14 (11.9%) | 13 (8.0%) |
| 40 to 44 Years | 5 (4.2%) | 21 (13.0%) |
| 45 to 49 Years | 13 (11.0%) | 0 (0.0%) |
| 50 to 54 Years | 6 (5.1%) | 0 (0.0%) |
| 55 to 59 Years | 5 (4.2%) | 20 (12.3%) |
| 60 to 64 Years | 16 (13.6%) | 13 (8.0%) |
| 65 to 69 Years | 5 (4.2%) | 7 (4.3%) |
| 70 to 74 Years | 0 (0.0%) | 5 (3.1%) |
| 75 to 79 Years | 10 (8.5%) | 0 (0.0%) |
| 80 to 84 Years | 0 (0.0%) | 5 (3.1%) |
| 85 Years and over | 0 (0.0%) | 0 (0.0%) |
| Total | 118 (100.0%) | 162 (100.0%) |
Families and Households in City of Creede
Median Family Size in City of Creede
The median family size in City of Creede is 2.28 persons per family, with single male/father families (4 | 5.0%) accounting for the largest median family size of 2.5 persons per family. On the other hand, single female/mother families (5 | 6.2%) represent the smallest median family size with 1.80 persons per family.
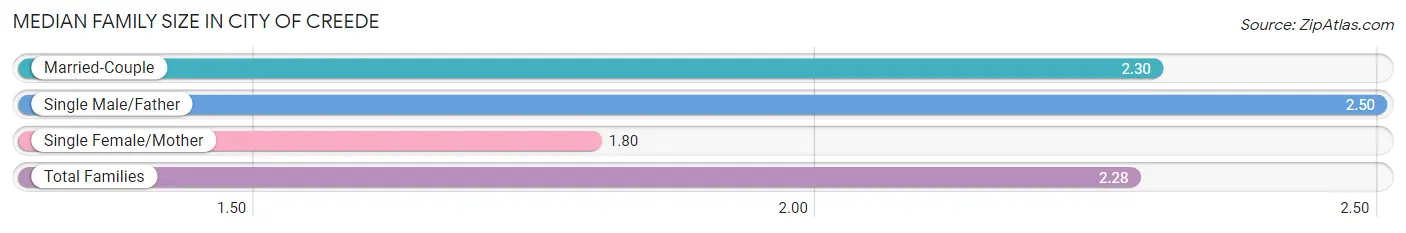
| Family Type | # Families | Family Size |
| Married-Couple | 71 (88.7%) | 2.30 |
| Single Male/Father | 4 (5.0%) | 2.50 |
| Single Female/Mother | 5 (6.2%) | 1.80 |
| Total Families | 80 (100.0%) | 2.28 |
Median Household Size in City of Creede
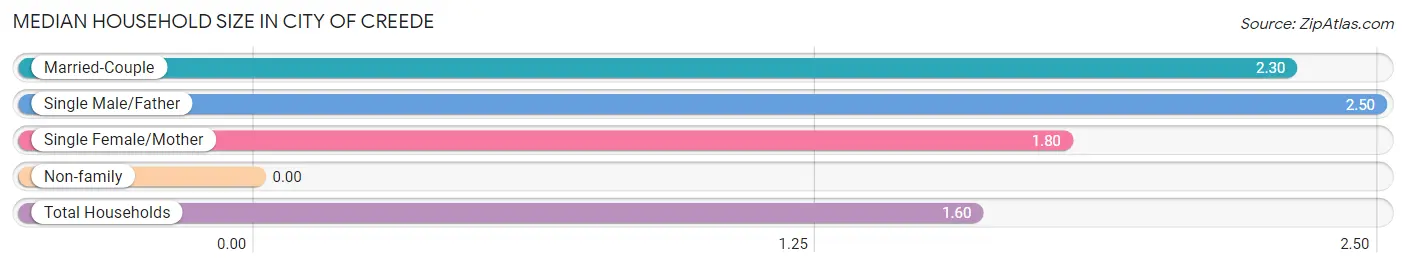
| Household Type | # Households | Household Size |
| Married-Couple | 71 (42.0%) | 2.30 |
| Single Male/Father | 4 (2.4%) | 2.50 |
| Single Female/Mother | 5 (3.0%) | 1.80 |
| Non-family | 89 (52.7%) | - |
| Total Households | 169 (100.0%) | 1.60 |
Household Size by Marriage Status in City of Creede
Out of a total of 169 households in City of Creede, 80 (47.3%) are family households, while 89 (52.7%) are nonfamily households. The most numerous type of family households are 2-person households, comprising 64, and the most common type of nonfamily households are 1-person households, comprising 89.
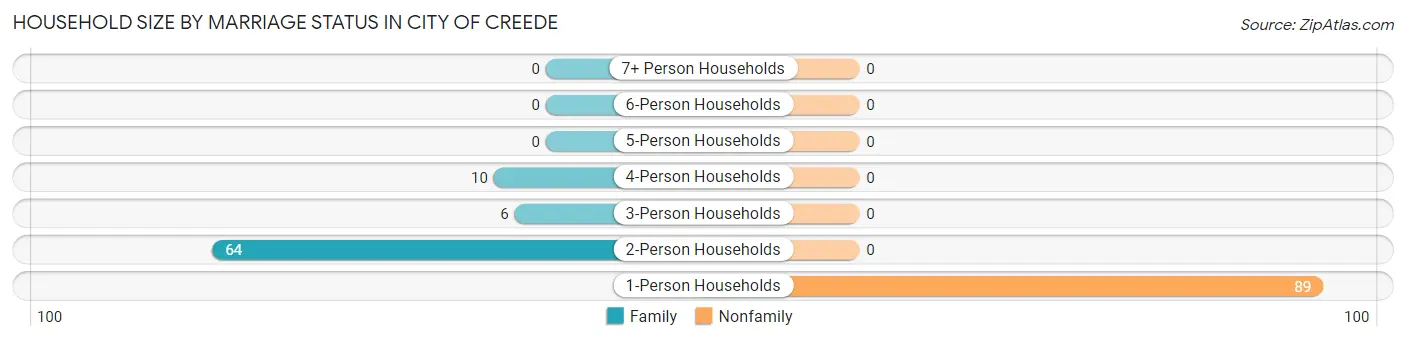
| Household Size | Family Households | Nonfamily Households |
| 1-Person Households | - | 89 (52.7%) |
| 2-Person Households | 64 (37.9%) | 0 (0.0%) |
| 3-Person Households | 6 (3.5%) | 0 (0.0%) |
| 4-Person Households | 10 (5.9%) | 0 (0.0%) |
| 5-Person Households | 0 (0.0%) | 0 (0.0%) |
| 6-Person Households | 0 (0.0%) | 0 (0.0%) |
| 7+ Person Households | 0 (0.0%) | 0 (0.0%) |
| Total | 80 (47.3%) | 89 (52.7%) |
Female Fertility in City of Creede
Fertility by Age in City of Creede
Average fertility rate in City of Creede is 125.0 births per 1,000 women. Women in the age bracket of 35 to 50 years have the highest fertility rate with 294.0 births per 1,000 women. Women in the age bracket of 35 to 50 years acount for 100.0% of all women with births.
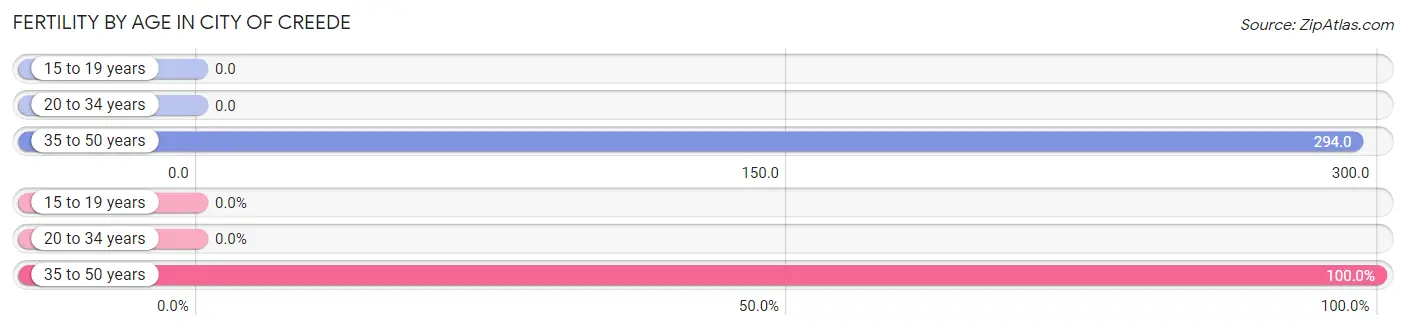
| Age Bracket | Women with Births | Births / 1,000 Women |
| 15 to 19 years | 0 (0.0%) | 0.0 |
| 20 to 34 years | 0 (0.0%) | 0.0 |
| 35 to 50 years | 10 (100.0%) | 294.0 |
| Total | 10 (100.0%) | 125.0 |
Fertility by Age by Marriage Status in City of Creede
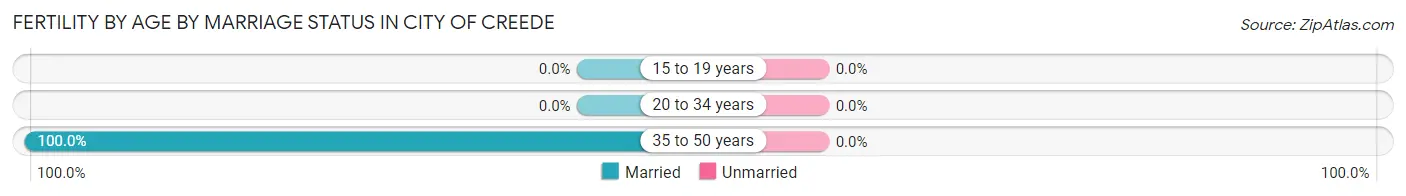
| Age Bracket | Married | Unmarried |
| 15 to 19 years | 0 (0.0%) | 0 (0.0%) |
| 20 to 34 years | 0 (0.0%) | 0 (0.0%) |
| 35 to 50 years | 10 (100.0%) | 0 (0.0%) |
| Total | 10 (100.0%) | 0 (0.0%) |
Fertility by Education in City of Creede
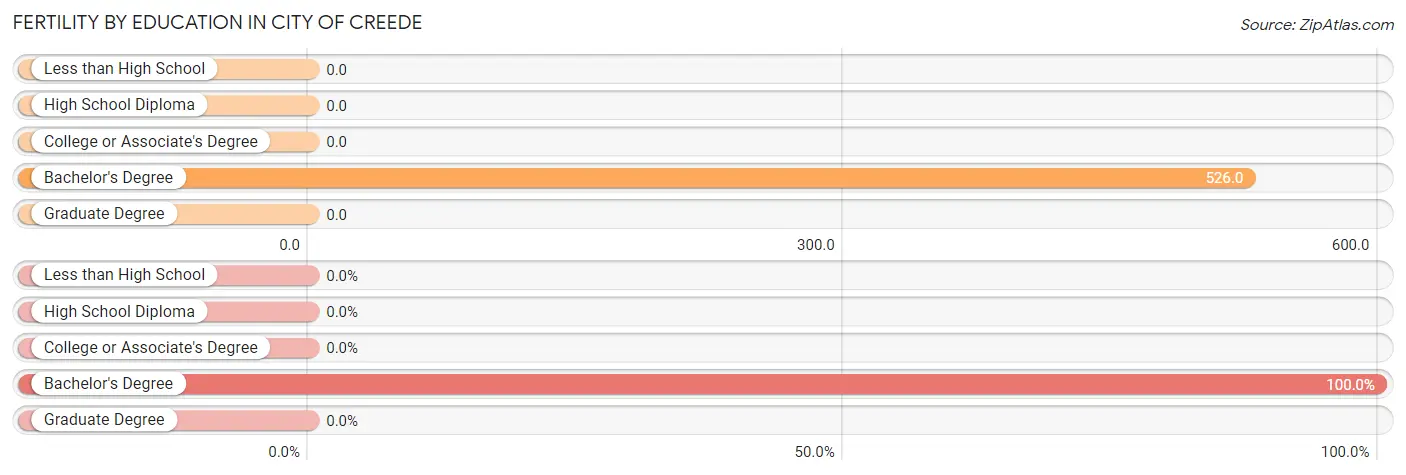
| Educational Attainment | Women with Births | Births / 1,000 Women |
| Less than High School | 0 (0.0%) | 0.0 |
| High School Diploma | 0 (0.0%) | 0.0 |
| College or Associate's Degree | 0 (0.0%) | 0.0 |
| Bachelor's Degree | 10 (100.0%) | 526.0 |
| Graduate Degree | 0 (0.0%) | 0.0 |
| Total | 10 (100.0%) | 125.0 |
Fertility by Education by Marriage Status in City of Creede
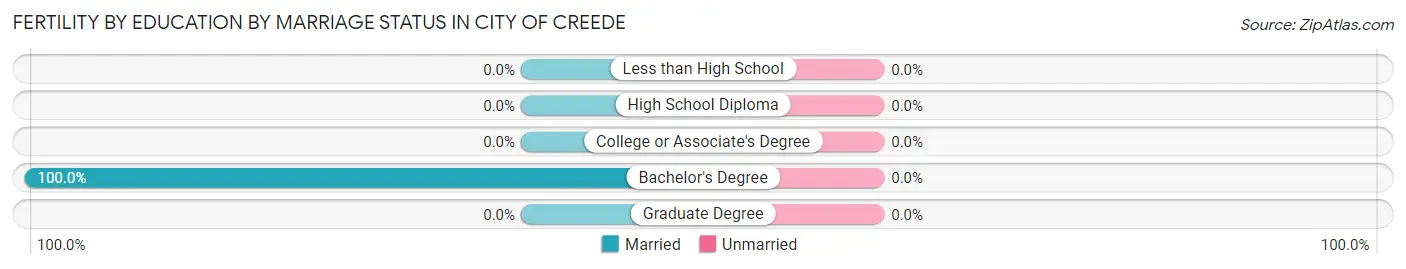
| Educational Attainment | Married | Unmarried |
| Less than High School | 0 (0.0%) | 0 (0.0%) |
| High School Diploma | 0 (0.0%) | 0 (0.0%) |
| College or Associate's Degree | 0 (0.0%) | 0 (0.0%) |
| Bachelor's Degree | 10 (100.0%) | 0 (0.0%) |
| Graduate Degree | 0 (0.0%) | 0 (0.0%) |
| Total | 10 (100.0%) | 0 (0.0%) |
Employment Characteristics in City of Creede
Employment by Class of Employer in City of Creede
Among the 173 employed individuals in City of Creede, private company employees (63 | 36.4%), not-for-profit organizations (48 | 27.8%), and self-employed (not incorporated) (32 | 18.5%) make up the most common classes of employment.
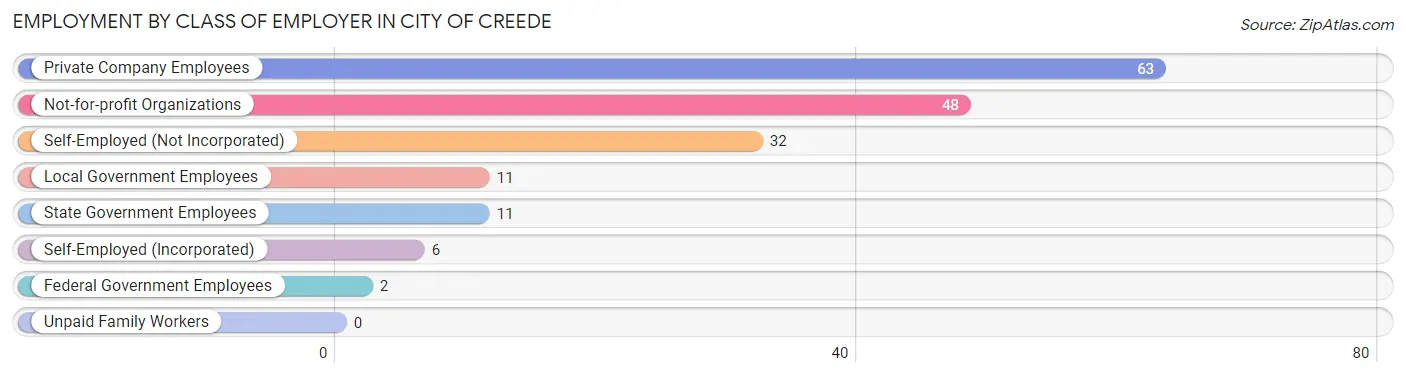
| Employer Class | # Employees | % Employees |
| Private Company Employees | 63 | 36.4% |
| Self-Employed (Incorporated) | 6 | 3.5% |
| Self-Employed (Not Incorporated) | 32 | 18.5% |
| Not-for-profit Organizations | 48 | 27.8% |
| Local Government Employees | 11 | 6.4% |
| State Government Employees | 11 | 6.4% |
| Federal Government Employees | 2 | 1.2% |
| Unpaid Family Workers | 0 | 0.0% |
| Total | 173 | 100.0% |
Employment Status by Age in City of Creede
According to the labor force statistics for City of Creede, out of the total population over 16 years of age (247), 73.3% or 181 individuals are in the labor force, with 4.4% or 8 of them unemployed. The age group with the highest labor force participation rate is 16 to 19 years, with 100.0% or 3 individuals in the labor force. Within the labor force, the 35 to 44 years age range has the highest percentage of unemployed individuals, with 13.0% or 6 of them being unemployed.
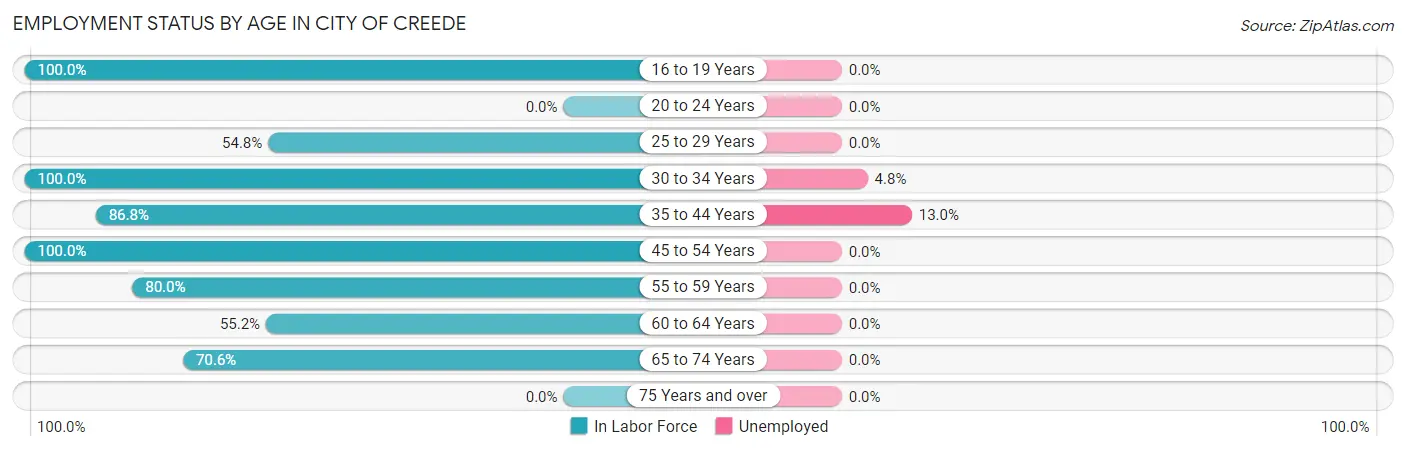
| Age Bracket | In Labor Force | Unemployed |
| 16 to 19 Years | 3 (100.0%) | 0 (0.0%) |
| 20 to 24 Years | 0 (0.0%) | 0 (0.0%) |
| 25 to 29 Years | 23 (54.8%) | 0 (0.0%) |
| 30 to 34 Years | 42 (100.0%) | 2 (4.8%) |
| 35 to 44 Years | 46 (86.8%) | 6 (13.0%) |
| 45 to 54 Years | 19 (100.0%) | 0 (0.0%) |
| 55 to 59 Years | 20 (80.0%) | 0 (0.0%) |
| 60 to 64 Years | 16 (55.2%) | 0 (0.0%) |
| 65 to 74 Years | 12 (70.6%) | 0 (0.0%) |
| 75 Years and over | 0 (0.0%) | 0 (0.0%) |
| Total | 181 (73.3%) | 8 (4.4%) |
Employment Status by Educational Attainment in City of Creede
According to labor force statistics for City of Creede, 79.0% of individuals (166) out of the total population between 25 and 64 years of age (210) are in the labor force, with 4.8% or 8 of them being unemployed. The group with the highest labor force participation rate are those with the educational attainment of college / associate degree, with 100.0% or 52 individuals in the labor force. Within the labor force, individuals with high school diploma education have the highest percentage of unemployment, with 18.2% or 6 of them being unemployed.
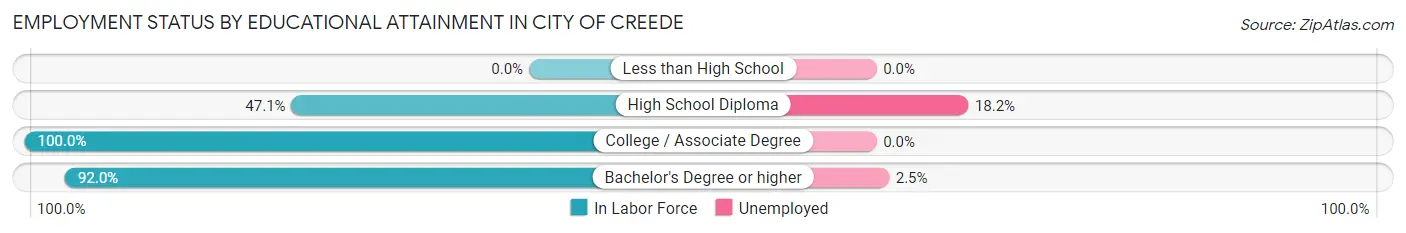
| Educational Attainment | In Labor Force | Unemployed |
| Less than High School | 0 (0.0%) | 0 (0.0%) |
| High School Diploma | 33 (47.1%) | 13 (18.2%) |
| College / Associate Degree | 52 (100.0%) | 0 (0.0%) |
| Bachelor's Degree or higher | 81 (92.0%) | 2 (2.5%) |
| Total | 166 (79.0%) | 10 (4.8%) |
Employment Occupations by Sex in City of Creede
Management, Business, Science and Arts Occupations
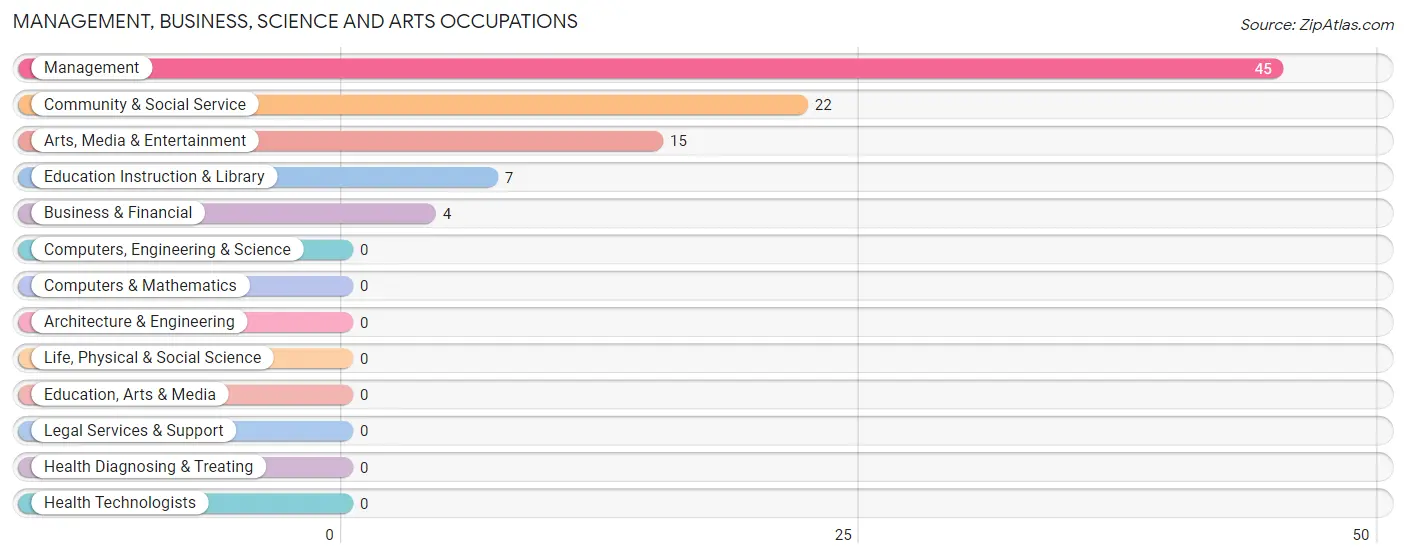
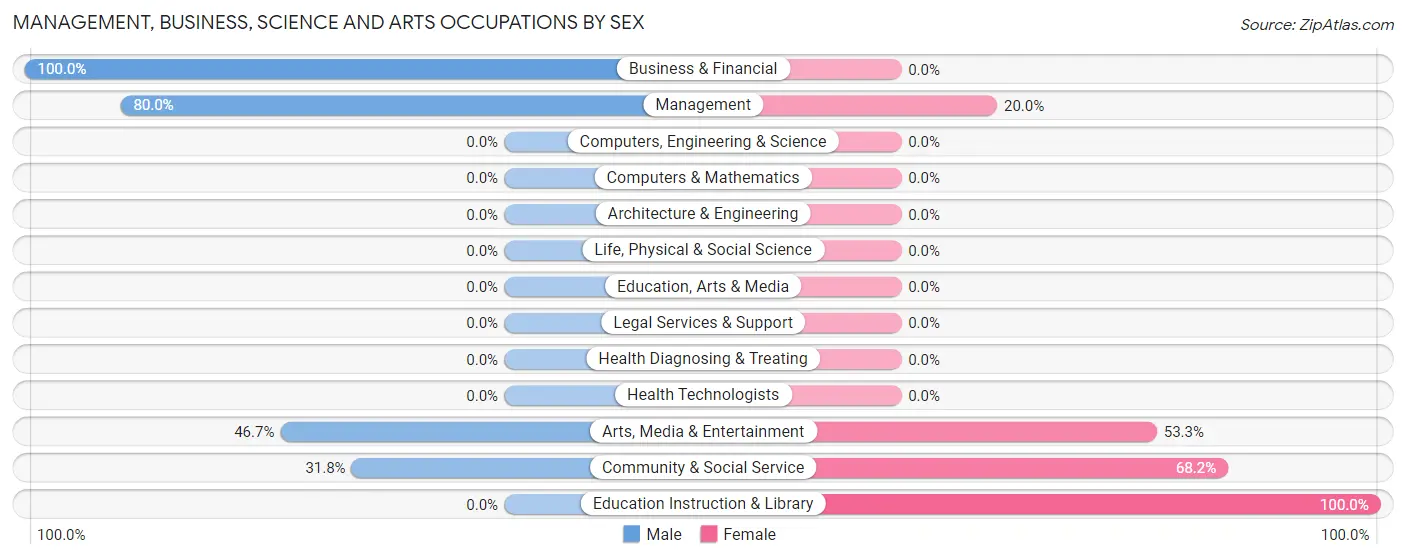
The most common Management, Business, Science and Arts occupations in City of Creede are Management (45 | 26.0%), Community & Social Service (22 | 12.7%), Arts, Media & Entertainment (15 | 8.7%), Education Instruction & Library (7 | 4.1%), and Business & Financial (4 | 2.3%).
Management, Business, Science and Arts Occupations by Sex
Within the Management, Business, Science and Arts occupations in City of Creede, the most male-oriented occupations are Business & Financial (100.0%), Management (80.0%), and Arts, Media & Entertainment (46.7%), while the most female-oriented occupations are Education Instruction & Library (100.0%), Community & Social Service (68.2%), and Arts, Media & Entertainment (53.3%).
| Occupation | Male | Female |
| Management | 36 (80.0%) | 9 (20.0%) |
| Business & Financial | 4 (100.0%) | 0 (0.0%) |
| Computers, Engineering & Science | 0 (0.0%) | 0 (0.0%) |
| Computers & Mathematics | 0 (0.0%) | 0 (0.0%) |
| Architecture & Engineering | 0 (0.0%) | 0 (0.0%) |
| Life, Physical & Social Science | 0 (0.0%) | 0 (0.0%) |
| Community & Social Service | 7 (31.8%) | 15 (68.2%) |
| Education, Arts & Media | 0 (0.0%) | 0 (0.0%) |
| Legal Services & Support | 0 (0.0%) | 0 (0.0%) |
| Education Instruction & Library | 0 (0.0%) | 7 (100.0%) |
| Arts, Media & Entertainment | 7 (46.7%) | 8 (53.3%) |
| Health Diagnosing & Treating | 0 (0.0%) | 0 (0.0%) |
| Health Technologists | 0 (0.0%) | 0 (0.0%) |
| Total (Category) | 47 (66.2%) | 24 (33.8%) |
| Total (Overall) | 94 (54.3%) | 79 (45.7%) |
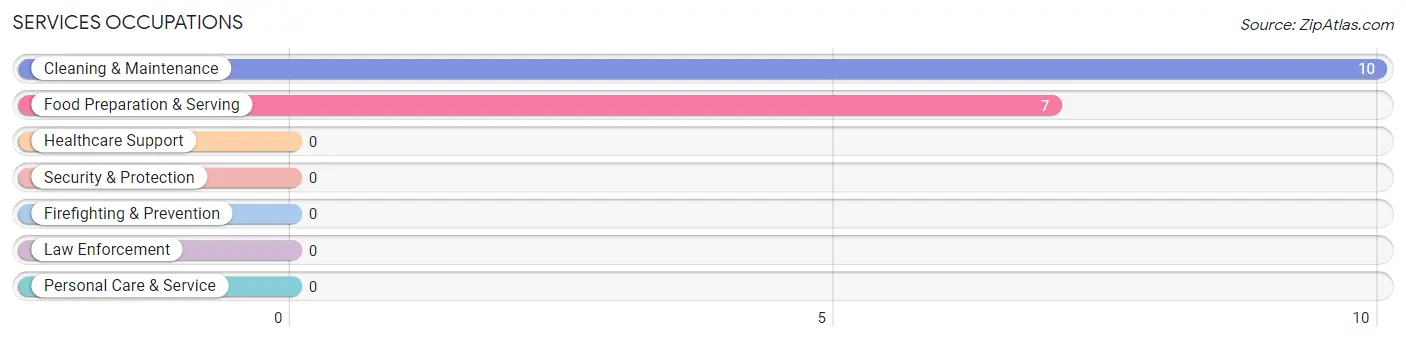
Services Occupations
The most common Services occupations in City of Creede are Cleaning & Maintenance (10 | 5.8%), and Food Preparation & Serving (7 | 4.1%).
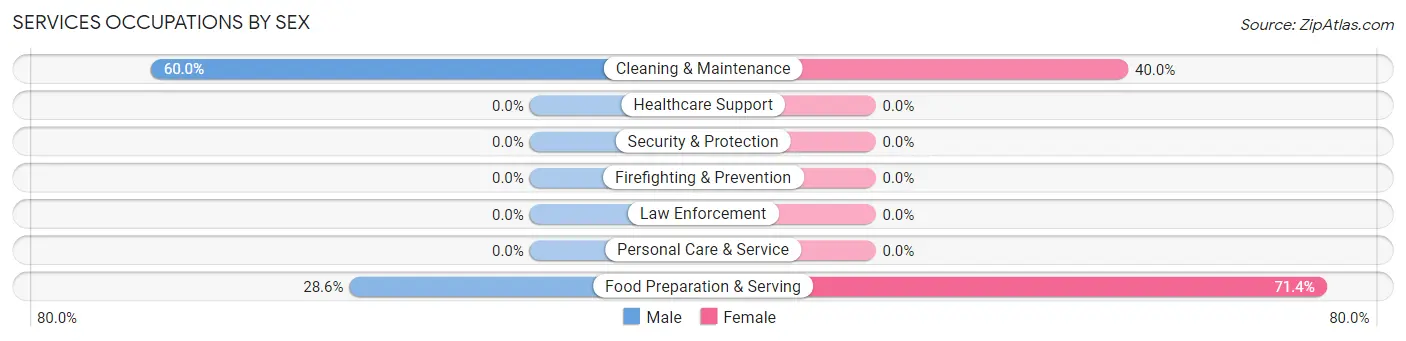
Services Occupations by Sex
Within the Services occupations in City of Creede, the most male-oriented occupations are Cleaning & Maintenance (60.0%), and Food Preparation & Serving (28.6%), while the most female-oriented occupations are Food Preparation & Serving (71.4%), and Cleaning & Maintenance (40.0%).
| Occupation | Male | Female |
| Healthcare Support | 0 (0.0%) | 0 (0.0%) |
| Security & Protection | 0 (0.0%) | 0 (0.0%) |
| Firefighting & Prevention | 0 (0.0%) | 0 (0.0%) |
| Law Enforcement | 0 (0.0%) | 0 (0.0%) |
| Food Preparation & Serving | 2 (28.6%) | 5 (71.4%) |
| Cleaning & Maintenance | 6 (60.0%) | 4 (40.0%) |
| Personal Care & Service | 0 (0.0%) | 0 (0.0%) |
| Total (Category) | 8 (47.1%) | 9 (52.9%) |
| Total (Overall) | 94 (54.3%) | 79 (45.7%) |
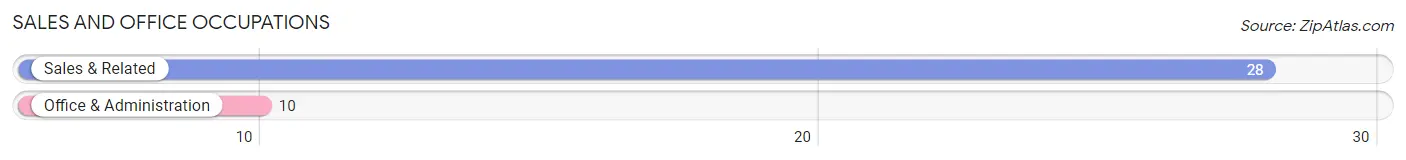
Sales and Office Occupations
The most common Sales and Office occupations in City of Creede are Sales & Related (28 | 16.2%), and Office & Administration (10 | 5.8%).
Sales and Office Occupations by Sex
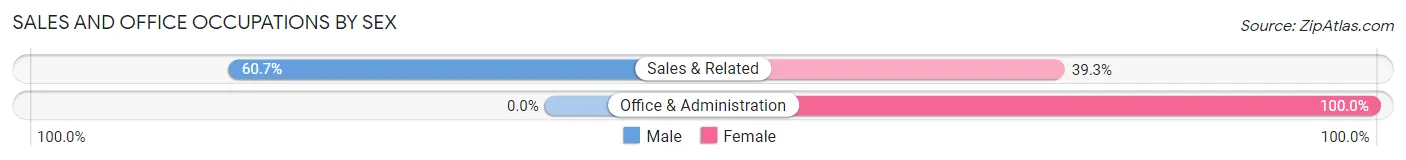
| Occupation | Male | Female |
| Sales & Related | 17 (60.7%) | 11 (39.3%) |
| Office & Administration | 0 (0.0%) | 10 (100.0%) |
| Total (Category) | 17 (44.7%) | 21 (55.3%) |
| Total (Overall) | 94 (54.3%) | 79 (45.7%) |
Natural Resources, Construction and Maintenance Occupations
The most common Natural Resources, Construction and Maintenance occupations in City of Creede are Installation, Maintenance & Repair (23 | 13.3%), and Construction & Extraction (22 | 12.7%).
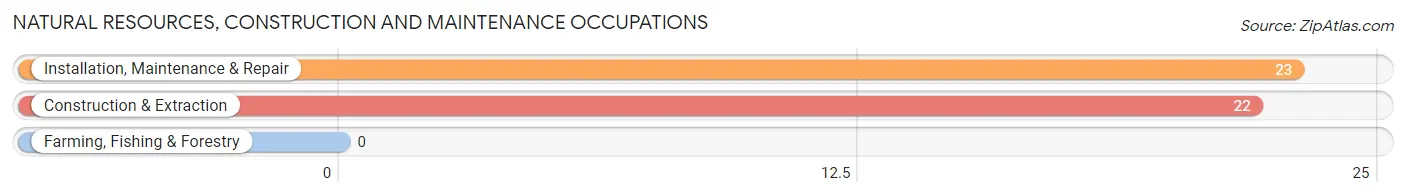
Natural Resources, Construction and Maintenance Occupations by Sex

| Occupation | Male | Female |
| Farming, Fishing & Forestry | 0 (0.0%) | 0 (0.0%) |
| Construction & Extraction | 22 (100.0%) | 0 (0.0%) |
| Installation, Maintenance & Repair | 0 (0.0%) | 23 (100.0%) |
| Total (Category) | 22 (48.9%) | 23 (51.1%) |
| Total (Overall) | 94 (54.3%) | 79 (45.7%) |
Production, Transportation and Moving Occupations
The most common Production, Transportation and Moving occupations in City of Creede are , and Material Moving (2 | 1.2%).
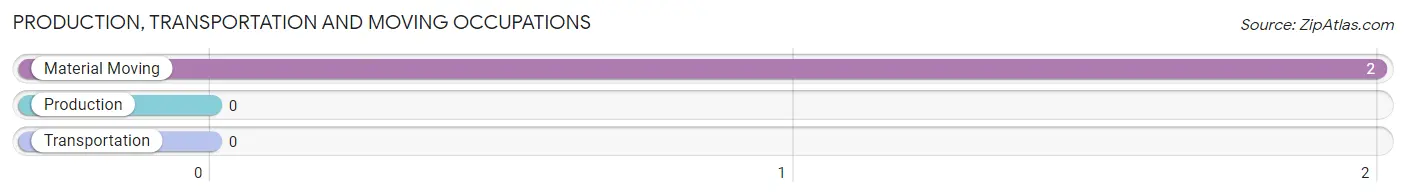
Production, Transportation and Moving Occupations by Sex
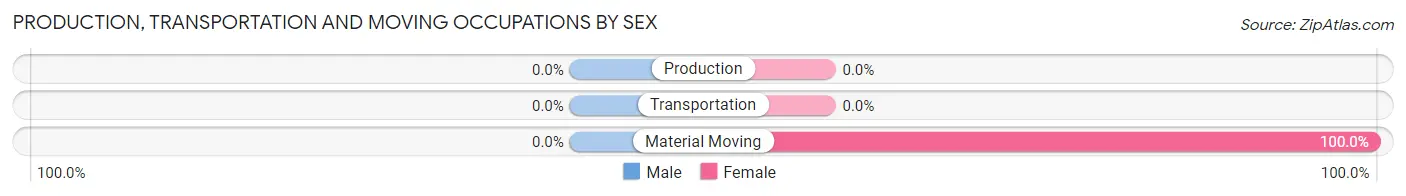
| Occupation | Male | Female |
| Production | 0 (0.0%) | 0 (0.0%) |
| Transportation | 0 (0.0%) | 0 (0.0%) |
| Material Moving | 0 (0.0%) | 2 (100.0%) |
| Total (Category) | 0 (0.0%) | 2 (100.0%) |
| Total (Overall) | 94 (54.3%) | 79 (45.7%) |
Employment Industries by Sex in City of Creede
Employment Industries in City of Creede
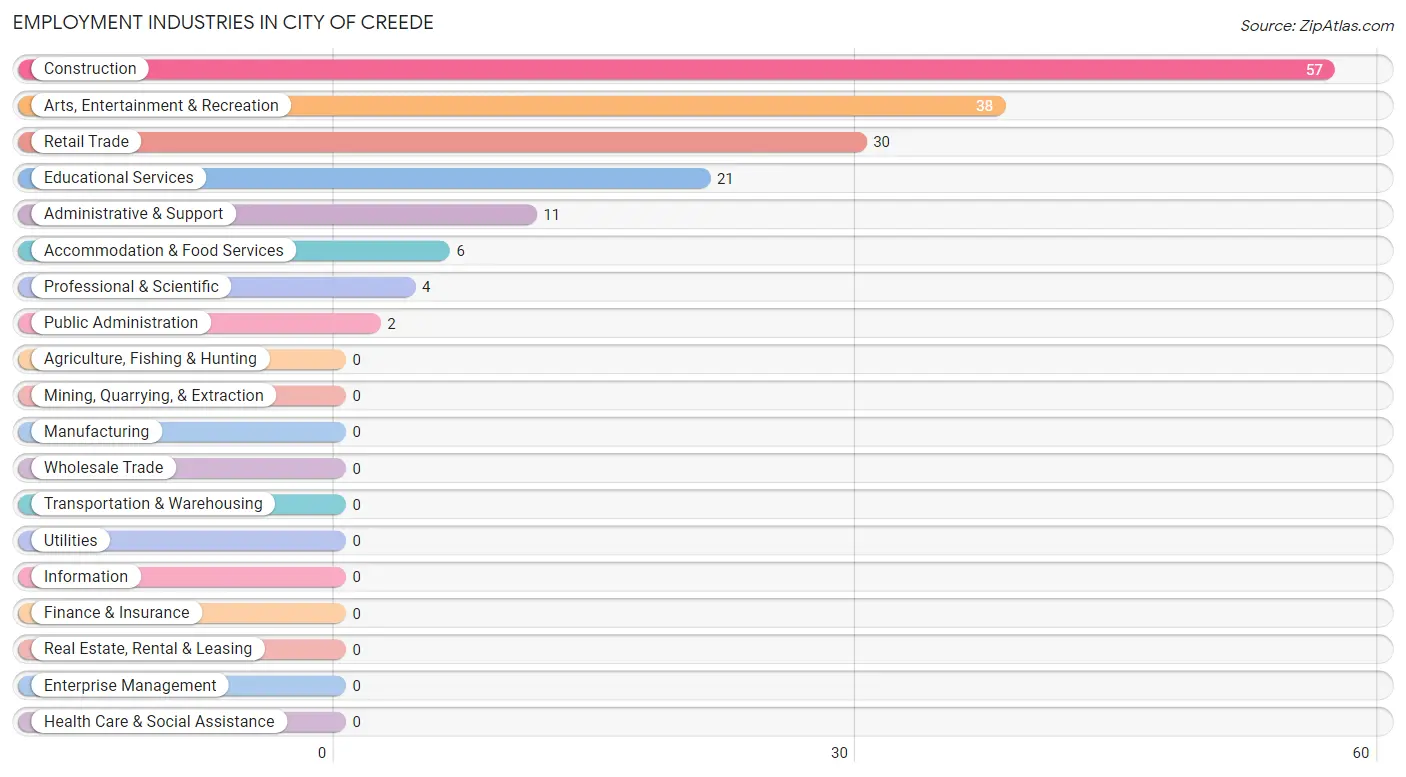
The major employment industries in City of Creede include Construction (57 | 33.0%), Arts, Entertainment & Recreation (38 | 22.0%), Retail Trade (30 | 17.3%), Educational Services (21 | 12.1%), and Administrative & Support (11 | 6.4%).
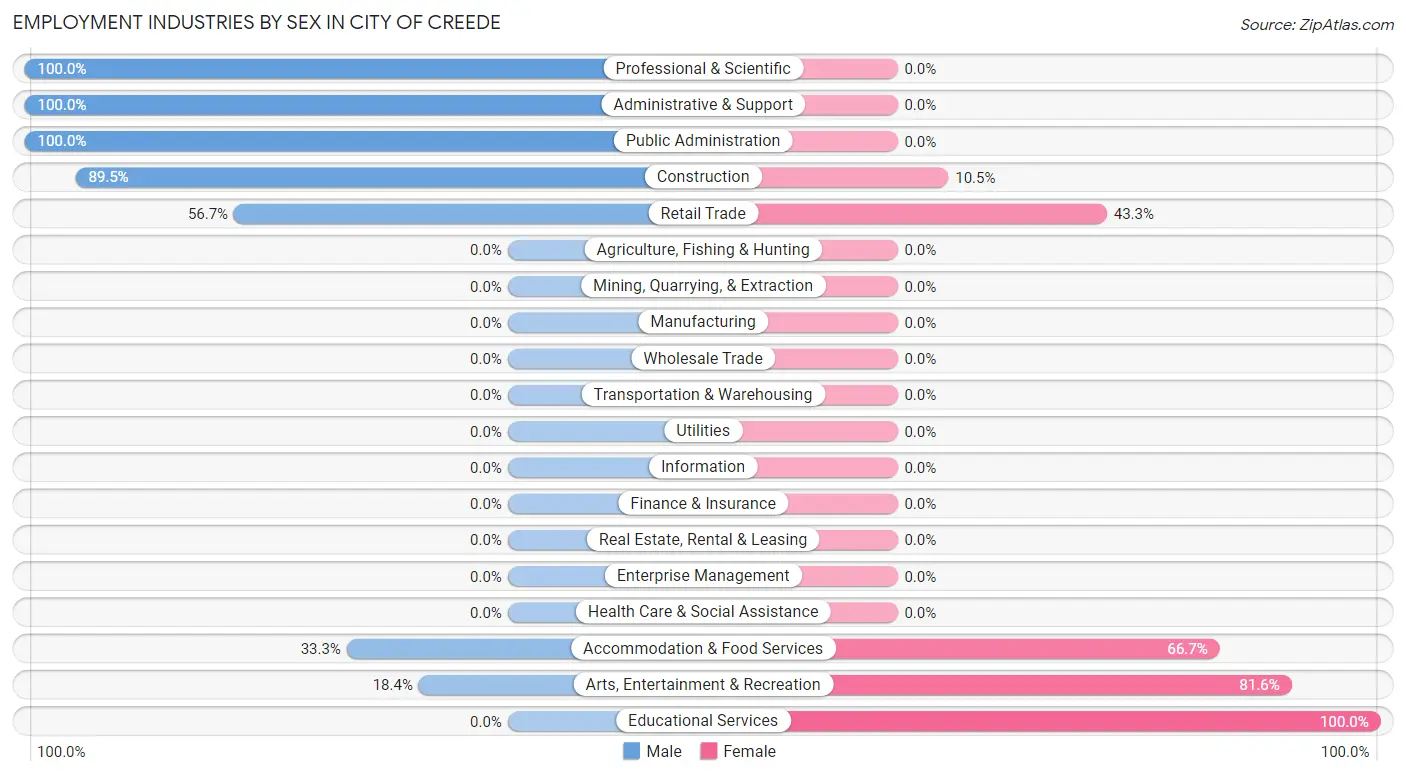
Employment Industries by Sex in City of Creede
The City of Creede industries that see more men than women are Professional & Scientific (100.0%), Administrative & Support (100.0%), and Public Administration (100.0%), whereas the industries that tend to have a higher number of women are Educational Services (100.0%), Arts, Entertainment & Recreation (81.6%), and Accommodation & Food Services (66.7%).
| Industry | Male | Female |
| Agriculture, Fishing & Hunting | 0 (0.0%) | 0 (0.0%) |
| Mining, Quarrying, & Extraction | 0 (0.0%) | 0 (0.0%) |
| Construction | 51 (89.5%) | 6 (10.5%) |
| Manufacturing | 0 (0.0%) | 0 (0.0%) |
| Wholesale Trade | 0 (0.0%) | 0 (0.0%) |
| Retail Trade | 17 (56.7%) | 13 (43.3%) |
| Transportation & Warehousing | 0 (0.0%) | 0 (0.0%) |
| Utilities | 0 (0.0%) | 0 (0.0%) |
| Information | 0 (0.0%) | 0 (0.0%) |
| Finance & Insurance | 0 (0.0%) | 0 (0.0%) |
| Real Estate, Rental & Leasing | 0 (0.0%) | 0 (0.0%) |
| Professional & Scientific | 4 (100.0%) | 0 (0.0%) |
| Enterprise Management | 0 (0.0%) | 0 (0.0%) |
| Administrative & Support | 11 (100.0%) | 0 (0.0%) |
| Educational Services | 0 (0.0%) | 21 (100.0%) |
| Health Care & Social Assistance | 0 (0.0%) | 0 (0.0%) |
| Arts, Entertainment & Recreation | 7 (18.4%) | 31 (81.6%) |
| Accommodation & Food Services | 2 (33.3%) | 4 (66.7%) |
| Public Administration | 2 (100.0%) | 0 (0.0%) |
| Total | 94 (54.3%) | 79 (45.7%) |
Education in City of Creede
School Enrollment in City of Creede
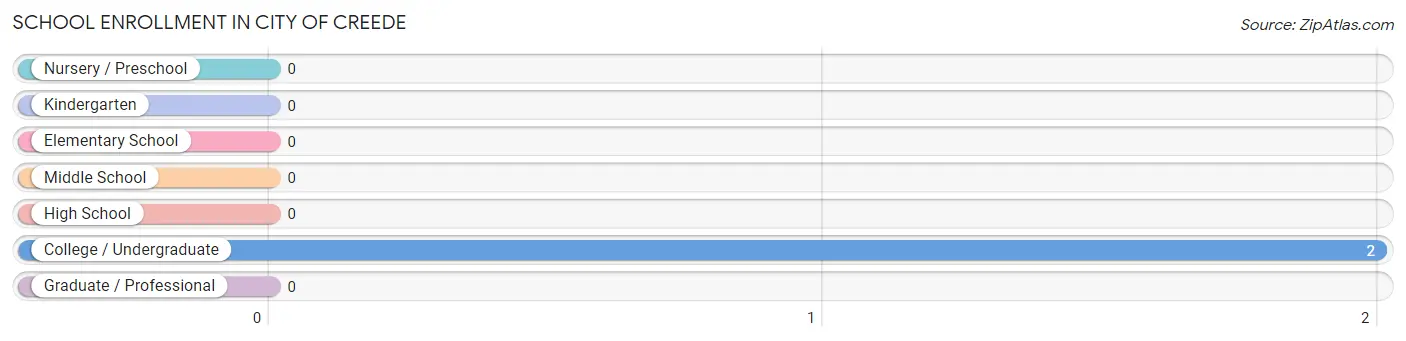
| School Level | # Students | % Students |
| Nursery / Preschool | 0 | 0.0% |
| Kindergarten | 0 | 0.0% |
| Elementary School | 0 | 0.0% |
| Middle School | 0 | 0.0% |
| High School | 0 | 0.0% |
| College / Undergraduate | 2 | 100.0% |
| Graduate / Professional | 0 | 0.0% |
| Total | 2 | 100.0% |
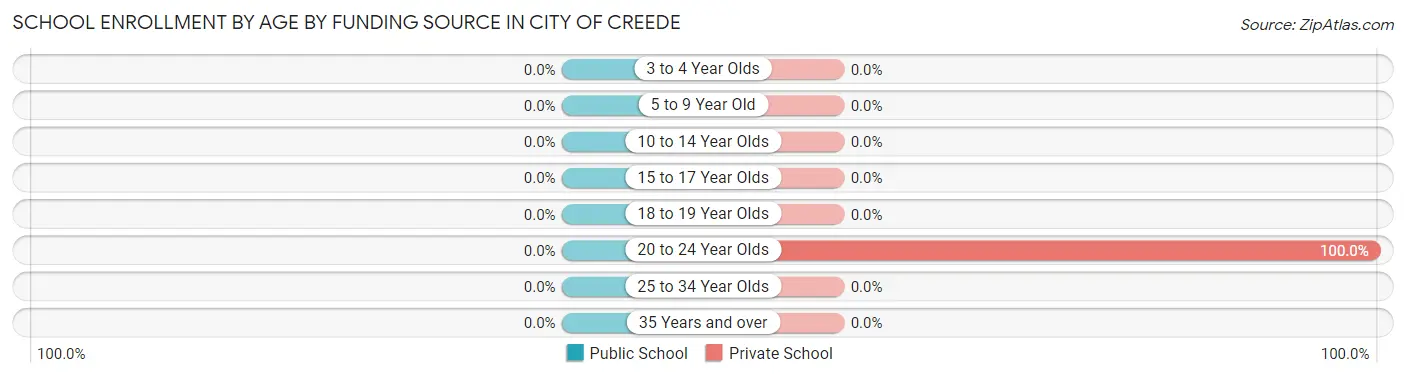
School Enrollment by Age by Funding Source in City of Creede
| Age Bracket | Public School | Private School |
| 3 to 4 Year Olds | 0 (0.0%) | 0 (0.0%) |
| 5 to 9 Year Old | 0 (0.0%) | 0 (0.0%) |
| 10 to 14 Year Olds | 0 (0.0%) | 0 (0.0%) |
| 15 to 17 Year Olds | 0 (0.0%) | 0 (0.0%) |
| 18 to 19 Year Olds | 0 (0.0%) | 0 (0.0%) |
| 20 to 24 Year Olds | 0 (0.0%) | 2 (100.0%) |
| 25 to 34 Year Olds | 0 (0.0%) | 0 (0.0%) |
| 35 Years and over | 0 (0.0%) | 0 (0.0%) |
| Total | 0 (0.0%) | 2 (100.0%) |
Educational Attainment by Field of Study in City of Creede
Liberal arts & history (25 | 19.4%), social sciences (23 | 17.8%), bio, nature & agricultural (22 | 17.1%), business (22 | 17.1%), and visual & performing arts (22 | 17.1%) are the most common fields of study among 129 individuals in City of Creede who have obtained a bachelor's degree or higher.
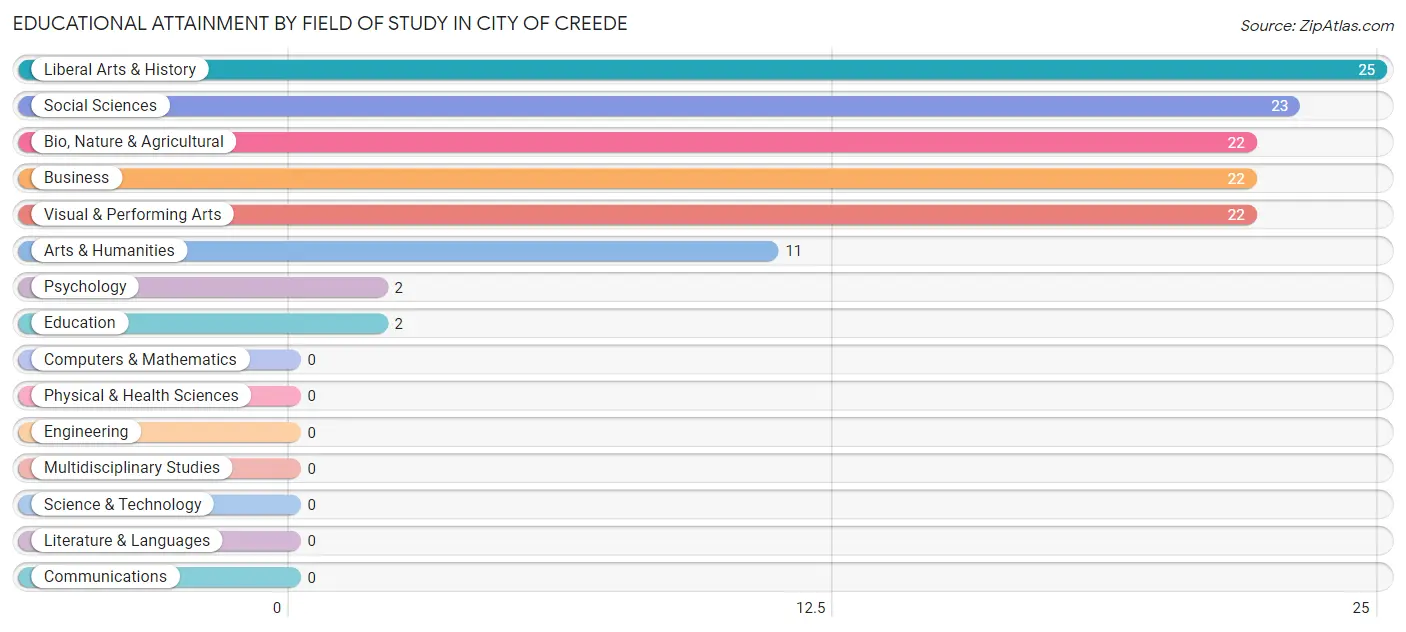
| Field of Study | # Graduates | % Graduates |
| Computers & Mathematics | 0 | 0.0% |
| Bio, Nature & Agricultural | 22 | 17.1% |
| Physical & Health Sciences | 0 | 0.0% |
| Psychology | 2 | 1.5% |
| Social Sciences | 23 | 17.8% |
| Engineering | 0 | 0.0% |
| Multidisciplinary Studies | 0 | 0.0% |
| Science & Technology | 0 | 0.0% |
| Business | 22 | 17.1% |
| Education | 2 | 1.5% |
| Literature & Languages | 0 | 0.0% |
| Liberal Arts & History | 25 | 19.4% |
| Visual & Performing Arts | 22 | 17.1% |
| Communications | 0 | 0.0% |
| Arts & Humanities | 11 | 8.5% |
| Total | 129 | 100.0% |
Transportation & Commute in City of Creede
Vehicle Availability by Sex in City of Creede
The most prevalent vehicle ownership categories in City of Creede are males with 2 vehicles (66, accounting for 73.3%) and females with 2 vehicles (52, making up 86.8%).
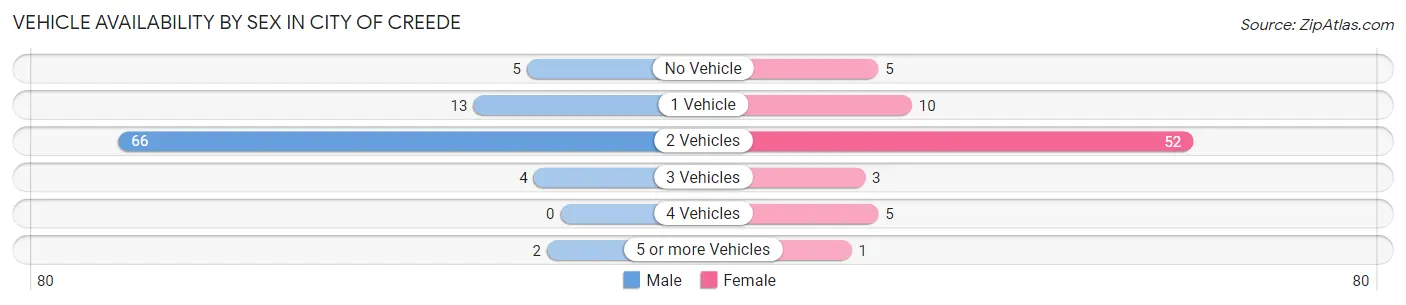
| Vehicles Available | Male | Female |
| No Vehicle | 5 (5.6%) | 5 (6.6%) |
| 1 Vehicle | 13 (14.4%) | 10 (13.2%) |
| 2 Vehicles | 66 (73.3%) | 52 (68.4%) |
| 3 Vehicles | 4 (4.4%) | 3 (4.0%) |
| 4 Vehicles | 0 (0.0%) | 5 (6.6%) |
| 5 or more Vehicles | 2 (2.2%) | 1 (1.3%) |
| Total | 90 (100.0%) | 76 (100.0%) |
Commute Time in City of Creede
The most frequently occuring commute durations in City of Creede are less than 5 minutes (52 commuters, 30.6%), 5 to 9 minutes (43 commuters, 25.3%), and 10 to 14 minutes (33 commuters, 19.4%).
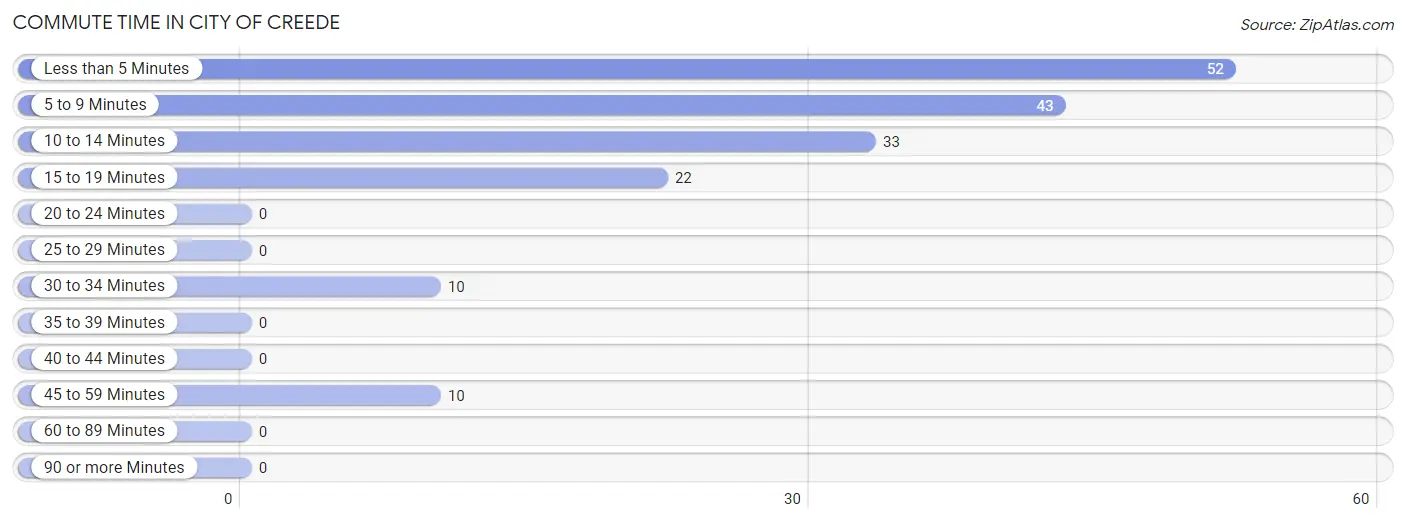
| Commute Time | # Commuters | % Commuters |
| Less than 5 Minutes | 52 | 30.6% |
| 5 to 9 Minutes | 43 | 25.3% |
| 10 to 14 Minutes | 33 | 19.4% |
| 15 to 19 Minutes | 22 | 12.9% |
| 20 to 24 Minutes | 0 | 0.0% |
| 25 to 29 Minutes | 0 | 0.0% |
| 30 to 34 Minutes | 10 | 5.9% |
| 35 to 39 Minutes | 0 | 0.0% |
| 40 to 44 Minutes | 0 | 0.0% |
| 45 to 59 Minutes | 10 | 5.9% |
| 60 to 89 Minutes | 0 | 0.0% |
| 90 or more Minutes | 0 | 0.0% |
Commute Time by Sex in City of Creede
The most common commute times in City of Creede are 5 to 9 minutes (29 commuters, 31.5%) for males and less than 5 minutes (36 commuters, 46.2%) for females.
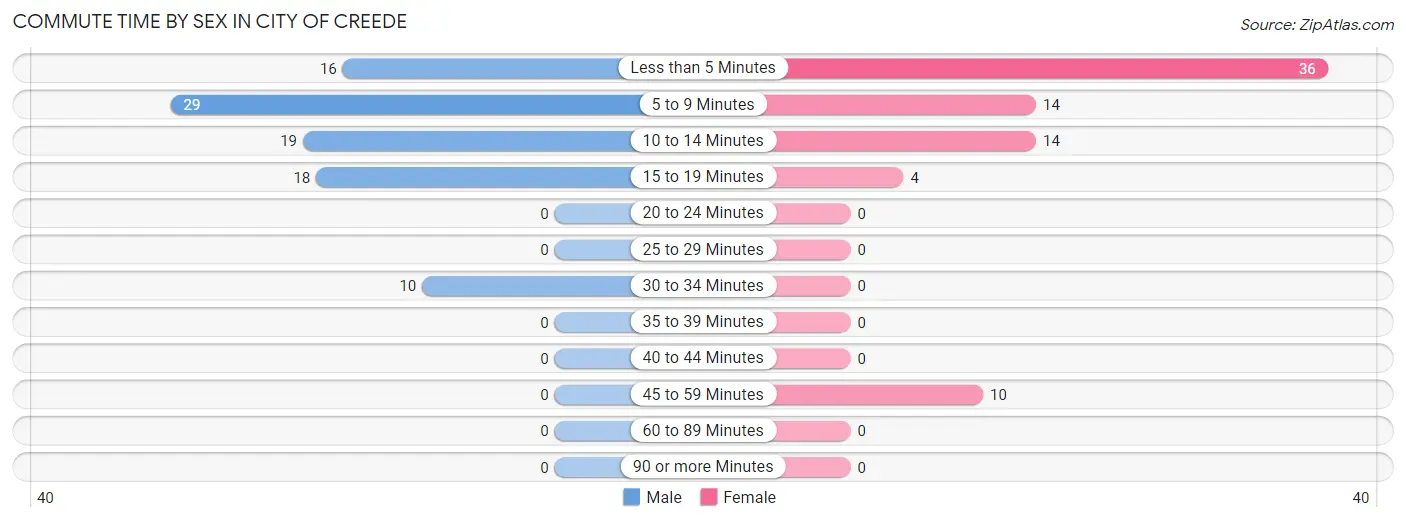
| Commute Time | Male | Female |
| Less than 5 Minutes | 16 (17.4%) | 36 (46.2%) |
| 5 to 9 Minutes | 29 (31.5%) | 14 (17.9%) |
| 10 to 14 Minutes | 19 (20.6%) | 14 (17.9%) |
| 15 to 19 Minutes | 18 (19.6%) | 4 (5.1%) |
| 20 to 24 Minutes | 0 (0.0%) | 0 (0.0%) |
| 25 to 29 Minutes | 0 (0.0%) | 0 (0.0%) |
| 30 to 34 Minutes | 10 (10.9%) | 0 (0.0%) |
| 35 to 39 Minutes | 0 (0.0%) | 0 (0.0%) |
| 40 to 44 Minutes | 0 (0.0%) | 0 (0.0%) |
| 45 to 59 Minutes | 0 (0.0%) | 10 (12.8%) |
| 60 to 89 Minutes | 0 (0.0%) | 0 (0.0%) |
| 90 or more Minutes | 0 (0.0%) | 0 (0.0%) |
Time of Departure to Work by Sex in City of Creede
The most frequent times of departure to work in City of Creede are 7:30 AM to 7:59 AM (30, 32.6%) for males and 9:00 AM to 9:59 AM (47, 60.3%) for females.
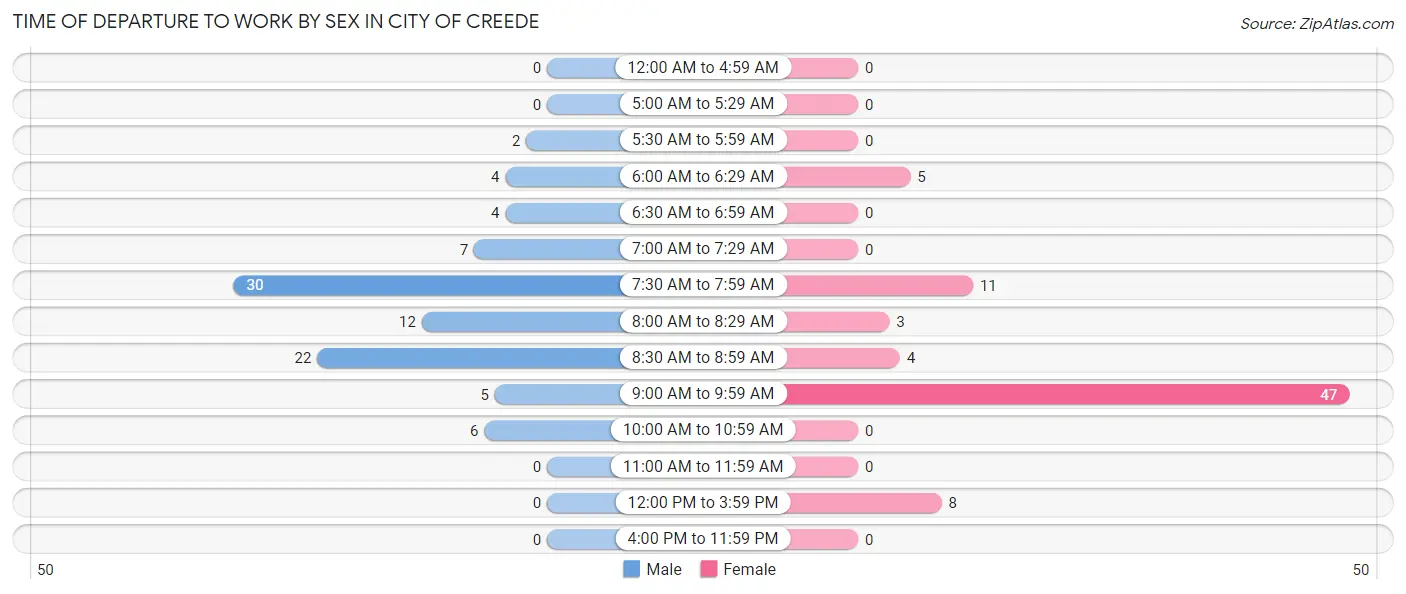
| Time of Departure | Male | Female |
| 12:00 AM to 4:59 AM | 0 (0.0%) | 0 (0.0%) |
| 5:00 AM to 5:29 AM | 0 (0.0%) | 0 (0.0%) |
| 5:30 AM to 5:59 AM | 2 (2.2%) | 0 (0.0%) |
| 6:00 AM to 6:29 AM | 4 (4.3%) | 5 (6.4%) |
| 6:30 AM to 6:59 AM | 4 (4.3%) | 0 (0.0%) |
| 7:00 AM to 7:29 AM | 7 (7.6%) | 0 (0.0%) |
| 7:30 AM to 7:59 AM | 30 (32.6%) | 11 (14.1%) |
| 8:00 AM to 8:29 AM | 12 (13.0%) | 3 (3.8%) |
| 8:30 AM to 8:59 AM | 22 (23.9%) | 4 (5.1%) |
| 9:00 AM to 9:59 AM | 5 (5.4%) | 47 (60.3%) |
| 10:00 AM to 10:59 AM | 6 (6.5%) | 0 (0.0%) |
| 11:00 AM to 11:59 AM | 0 (0.0%) | 0 (0.0%) |
| 12:00 PM to 3:59 PM | 0 (0.0%) | 8 (10.3%) |
| 4:00 PM to 11:59 PM | 0 (0.0%) | 0 (0.0%) |
| Total | 92 (100.0%) | 78 (100.0%) |
Housing Occupancy in City of Creede
Occupancy by Ownership in City of Creede
Of the total 169 dwellings in City of Creede, owner-occupied units account for 73 (43.2%), while renter-occupied units make up 96 (56.8%).
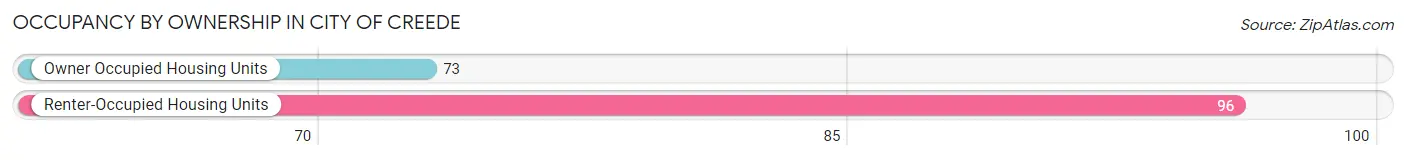
| Occupancy | # Housing Units | % Housing Units |
| Owner Occupied Housing Units | 73 | 43.2% |
| Renter-Occupied Housing Units | 96 | 56.8% |
| Total Occupied Housing Units | 169 | 100.0% |
Occupancy by Household Size in City of Creede
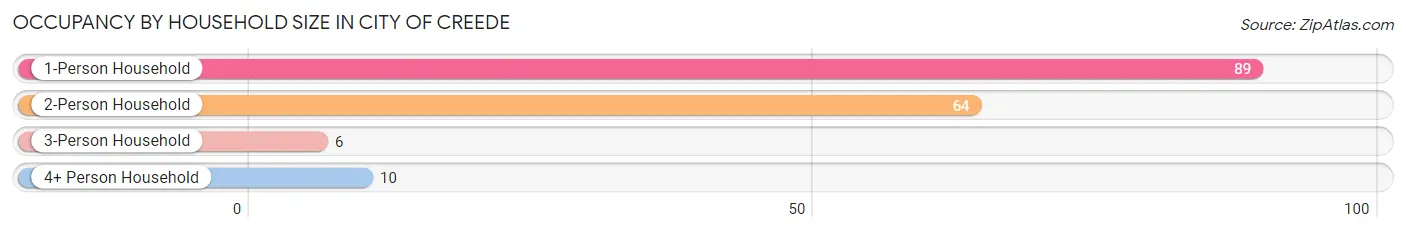
| Household Size | # Housing Units | % Housing Units |
| 1-Person Household | 89 | 52.7% |
| 2-Person Household | 64 | 37.9% |
| 3-Person Household | 6 | 3.5% |
| 4+ Person Household | 10 | 5.9% |
| Total Housing Units | 169 | 100.0% |
Occupancy by Ownership by Household Size in City of Creede
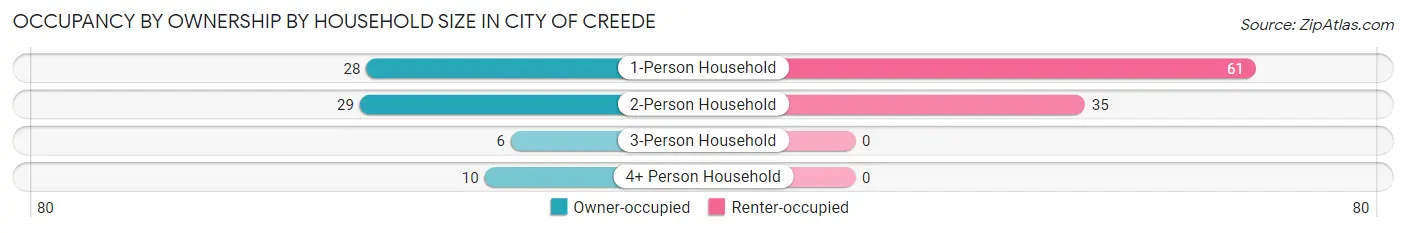
| Household Size | Owner-occupied | Renter-occupied |
| 1-Person Household | 28 (31.5%) | 61 (68.5%) |
| 2-Person Household | 29 (45.3%) | 35 (54.7%) |
| 3-Person Household | 6 (100.0%) | 0 (0.0%) |
| 4+ Person Household | 10 (100.0%) | 0 (0.0%) |
| Total Housing Units | 73 (43.2%) | 96 (56.8%) |
Occupancy by Educational Attainment in City of Creede
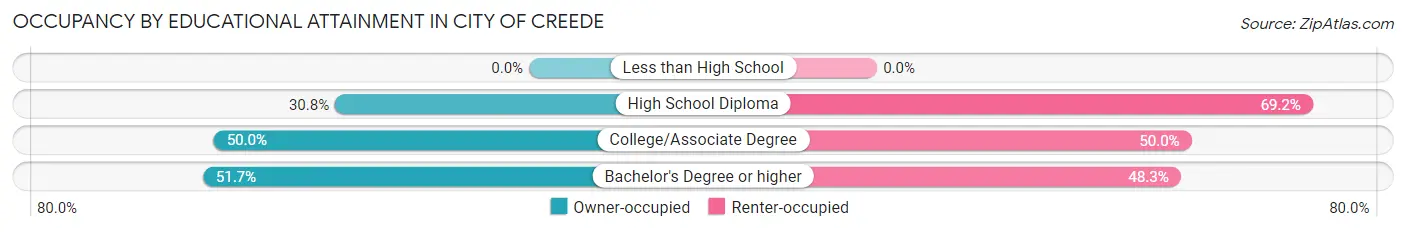
| Household Size | Owner-occupied | Renter-occupied |
| Less than High School | 0 (0.0%) | 0 (0.0%) |
| High School Diploma | 20 (30.8%) | 45 (69.2%) |
| College/Associate Degree | 23 (50.0%) | 23 (50.0%) |
| Bachelor's Degree or higher | 30 (51.7%) | 28 (48.3%) |
Occupancy by Age of Householder in City of Creede
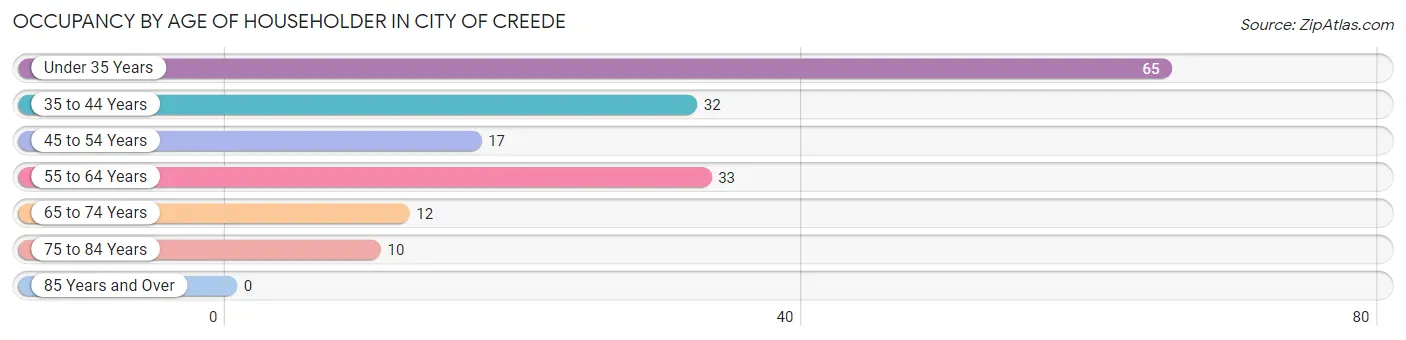
| Age Bracket | # Households | % Households |
| Under 35 Years | 65 | 38.5% |
| 35 to 44 Years | 32 | 18.9% |
| 45 to 54 Years | 17 | 10.1% |
| 55 to 64 Years | 33 | 19.5% |
| 65 to 74 Years | 12 | 7.1% |
| 75 to 84 Years | 10 | 5.9% |
| 85 Years and Over | 0 | 0.0% |
| Total | 169 | 100.0% |
Housing Finances in City of Creede
Median Income by Occupancy in City of Creede
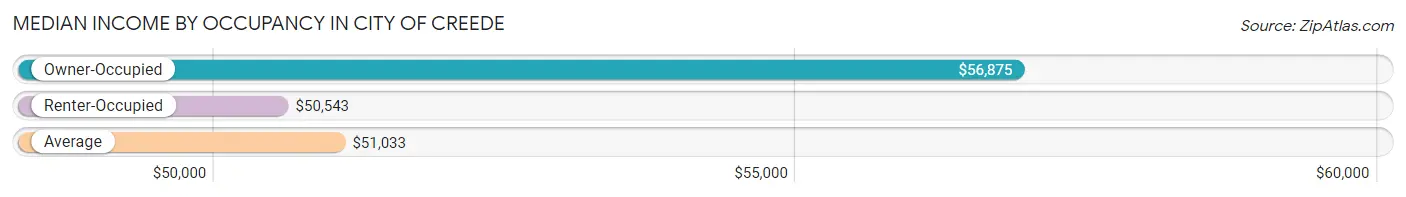
| Occupancy Type | # Households | Median Income |
| Owner-Occupied | 73 (43.2%) | $56,875 |
| Renter-Occupied | 96 (56.8%) | $50,543 |
| Average | 169 (100.0%) | $51,033 |
Occupancy by Householder Income Bracket in City of Creede
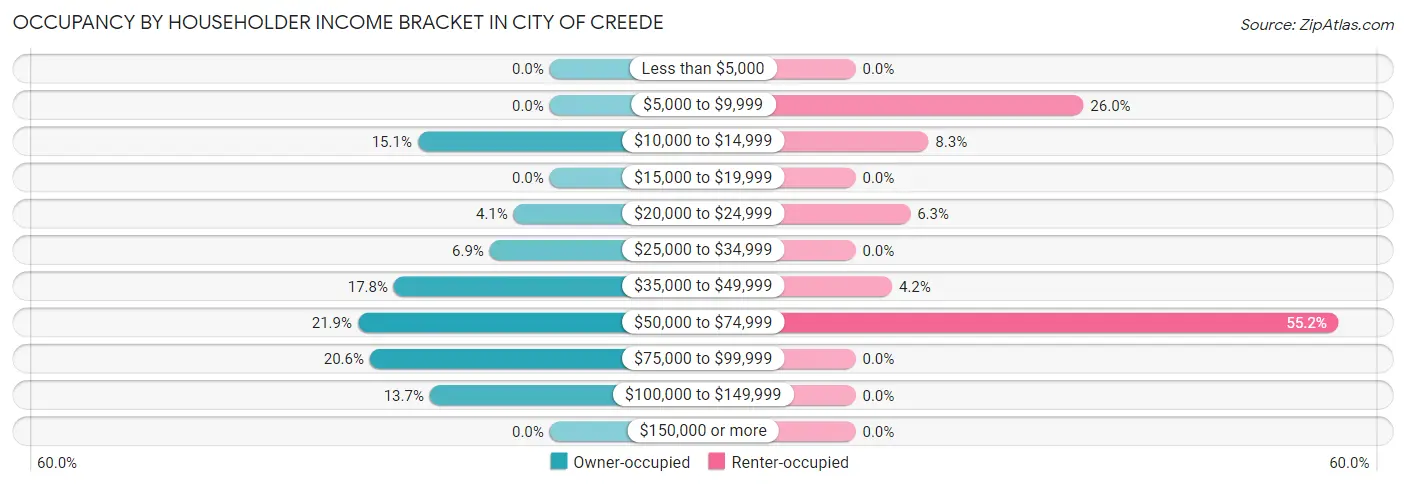
| Income Bracket | Owner-occupied | Renter-occupied |
| Less than $5,000 | 0 (0.0%) | 0 (0.0%) |
| $5,000 to $9,999 | 0 (0.0%) | 25 (26.0%) |
| $10,000 to $14,999 | 11 (15.1%) | 8 (8.3%) |
| $15,000 to $19,999 | 0 (0.0%) | 0 (0.0%) |
| $20,000 to $24,999 | 3 (4.1%) | 6 (6.2%) |
| $25,000 to $34,999 | 5 (6.9%) | 0 (0.0%) |
| $35,000 to $49,999 | 13 (17.8%) | 4 (4.2%) |
| $50,000 to $74,999 | 16 (21.9%) | 53 (55.2%) |
| $75,000 to $99,999 | 15 (20.5%) | 0 (0.0%) |
| $100,000 to $149,999 | 10 (13.7%) | 0 (0.0%) |
| $150,000 or more | 0 (0.0%) | 0 (0.0%) |
| Total | 73 (100.0%) | 96 (100.0%) |
Monthly Housing Cost Tiers in City of Creede
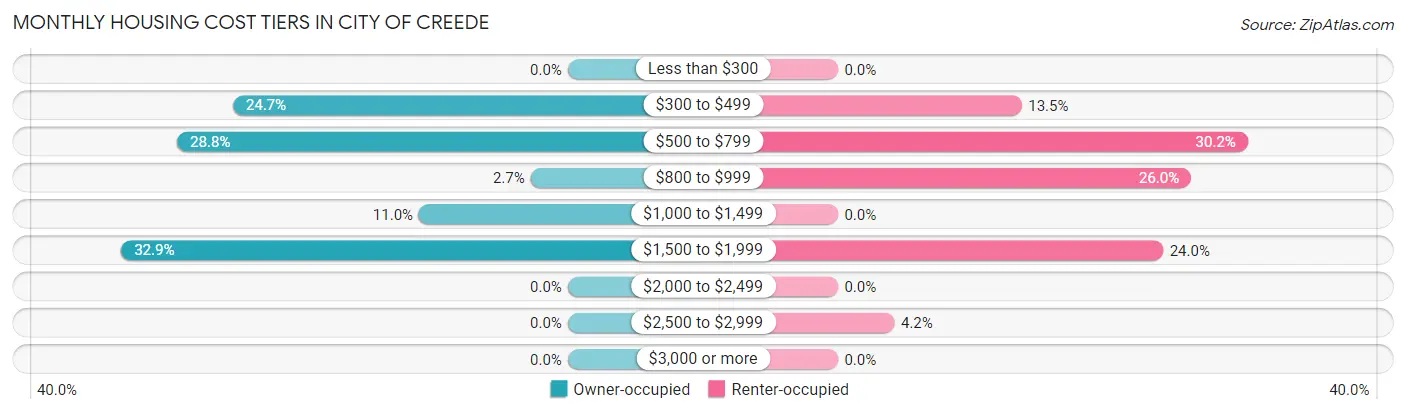
| Monthly Cost | Owner-occupied | Renter-occupied |
| Less than $300 | 0 (0.0%) | 0 (0.0%) |
| $300 to $499 | 18 (24.7%) | 13 (13.5%) |
| $500 to $799 | 21 (28.8%) | 29 (30.2%) |
| $800 to $999 | 2 (2.7%) | 25 (26.0%) |
| $1,000 to $1,499 | 8 (11.0%) | 0 (0.0%) |
| $1,500 to $1,999 | 24 (32.9%) | 23 (24.0%) |
| $2,000 to $2,499 | 0 (0.0%) | 0 (0.0%) |
| $2,500 to $2,999 | 0 (0.0%) | 4 (4.2%) |
| $3,000 or more | 0 (0.0%) | 0 (0.0%) |
| Total | 73 (100.0%) | 96 (100.0%) |
Physical Housing Characteristics in City of Creede
Housing Structures in City of Creede
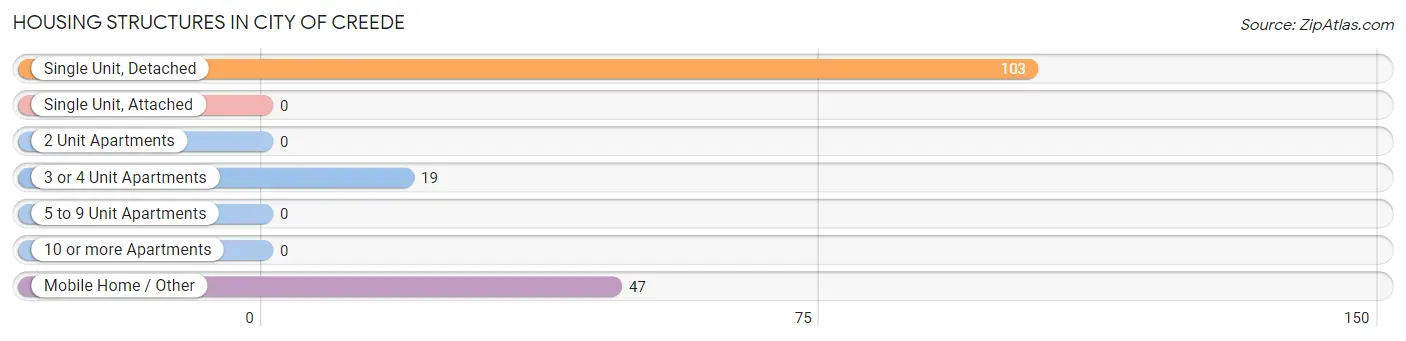
| Structure Type | # Housing Units | % Housing Units |
| Single Unit, Detached | 103 | 61.0% |
| Single Unit, Attached | 0 | 0.0% |
| 2 Unit Apartments | 0 | 0.0% |
| 3 or 4 Unit Apartments | 19 | 11.2% |
| 5 to 9 Unit Apartments | 0 | 0.0% |
| 10 or more Apartments | 0 | 0.0% |
| Mobile Home / Other | 47 | 27.8% |
| Total | 169 | 100.0% |
Housing Structures by Occupancy in City of Creede
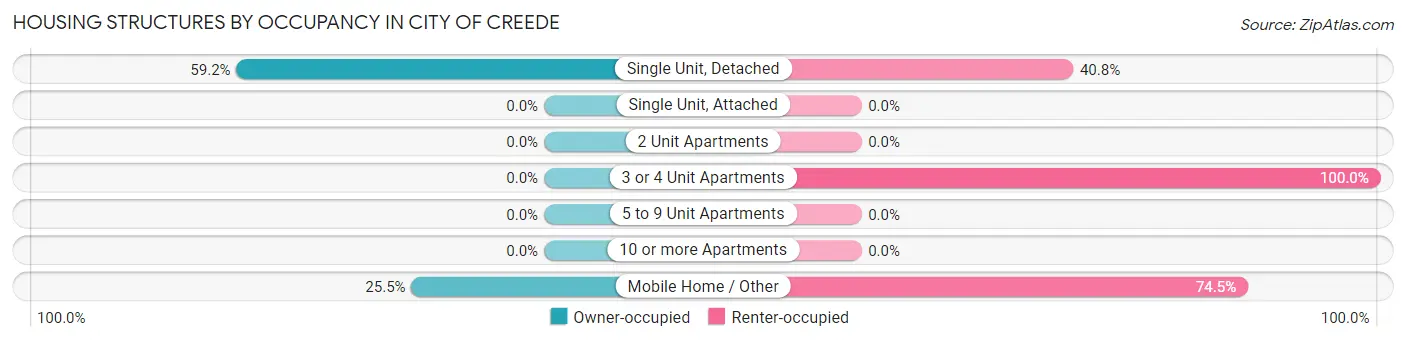
| Structure Type | Owner-occupied | Renter-occupied |
| Single Unit, Detached | 61 (59.2%) | 42 (40.8%) |
| Single Unit, Attached | 0 (0.0%) | 0 (0.0%) |
| 2 Unit Apartments | 0 (0.0%) | 0 (0.0%) |
| 3 or 4 Unit Apartments | 0 (0.0%) | 19 (100.0%) |
| 5 to 9 Unit Apartments | 0 (0.0%) | 0 (0.0%) |
| 10 or more Apartments | 0 (0.0%) | 0 (0.0%) |
| Mobile Home / Other | 12 (25.5%) | 35 (74.5%) |
| Total | 73 (43.2%) | 96 (56.8%) |
Housing Structures by Number of Rooms in City of Creede
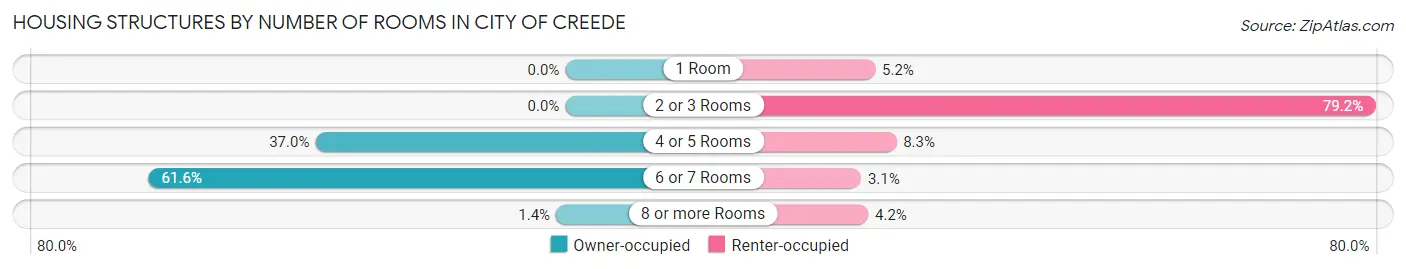
| Number of Rooms | Owner-occupied | Renter-occupied |
| 1 Room | 0 (0.0%) | 5 (5.2%) |
| 2 or 3 Rooms | 0 (0.0%) | 76 (79.2%) |
| 4 or 5 Rooms | 27 (37.0%) | 8 (8.3%) |
| 6 or 7 Rooms | 45 (61.6%) | 3 (3.1%) |
| 8 or more Rooms | 1 (1.4%) | 4 (4.2%) |
| Total | 73 (100.0%) | 96 (100.0%) |
Housing Structure by Heating Type in City of Creede
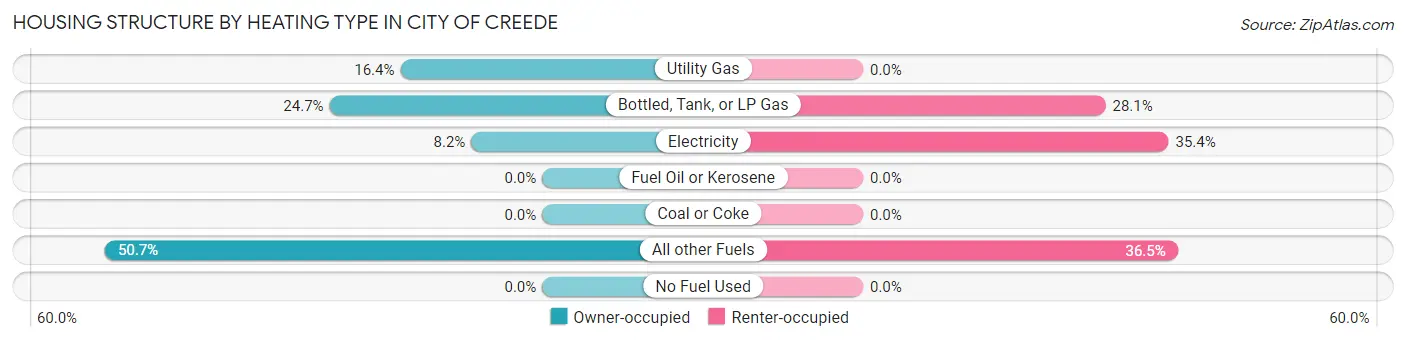
| Heating Type | Owner-occupied | Renter-occupied |
| Utility Gas | 12 (16.4%) | 0 (0.0%) |
| Bottled, Tank, or LP Gas | 18 (24.7%) | 27 (28.1%) |
| Electricity | 6 (8.2%) | 34 (35.4%) |
| Fuel Oil or Kerosene | 0 (0.0%) | 0 (0.0%) |
| Coal or Coke | 0 (0.0%) | 0 (0.0%) |
| All other Fuels | 37 (50.7%) | 35 (36.5%) |
| No Fuel Used | 0 (0.0%) | 0 (0.0%) |
| Total | 73 (100.0%) | 96 (100.0%) |
Household Vehicle Usage in City of Creede
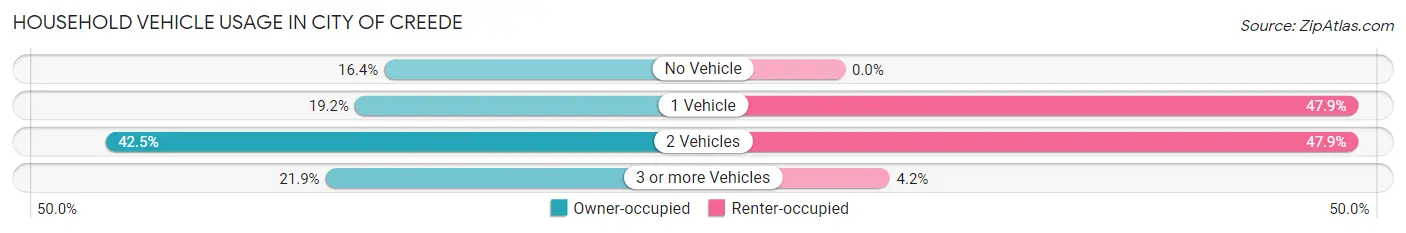
| Vehicles per Household | Owner-occupied | Renter-occupied |
| No Vehicle | 12 (16.4%) | 0 (0.0%) |
| 1 Vehicle | 14 (19.2%) | 46 (47.9%) |
| 2 Vehicles | 31 (42.5%) | 46 (47.9%) |
| 3 or more Vehicles | 16 (21.9%) | 4 (4.2%) |
| Total | 73 (100.0%) | 96 (100.0%) |
Real Estate & Mortgages in City of Creede
Real Estate and Mortgage Overview in City of Creede
| Characteristic | Without Mortgage | With Mortgage |
| Housing Units | 41 | 32 |
| Median Property Value | $325,000 | $350,000 |
| Median Household Income | $56,875 | $0 |
| Monthly Housing Costs | $518 | $0 |
| Real Estate Taxes | $1,545 | $0 |
Property Value by Mortgage Status in City of Creede
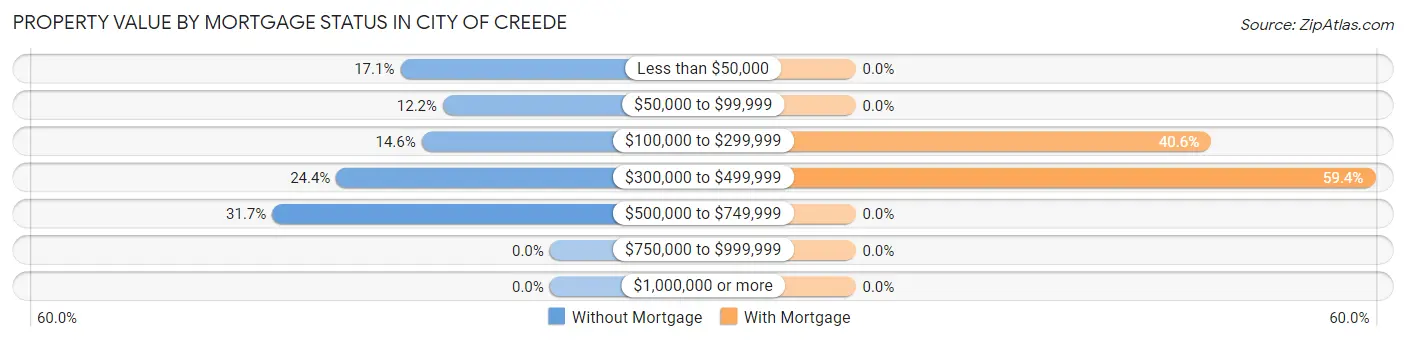
| Property Value | Without Mortgage | With Mortgage |
| Less than $50,000 | 7 (17.1%) | 0 (0.0%) |
| $50,000 to $99,999 | 5 (12.2%) | 0 (0.0%) |
| $100,000 to $299,999 | 6 (14.6%) | 13 (40.6%) |
| $300,000 to $499,999 | 10 (24.4%) | 19 (59.4%) |
| $500,000 to $749,999 | 13 (31.7%) | 0 (0.0%) |
| $750,000 to $999,999 | 0 (0.0%) | 0 (0.0%) |
| $1,000,000 or more | 0 (0.0%) | 0 (0.0%) |
| Total | 41 (100.0%) | 32 (100.0%) |
Household Income by Mortgage Status in City of Creede
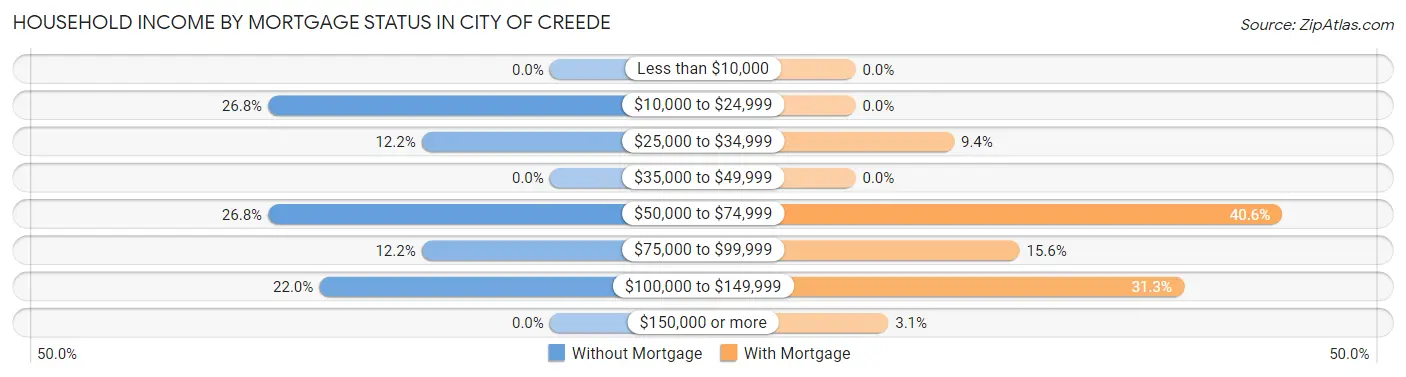
| Household Income | Without Mortgage | With Mortgage |
| Less than $10,000 | 0 (0.0%) | 0 (0.0%) |
| $10,000 to $24,999 | 11 (26.8%) | 0 (0.0%) |
| $25,000 to $34,999 | 5 (12.2%) | 3 (9.4%) |
| $35,000 to $49,999 | 0 (0.0%) | 0 (0.0%) |
| $50,000 to $74,999 | 11 (26.8%) | 13 (40.6%) |
| $75,000 to $99,999 | 5 (12.2%) | 5 (15.6%) |
| $100,000 to $149,999 | 9 (22.0%) | 10 (31.2%) |
| $150,000 or more | 0 (0.0%) | 1 (3.1%) |
| Total | 41 (100.0%) | 32 (100.0%) |
Property Value to Household Income Ratio in City of Creede
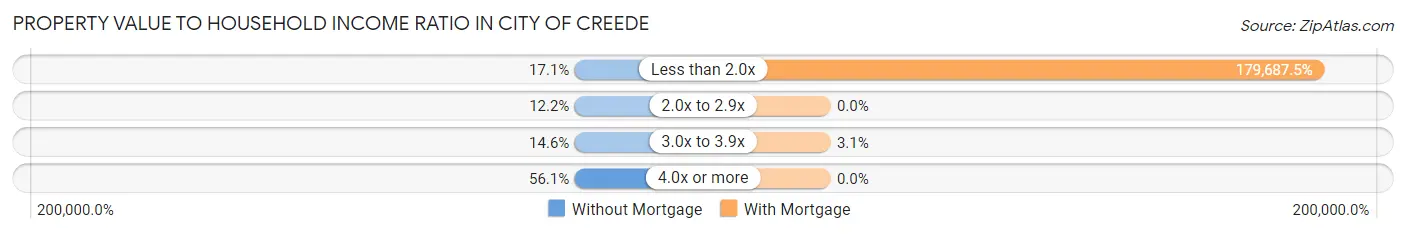
| Value-to-Income Ratio | Without Mortgage | With Mortgage |
| Less than 2.0x | 7 (17.1%) | 57,500 (179,687.5%) |
| 2.0x to 2.9x | 5 (12.2%) | 0 (0.0%) |
| 3.0x to 3.9x | 6 (14.6%) | 1 (3.1%) |
| 4.0x or more | 23 (56.1%) | 0 (0.0%) |
| Total | 41 (100.0%) | 32 (100.0%) |
Real Estate Taxes by Mortgage Status in City of Creede
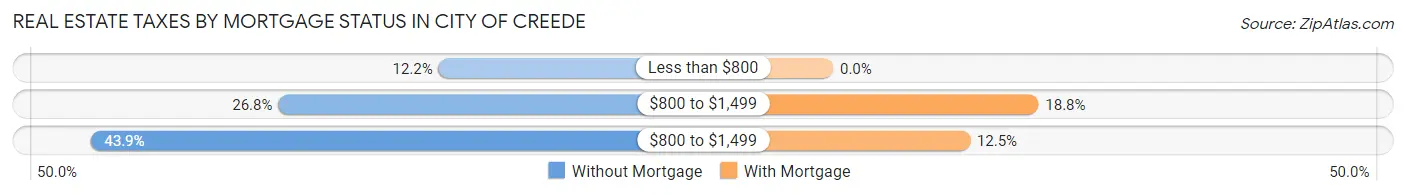
| Property Taxes | Without Mortgage | With Mortgage |
| Less than $800 | 5 (12.2%) | 0 (0.0%) |
| $800 to $1,499 | 11 (26.8%) | 6 (18.8%) |
| $800 to $1,499 | 18 (43.9%) | 4 (12.5%) |
| Total | 41 (100.0%) | 32 (100.0%) |
Health & Disability in City of Creede
Health Insurance Coverage by Age in City of Creede
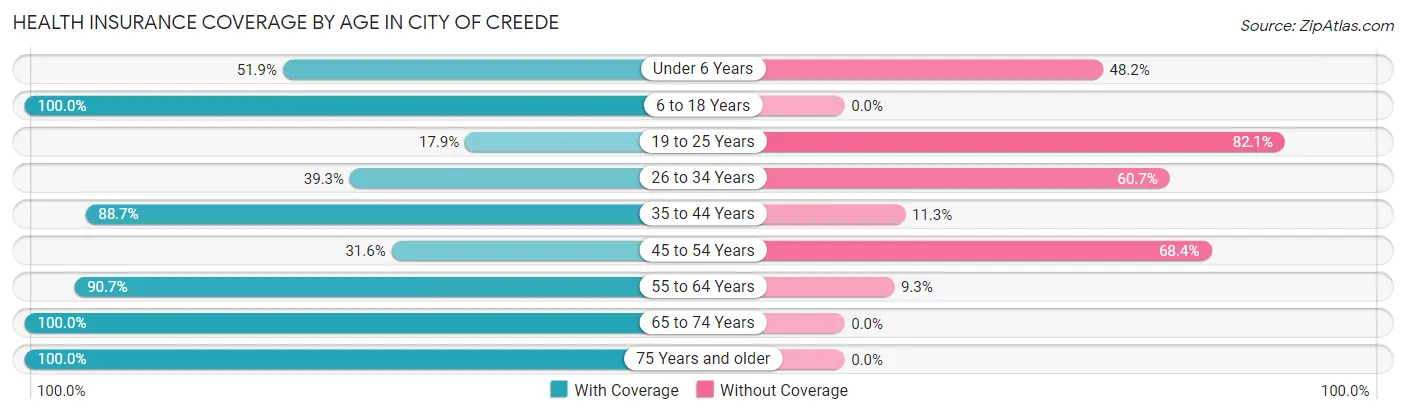
| Age Bracket | With Coverage | Without Coverage |
| Under 6 Years | 14 (51.8%) | 13 (48.1%) |
| 6 to 18 Years | 6 (100.0%) | 0 (0.0%) |
| 19 to 25 Years | 5 (17.9%) | 23 (82.1%) |
| 26 to 34 Years | 24 (39.3%) | 37 (60.7%) |
| 35 to 44 Years | 47 (88.7%) | 6 (11.3%) |
| 45 to 54 Years | 6 (31.6%) | 13 (68.4%) |
| 55 to 64 Years | 49 (90.7%) | 5 (9.3%) |
| 65 to 74 Years | 17 (100.0%) | 0 (0.0%) |
| 75 Years and older | 15 (100.0%) | 0 (0.0%) |
| Total | 183 (65.4%) | 97 (34.6%) |
Health Insurance Coverage by Citizenship Status in City of Creede
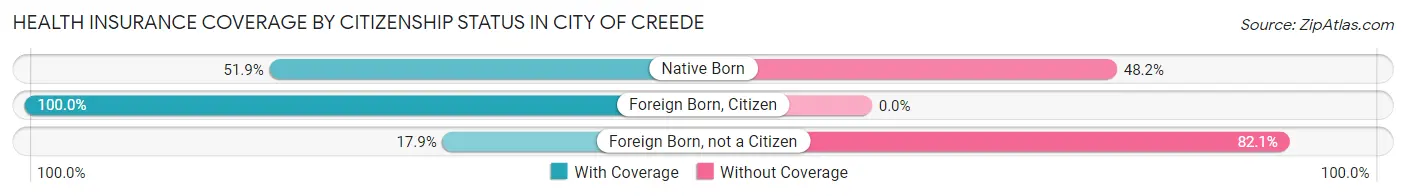
| Citizenship Status | With Coverage | Without Coverage |
| Native Born | 14 (51.8%) | 13 (48.1%) |
| Foreign Born, Citizen | 6 (100.0%) | 0 (0.0%) |
| Foreign Born, not a Citizen | 5 (17.9%) | 23 (82.1%) |
Health Insurance Coverage by Household Income in City of Creede
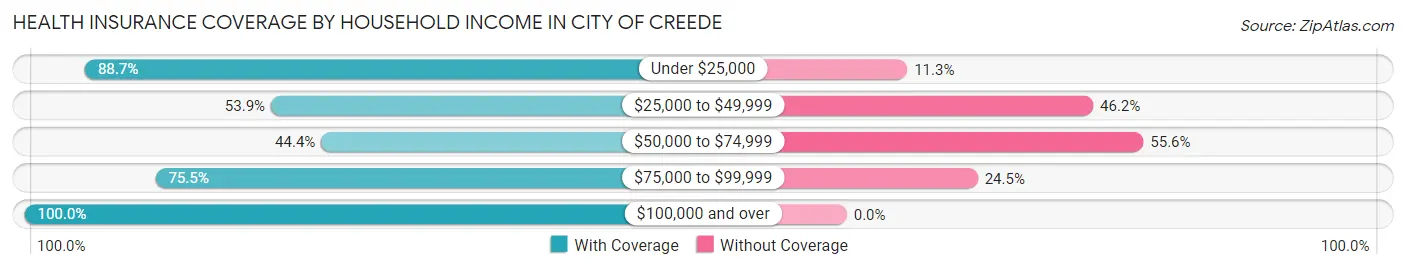
| Household Income | With Coverage | Without Coverage |
| Under $25,000 | 47 (88.7%) | 6 (11.3%) |
| $25,000 to $49,999 | 21 (53.8%) | 18 (46.2%) |
| $50,000 to $74,999 | 48 (44.4%) | 60 (55.6%) |
| $75,000 to $99,999 | 40 (75.5%) | 13 (24.5%) |
| $100,000 and over | 18 (100.0%) | 0 (0.0%) |
Public vs Private Health Insurance Coverage by Age in City of Creede
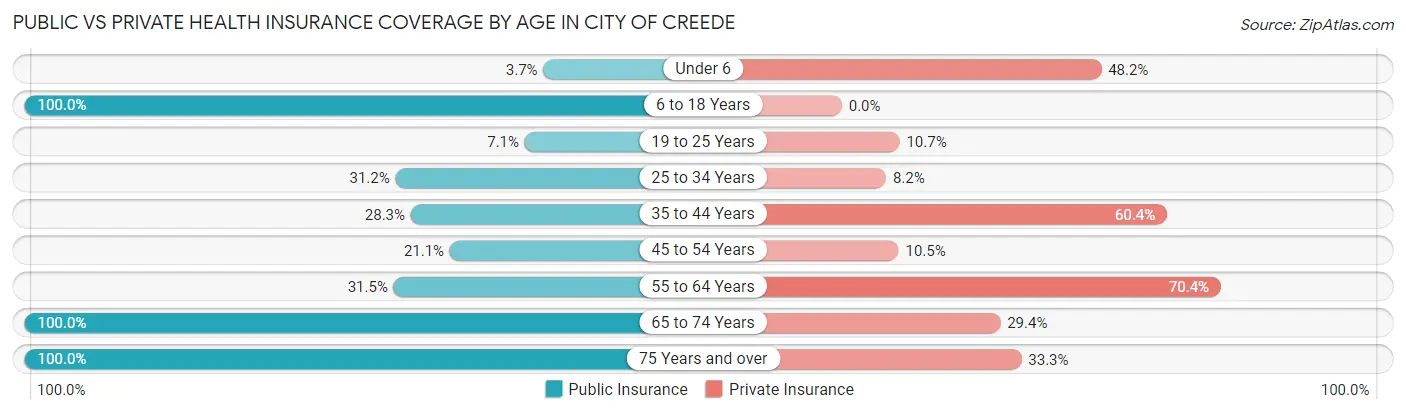
| Age Bracket | Public Insurance | Private Insurance |
| Under 6 | 1 (3.7%) | 13 (48.1%) |
| 6 to 18 Years | 6 (100.0%) | 0 (0.0%) |
| 19 to 25 Years | 2 (7.1%) | 3 (10.7%) |
| 25 to 34 Years | 19 (31.1%) | 5 (8.2%) |
| 35 to 44 Years | 15 (28.3%) | 32 (60.4%) |
| 45 to 54 Years | 4 (21.0%) | 2 (10.5%) |
| 55 to 64 Years | 17 (31.5%) | 38 (70.4%) |
| 65 to 74 Years | 17 (100.0%) | 5 (29.4%) |
| 75 Years and over | 15 (100.0%) | 5 (33.3%) |
| Total | 96 (34.3%) | 103 (36.8%) |
Disability Status by Sex by Age in City of Creede
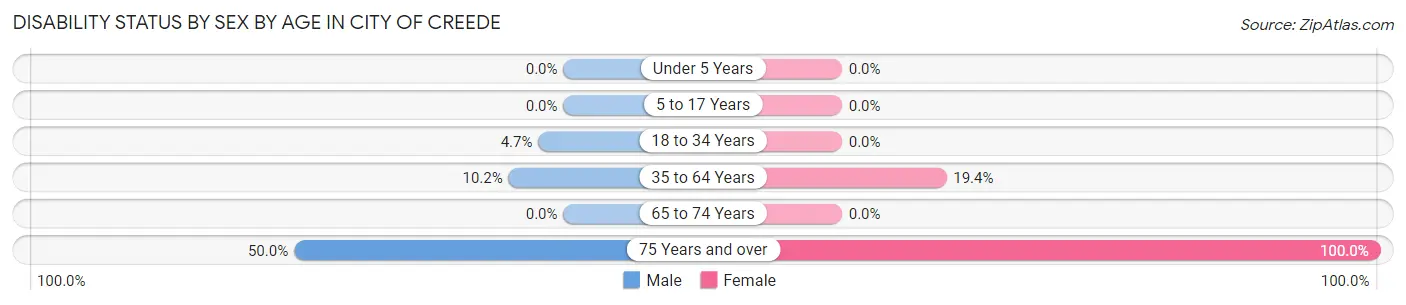
| Age Bracket | Male | Female |
| Under 5 Years | 0 (0.0%) | 0 (0.0%) |
| 5 to 17 Years | 0 (0.0%) | 0 (0.0%) |
| 18 to 34 Years | 2 (4.6%) | 0 (0.0%) |
| 35 to 64 Years | 6 (10.2%) | 13 (19.4%) |
| 65 to 74 Years | 0 (0.0%) | 0 (0.0%) |
| 75 Years and over | 5 (50.0%) | 5 (100.0%) |
Disability Class by Sex by Age in City of Creede
Disability Class: Hearing Difficulty
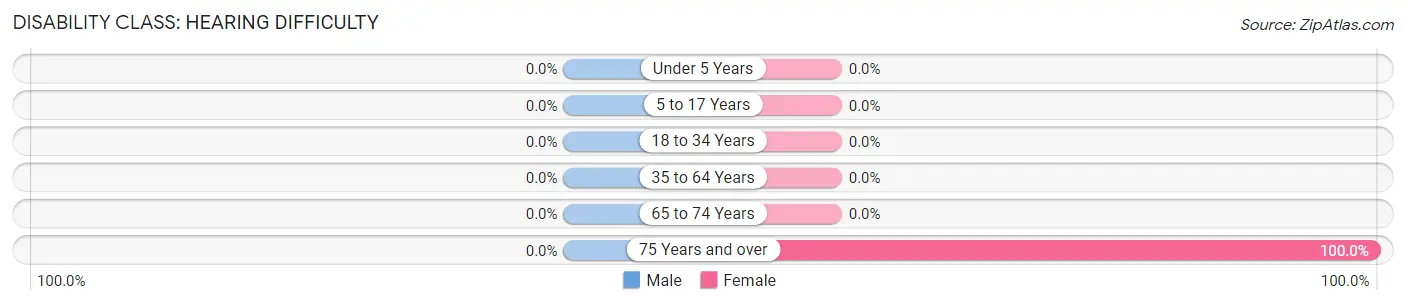
| Age Bracket | Male | Female |
| Under 5 Years | 0 (0.0%) | 0 (0.0%) |
| 5 to 17 Years | 0 (0.0%) | 0 (0.0%) |
| 18 to 34 Years | 0 (0.0%) | 0 (0.0%) |
| 35 to 64 Years | 0 (0.0%) | 0 (0.0%) |
| 65 to 74 Years | 0 (0.0%) | 0 (0.0%) |
| 75 Years and over | 0 (0.0%) | 5 (100.0%) |
Disability Class: Vision Difficulty
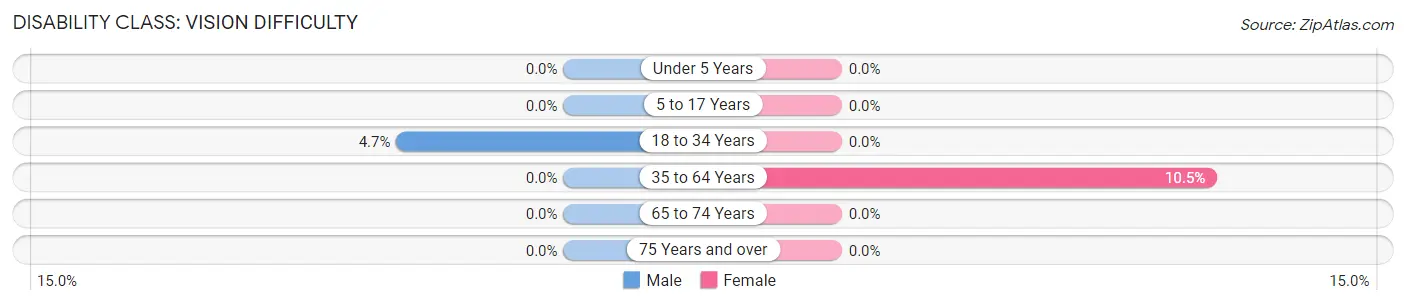
| Age Bracket | Male | Female |
| Under 5 Years | 0 (0.0%) | 0 (0.0%) |
| 5 to 17 Years | 0 (0.0%) | 0 (0.0%) |
| 18 to 34 Years | 2 (4.6%) | 0 (0.0%) |
| 35 to 64 Years | 0 (0.0%) | 7 (10.4%) |
| 65 to 74 Years | 0 (0.0%) | 0 (0.0%) |
| 75 Years and over | 0 (0.0%) | 0 (0.0%) |
Disability Class: Cognitive Difficulty
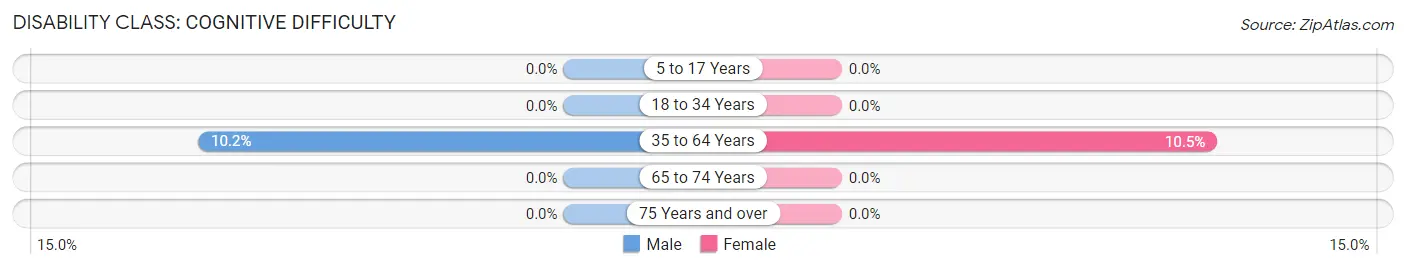
| Age Bracket | Male | Female |
| 5 to 17 Years | 0 (0.0%) | 0 (0.0%) |
| 18 to 34 Years | 0 (0.0%) | 0 (0.0%) |
| 35 to 64 Years | 6 (10.2%) | 7 (10.4%) |
| 65 to 74 Years | 0 (0.0%) | 0 (0.0%) |
| 75 Years and over | 0 (0.0%) | 0 (0.0%) |
Disability Class: Ambulatory Difficulty
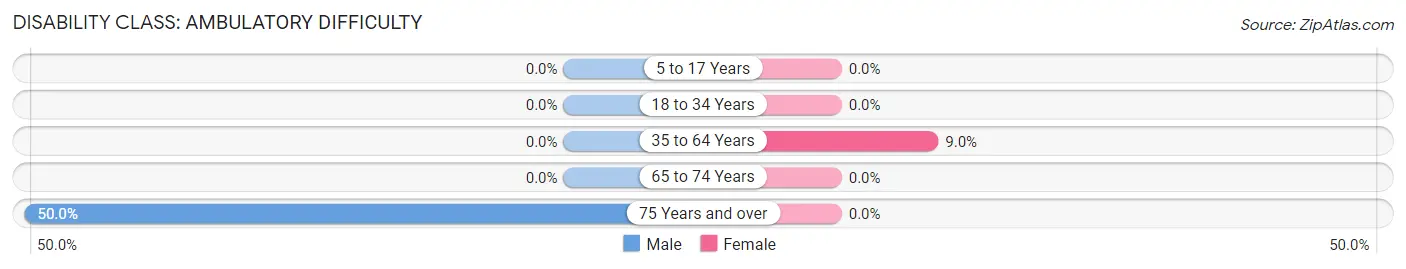
| Age Bracket | Male | Female |
| 5 to 17 Years | 0 (0.0%) | 0 (0.0%) |
| 18 to 34 Years | 0 (0.0%) | 0 (0.0%) |
| 35 to 64 Years | 0 (0.0%) | 6 (9.0%) |
| 65 to 74 Years | 0 (0.0%) | 0 (0.0%) |
| 75 Years and over | 5 (50.0%) | 0 (0.0%) |
Disability Class: Self-Care Difficulty
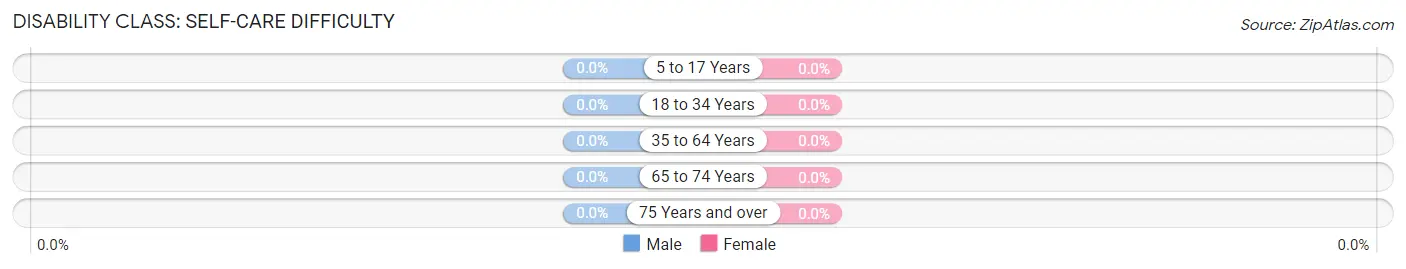
| Age Bracket | Male | Female |
| 5 to 17 Years | 0 (0.0%) | 0 (0.0%) |
| 18 to 34 Years | 0 (0.0%) | 0 (0.0%) |
| 35 to 64 Years | 0 (0.0%) | 0 (0.0%) |
| 65 to 74 Years | 0 (0.0%) | 0 (0.0%) |
| 75 Years and over | 0 (0.0%) | 0 (0.0%) |
Technology Access in City of Creede
Computing Device Access in City of Creede
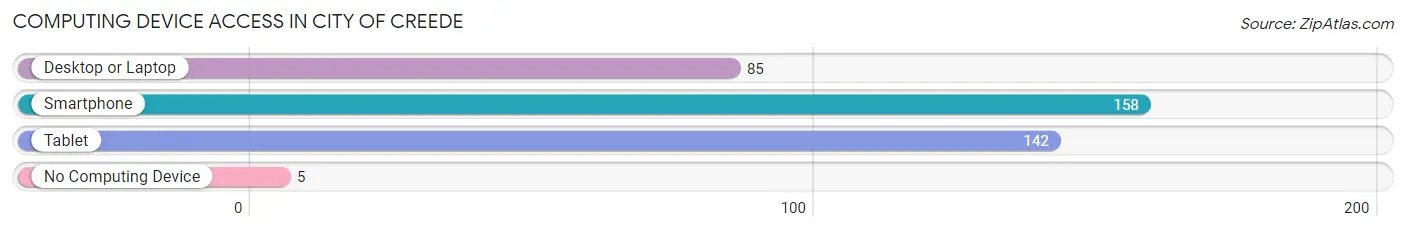
| Device Type | # Households | % Households |
| Desktop or Laptop | 85 | 50.3% |
| Smartphone | 158 | 93.5% |
| Tablet | 142 | 84.0% |
| No Computing Device | 5 | 3.0% |
| Total | 169 | 100.0% |
Internet Access in City of Creede
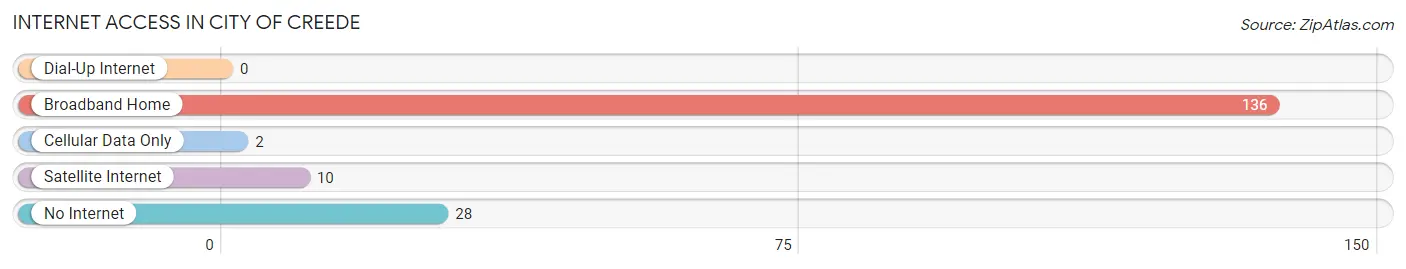
| Internet Type | # Households | % Households |
| Dial-Up Internet | 0 | 0.0% |
| Broadband Home | 136 | 80.5% |
| Cellular Data Only | 2 | 1.2% |
| Satellite Internet | 10 | 5.9% |
| No Internet | 28 | 16.6% |
| Total | 169 | 100.0% |
City of Creede Summary
City of Creede Colorado
Creede, Colorado is a small town located in Mineral County, Colorado. It is situated in the San Juan Mountains, at an elevation of 8,822 feet. The town was founded in 1889 during the silver boom of the late 19th century. It is the county seat of Mineral County and is home to a population of approximately 400 people.
History
The area around Creede was first inhabited by the Ute Indians, who used the area for hunting and gathering. The first Europeans to explore the area were Spanish explorers in the late 1700s. In the late 1800s, prospectors discovered silver in the area and the town of Creede was founded in 1889. The town quickly grew to become one of the most prosperous mining towns in the state. At its peak, the population of Creede was over 10,000 people.
The town was home to many famous figures, including outlaws Robert LeRoy Parker (better known as Butch Cassidy) and Harry Longabaugh (better known as the Sundance Kid). The town was also home to the famous gunfighter and lawman, Bat Masterson.
The town’s prosperity was short-lived, however, as the silver market crashed in 1893. The population of Creede quickly declined and by the early 1900s, the town was nearly abandoned. In the 1950s, the town was revitalized as a tourist destination and today, it is a popular destination for outdoor recreation.
Geography
Creede is located in Mineral County, Colorado, in the San Juan Mountains. The town is situated at an elevation of 8,822 feet and is surrounded by the Rio Grande National Forest. The town is located on the banks of the Rio Grande River and is surrounded by mountains, including the Weminuche Wilderness Area.
The climate in Creede is semi-arid, with hot summers and cold winters. The average annual temperature is 45°F and the average annual precipitation is 16 inches.
Economy
The economy of Creede is largely based on tourism. The town is a popular destination for outdoor recreation, including fishing, hunting, camping, and hiking. The town is also home to several art galleries, restaurants, and shops.
The town is also home to several mining operations, including the Creede Underground Mining Museum. The museum is a popular tourist attraction and offers tours of the old mines.
Demographics
As of the 2010 census, the population of Creede was 400 people. The racial makeup of the town was 95.5% White, 0.3% African American, 0.8% Native American, 0.3% Asian, 0.3% from other races, and 2.8% from two or more races. Hispanic or Latino of any race were 4.3% of the population.
The median income for a household in Creede was $31,250, and the median income for a family was $37,500. The per capita income for the town was $17,818. About 11.3% of families and 14.3% of the population were below the poverty line, including 18.2% of those under age 18 and none of those age 65 or over.
Conclusion
Creede, Colorado is a small town located in Mineral County, Colorado. It is situated in the San Juan Mountains, at an elevation of 8,822 feet. The town was founded in 1889 during the silver boom of the late 19th century. It is the county seat of Mineral County and is home to a population of approximately 400 people. The economy of Creede is largely based on tourism and mining. The town is a popular destination for outdoor recreation, including fishing, hunting, camping, and hiking. The town is also home to several art galleries, restaurants, and shops. The racial makeup of the town is 95.5% White, 0.3% African American, 0.8% Native American, 0.3% Asian, 0.3% from other races, and 2.8% from two or more races. Hispanic or Latino of any race were 4.3% of the population. Creede is a unique and vibrant town that offers visitors a chance to experience the history and culture of the area.
Common Questions
What is Per Capita Income in City of Creede?
Per Capita income in City of Creede is $29,850.
What is the Median Family Income in City of Creede?
Median Family Income in City of Creede is $55,833.
What is the Median Household income in City of Creede?
Median Household Income in City of Creede is $51,033.
What is Income or Wage Gap in City of Creede?
Income or Wage Gap in City of Creede is 66.9%.
Women in City of Creede earn 33.1 cents for every dollar earned by a man.
What is Inequality or Gini Index in City of Creede?
Inequality or Gini Index in City of Creede is 0.34.
What is the Total Population of City of Creede?
Total Population of City of Creede is 280.
What is the Total Male Population of City of Creede?
Total Male Population of City of Creede is 118.
What is the Total Female Population of City of Creede?
Total Female Population of City of Creede is 162.
What is the Ratio of Males per 100 Females in City of Creede?
There are 72.84 Males per 100 Females in City of Creede.
What is the Ratio of Females per 100 Males in City of Creede?
There are 137.29 Females per 100 Males in City of Creede.
What is the Median Population Age in City of Creede?
Median Population Age in City of Creede is 39.1 Years.
What is the Average Family Size in City of Creede
Average Family Size in City of Creede is 2.3 People.
What is the Average Household Size in City of Creede
Average Household Size in City of Creede is 1.6 People.
How Large is the Labor Force in City of Creede?
There are 181 People in the Labor Forcein in City of Creede.
What is the Percentage of People in the Labor Force in City of Creede?
73.3% of People are in the Labor Force in City of Creede.
What is the Unemployment Rate in City of Creede?
Unemployment Rate in City of Creede is 4.4%.