Zip Codes with the Highest Percentage of Population with a Degree in Visual and Performing Arts in Broomfield, CO
RELATED REPORTS & OPTIONS
Visual and Performing Arts
Broomfield
Compare Zip Codes
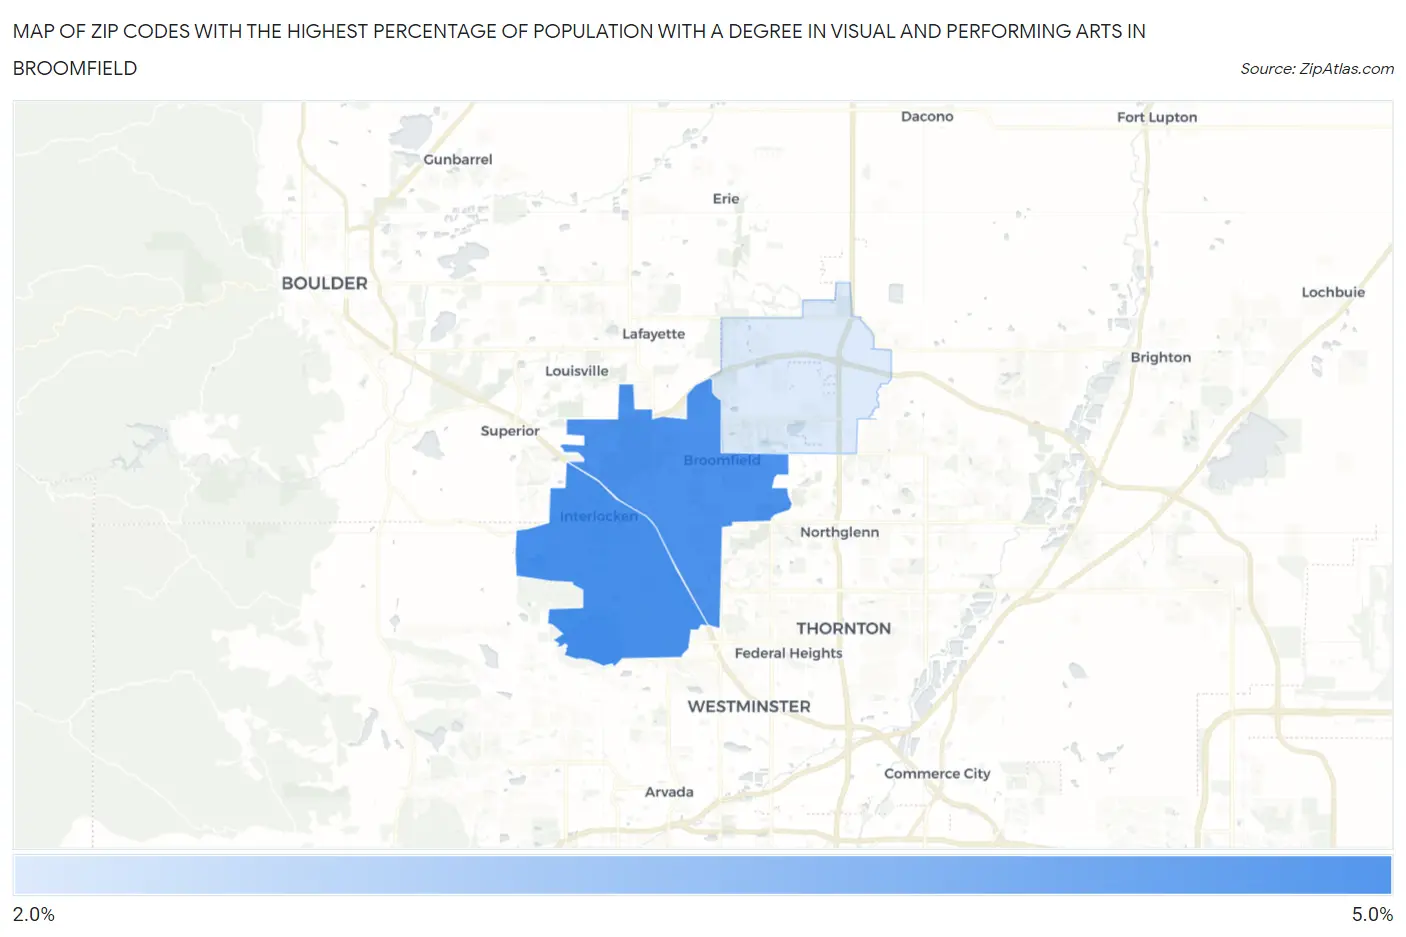
Map of Zip Codes with the Highest Percentage of Population with a Degree in Visual and Performing Arts in Broomfield
2.4%
4.5%
Zip Codes with the Highest Percentage of Population with a Degree in Visual and Performing Arts in Broomfield, CO
| Zip Code | % Graduates | vs State | vs National | |
| 1. | 80021 | 4.5% | 4.3%(+0.189)#163 | 4.3%(+0.264)#7,766 |
| 2. | 80020 | 4.4% | 4.3%(+0.121)#165 | 4.3%(+0.195)#7,947 |
| 3. | 80023 | 2.4% | 4.3%(-1.96)#280 | 4.3%(-1.89)#15,114 |
1
Common Questions
What are the Top Zip Codes with the Highest Percentage of Population with a Degree in Visual and Performing Arts in Broomfield, CO?
Top Zip Codes with the Highest Percentage of Population with a Degree in Visual and Performing Arts in Broomfield, CO are:
What zip code has the Highest Percentage of Population with a Degree in Visual and Performing Arts in Broomfield, CO?
80021 has the Highest Percentage of Population with a Degree in Visual and Performing Arts in Broomfield, CO with 4.5%.
What is the Percentage of Population with a Degree in Visual and Performing Arts in Broomfield, CO?
Percentage of Population with a Degree in Visual and Performing Arts in Broomfield is 3.5%.
What is the Percentage of Population with a Degree in Visual and Performing Arts in Colorado?
Percentage of Population with a Degree in Visual and Performing Arts in Colorado is 4.3%.
What is the Percentage of Population with a Degree in Visual and Performing Arts in the United States?
Percentage of Population with a Degree in Visual and Performing Arts in the United States is 4.3%.