Zip Codes with the Highest Percentage of Population with a Degree in Visual and Performing Arts in Englewood, CO
RELATED REPORTS & OPTIONS
Visual and Performing Arts
Englewood
Compare Zip Codes
Map of Zip Codes with the Highest Percentage of Population with a Degree in Visual and Performing Arts in Englewood
2.5%
6.1%
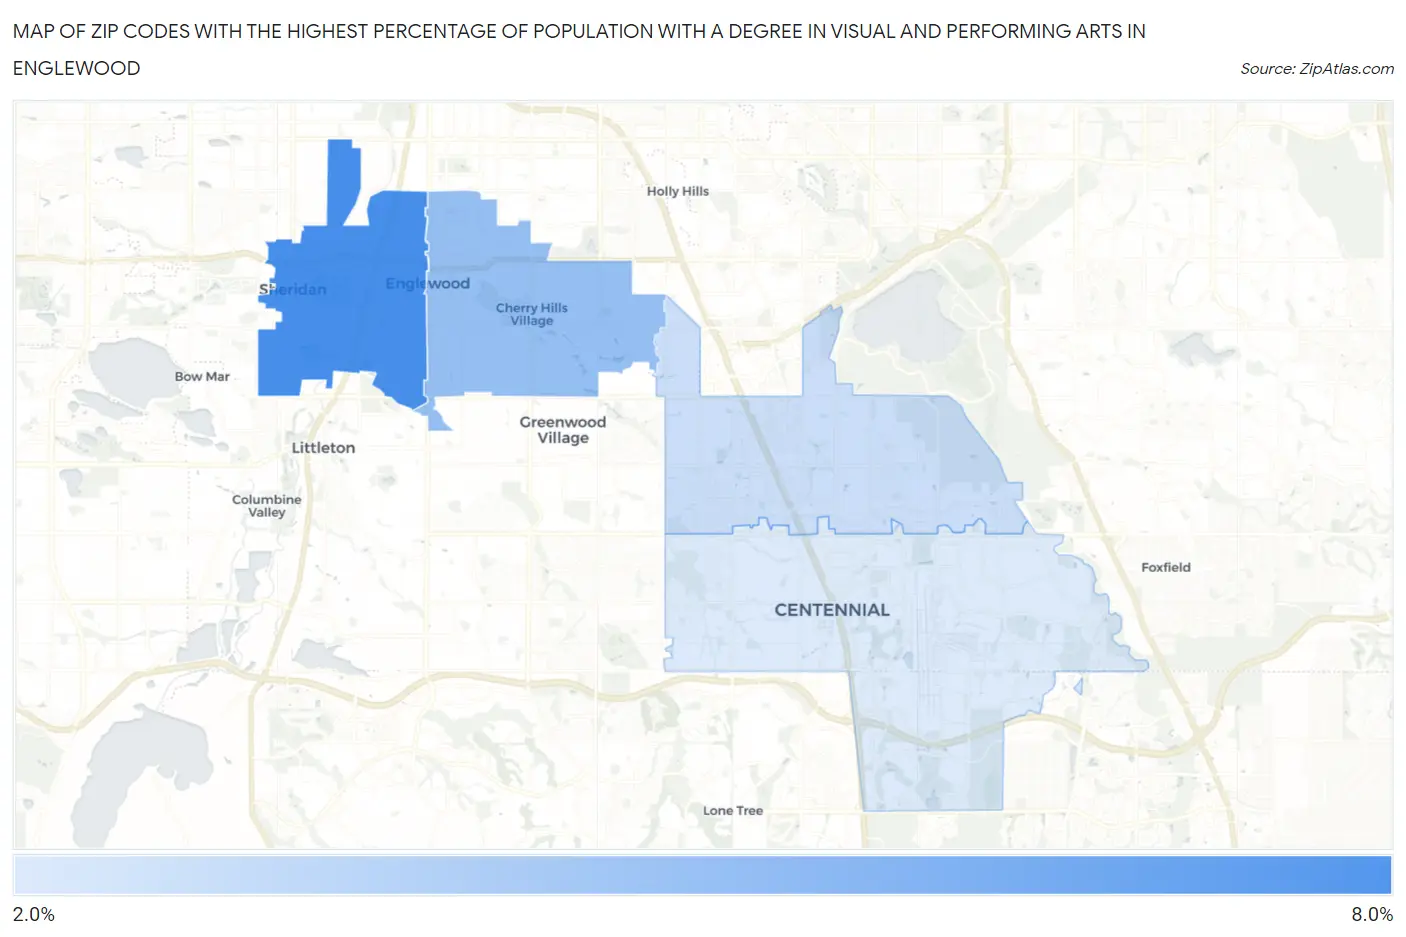
Zip Codes with the Highest Percentage of Population with a Degree in Visual and Performing Arts in Englewood, CO
| Zip Code | % Graduates | vs State | vs National | |
| 1. | 80110 | 6.1% | 4.3%(+1.77)#86 | 4.3%(+1.85)#4,732 |
| 2. | 80113 | 4.2% | 4.3%(-0.101)#176 | 4.3%(-0.026)#8,549 |
| 3. | 80111 | 3.0% | 4.3%(-1.36)#243 | 4.3%(-1.28)#12,841 |
| 4. | 80112 | 2.5% | 4.3%(-1.79)#274 | 4.3%(-1.71)#14,476 |
1
Common Questions
What are the Top 3 Zip Codes with the Highest Percentage of Population with a Degree in Visual and Performing Arts in Englewood, CO?
Top 3 Zip Codes with the Highest Percentage of Population with a Degree in Visual and Performing Arts in Englewood, CO are:
What zip code has the Highest Percentage of Population with a Degree in Visual and Performing Arts in Englewood, CO?
80110 has the Highest Percentage of Population with a Degree in Visual and Performing Arts in Englewood, CO with 6.1%.
What is the Percentage of Population with a Degree in Visual and Performing Arts in Englewood, CO?
Percentage of Population with a Degree in Visual and Performing Arts in Englewood is 6.1%.
What is the Percentage of Population with a Degree in Visual and Performing Arts in Colorado?
Percentage of Population with a Degree in Visual and Performing Arts in Colorado is 4.3%.
What is the Percentage of Population with a Degree in Visual and Performing Arts in the United States?
Percentage of Population with a Degree in Visual and Performing Arts in the United States is 4.3%.