Phippsburg, CO Map & Demographics
Phippsburg Map
Phippsburg Overview
$42,778
PER CAPITA INCOME
$79,397
AVG HOUSEHOLD INCOME
50.5%
WAGE / INCOME GAP [ % ]
49.5¢/ $1
WAGE / INCOME GAP [ $ ]
0.30
INEQUALITY / GINI INDEX
345
TOTAL POPULATION
162
MALE POPULATION
183
FEMALE POPULATION
88.52
MALES / 100 FEMALES
112.96
FEMALES / 100 MALES
45.0
MEDIAN AGE
2.2
AVG FAMILY SIZE
2.2
AVG HOUSEHOLD SIZE
210
LABOR FORCE [ PEOPLE ]
74.2%
PERCENT IN LABOR FORCE
13.3%
UNEMPLOYMENT RATE
Phippsburg Zip Codes
Phippsburg Area Codes
Income in Phippsburg
Income Overview in Phippsburg
| Characteristic | Number | Measure |
| Per Capita Income | 345 | $42,778 |
| Median Family Income | 132 | $0 |
| Mean Family Income | 132 | $83,805 |
| Median Household Income | 154 | $79,397 |
| Mean Household Income | 154 | $97,201 |
| Income Deficit | 132 | $0 |
| Wage / Income Gap (%) | 345 | 50.50% |
| Wage / Income Gap ($) | 345 | 49.50¢ per $1 |
| Gini / Inequality Index | 345 | 0.30 |
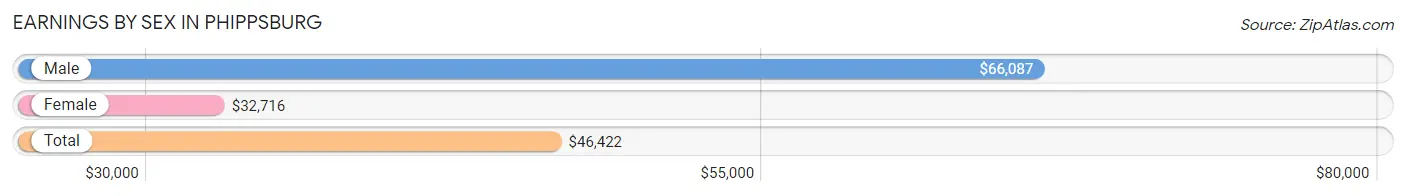
Earnings by Sex in Phippsburg
Average Earnings in Phippsburg are $46,422, $66,087 for men and $32,716 for women, a difference of 50.5%.
| Sex | Number | Average Earnings |
| Male | 118 (54.4%) | $66,087 |
| Female | 99 (45.6%) | $32,716 |
| Total | 217 (100.0%) | $46,422 |
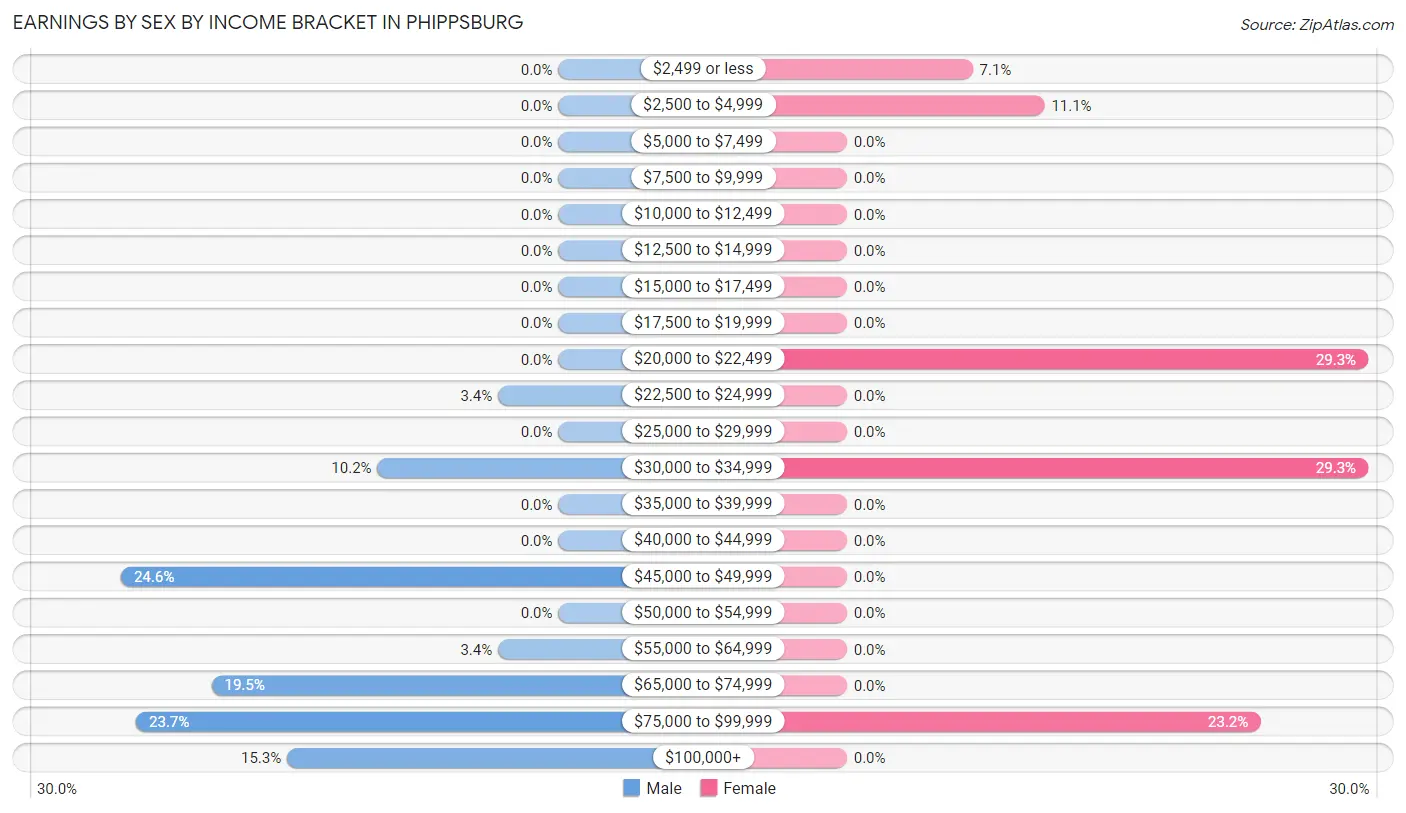
Earnings by Sex by Income Bracket in Phippsburg
The most common earnings brackets in Phippsburg are $45,000 to $49,999 for men (29 | 24.6%) and $20,000 to $22,499 for women (29 | 29.3%).
| Income | Male | Female |
| $2,499 or less | 0 (0.0%) | 7 (7.1%) |
| $2,500 to $4,999 | 0 (0.0%) | 11 (11.1%) |
| $5,000 to $7,499 | 0 (0.0%) | 0 (0.0%) |
| $7,500 to $9,999 | 0 (0.0%) | 0 (0.0%) |
| $10,000 to $12,499 | 0 (0.0%) | 0 (0.0%) |
| $12,500 to $14,999 | 0 (0.0%) | 0 (0.0%) |
| $15,000 to $17,499 | 0 (0.0%) | 0 (0.0%) |
| $17,500 to $19,999 | 0 (0.0%) | 0 (0.0%) |
| $20,000 to $22,499 | 0 (0.0%) | 29 (29.3%) |
| $22,500 to $24,999 | 4 (3.4%) | 0 (0.0%) |
| $25,000 to $29,999 | 0 (0.0%) | 0 (0.0%) |
| $30,000 to $34,999 | 12 (10.2%) | 29 (29.3%) |
| $35,000 to $39,999 | 0 (0.0%) | 0 (0.0%) |
| $40,000 to $44,999 | 0 (0.0%) | 0 (0.0%) |
| $45,000 to $49,999 | 29 (24.6%) | 0 (0.0%) |
| $50,000 to $54,999 | 0 (0.0%) | 0 (0.0%) |
| $55,000 to $64,999 | 4 (3.4%) | 0 (0.0%) |
| $65,000 to $74,999 | 23 (19.5%) | 0 (0.0%) |
| $75,000 to $99,999 | 28 (23.7%) | 23 (23.2%) |
| $100,000+ | 18 (15.2%) | 0 (0.0%) |
| Total | 118 (100.0%) | 99 (100.0%) |
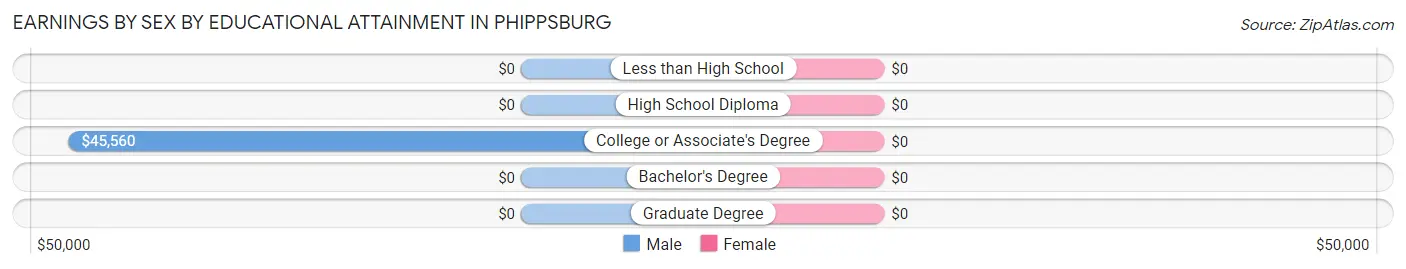
Earnings by Sex by Educational Attainment in Phippsburg
| Educational Attainment | Male Income | Female Income |
| Less than High School | - | - |
| High School Diploma | - | - |
| College or Associate's Degree | $45,560 | $0 |
| Bachelor's Degree | - | - |
| Graduate Degree | - | - |
| Total | $66,087 | $32,716 |
Family Income in Phippsburg
Family Income Brackets in Phippsburg
According to the Phippsburg family income data, there are 33 families falling into the $35,000 to $49,999 income range, which is the most common income bracket and makes up 25.0% of all families.
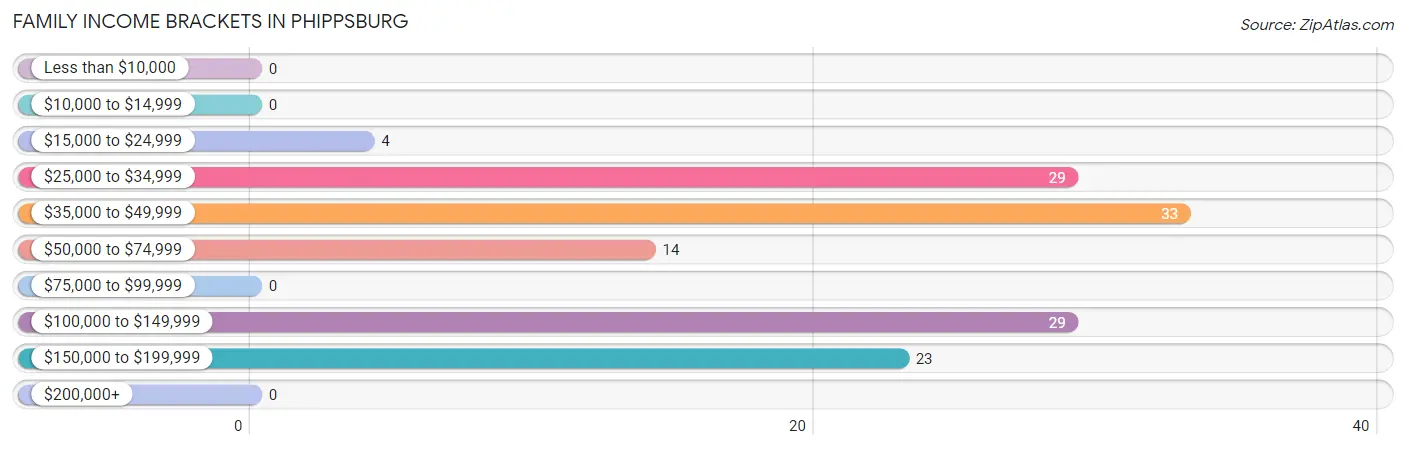
| Income Bracket | # Families | % Families |
| Less than $10,000 | 0 | 0.0% |
| $10,000 to $14,999 | 0 | 0.0% |
| $15,000 to $24,999 | 4 | 3.0% |
| $25,000 to $34,999 | 29 | 22.0% |
| $35,000 to $49,999 | 33 | 25.0% |
| $50,000 to $74,999 | 14 | 10.6% |
| $75,000 to $99,999 | 0 | 0.0% |
| $100,000 to $149,999 | 29 | 22.0% |
| $150,000 to $199,999 | 23 | 17.4% |
| $200,000+ | 0 | 0.0% |
Family Income by Famaliy Size in Phippsburg
| Income Bracket | # Families | Median Income |
| 2-Person Families | 97 (73.5%) | $0 |
| 3-Person Families | 23 (17.4%) | $0 |
| 4-Person Families | 12 (9.1%) | $0 |
| 5-Person Families | 0 (0.0%) | $0 |
| 6-Person Families | 0 (0.0%) | $0 |
| 7+ Person Families | 0 (0.0%) | $0 |
| Total | 132 (100.0%) | $0 |
Family Income by Number of Earners in Phippsburg
| Number of Earners | # Families | Median Income |
| No Earners | 35 (26.5%) | $0 |
| 1 Earner | 29 (22.0%) | $0 |
| 2 Earners | 68 (51.5%) | $0 |
| 3+ Earners | 0 (0.0%) | $0 |
| Total | 132 (100.0%) | $0 |
Household Income in Phippsburg
Household Income Brackets in Phippsburg
With 47 households falling in the category, the $100,000 to $149,999 income range is the most frequent in Phippsburg, accounting for 30.5% of all households.
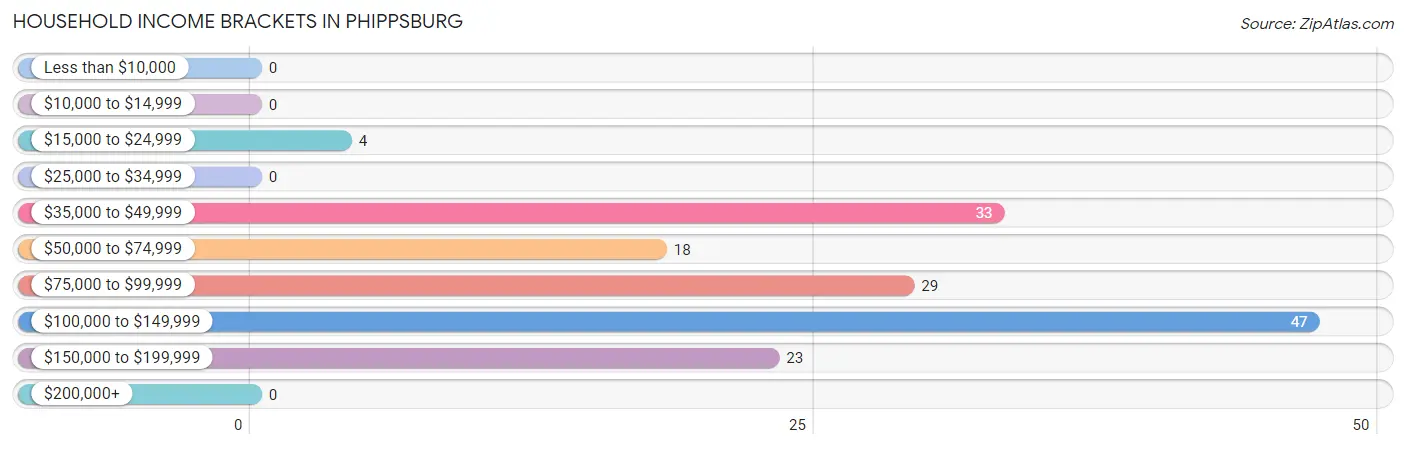
| Income Bracket | # Households | % Households |
| Less than $10,000 | 0 | 0.0% |
| $10,000 to $14,999 | 0 | 0.0% |
| $15,000 to $24,999 | 4 | 2.6% |
| $25,000 to $34,999 | 0 | 0.0% |
| $35,000 to $49,999 | 33 | 21.4% |
| $50,000 to $74,999 | 18 | 11.7% |
| $75,000 to $99,999 | 29 | 18.8% |
| $100,000 to $149,999 | 47 | 30.5% |
| $150,000 to $199,999 | 23 | 14.9% |
| $200,000+ | 0 | 0.0% |
Household Income by Householder Age in Phippsburg
The median household income in Phippsburg is $79,397, with the highest median household income of $106,164 found in the 45 to 64 years age bracket for the primary householder. A total of 77 households (50.0%) fall into this category.
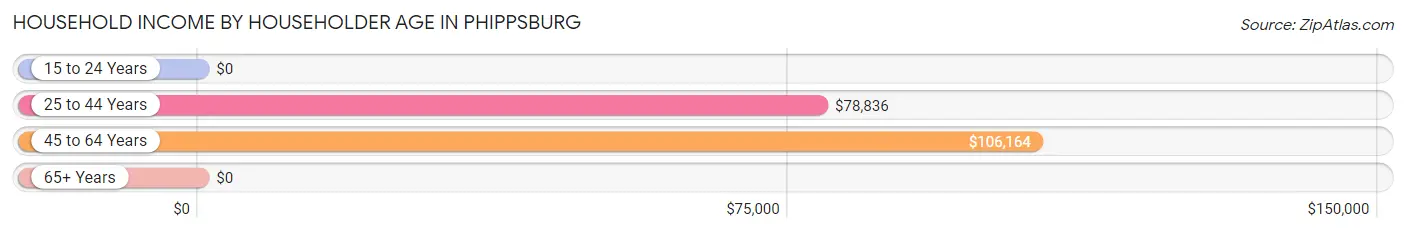
| Income Bracket | # Households | Median Income |
| 15 to 24 Years | 0 (0.0%) | $0 |
| 25 to 44 Years | 63 (40.9%) | $78,836 |
| 45 to 64 Years | 77 (50.0%) | $106,164 |
| 65+ Years | 14 (9.1%) | $0 |
| Total | 154 (100.0%) | $79,397 |
Poverty in Phippsburg
Income Below Poverty by Sex and Age in Phippsburg
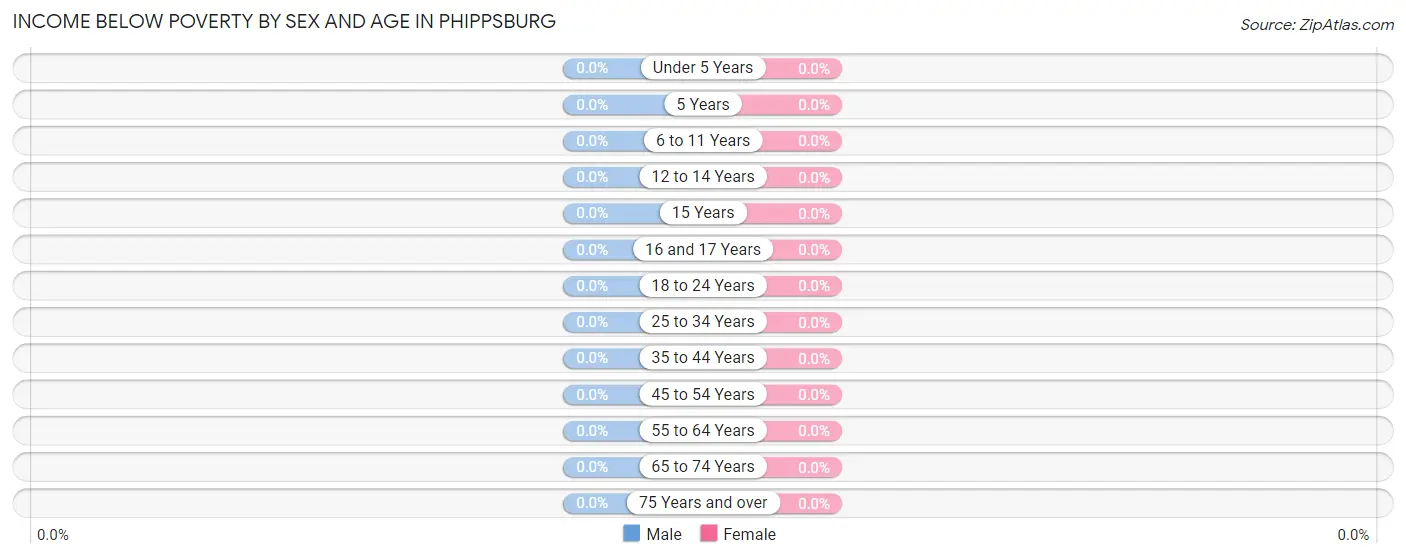
| Age Bracket | Male | Female |
| Under 5 Years | 0 (0.0%) | 0 (0.0%) |
| 5 Years | 0 (0.0%) | 0 (0.0%) |
| 6 to 11 Years | 0 (0.0%) | 0 (0.0%) |
| 12 to 14 Years | 0 (0.0%) | 0 (0.0%) |
| 15 Years | 0 (0.0%) | 0 (0.0%) |
| 16 and 17 Years | 0 (0.0%) | 0 (0.0%) |
| 18 to 24 Years | 0 (0.0%) | 0 (0.0%) |
| 25 to 34 Years | 0 (0.0%) | 0 (0.0%) |
| 35 to 44 Years | 0 (0.0%) | 0 (0.0%) |
| 45 to 54 Years | 0 (0.0%) | 0 (0.0%) |
| 55 to 64 Years | 0 (0.0%) | 0 (0.0%) |
| 65 to 74 Years | 0 (0.0%) | 0 (0.0%) |
| 75 Years and over | 0 (0.0%) | 0 (0.0%) |
| Total | 0 (0.0%) | 0 (0.0%) |
Income Above Poverty by Sex and Age in Phippsburg
According to the poverty statistics in Phippsburg, males aged 6 to 11 years and females aged under 5 years are the age groups that are most secure financially, with 100.0% of males and 100.0% of females in these age groups living above the poverty line.
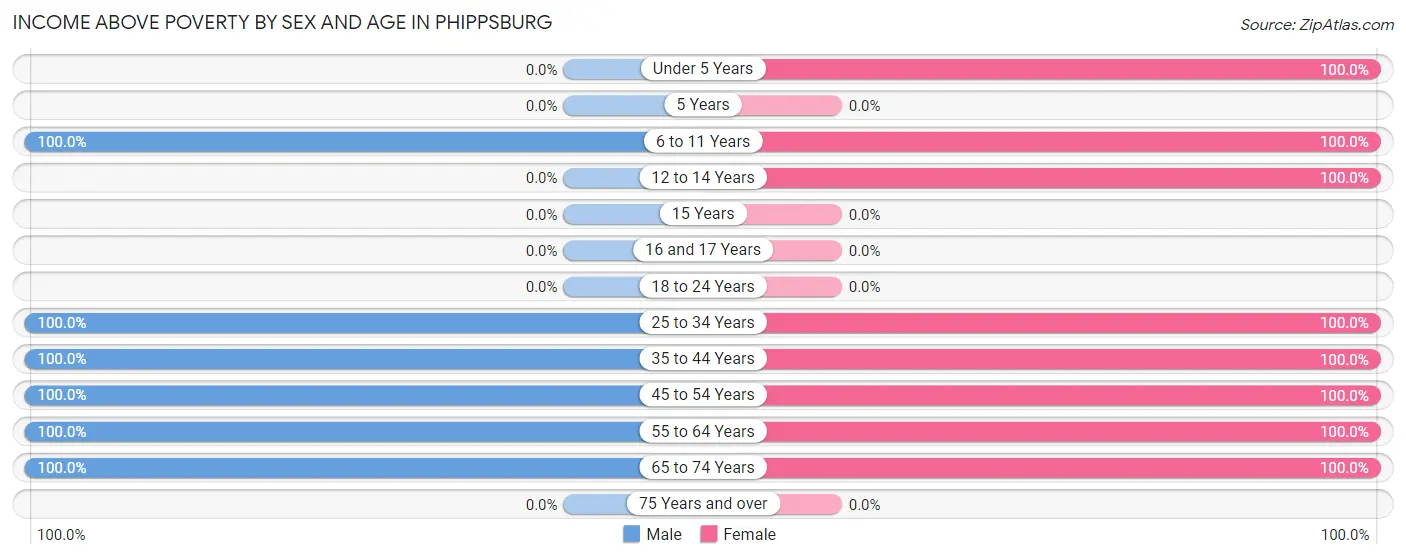
| Age Bracket | Male | Female |
| Under 5 Years | 0 (0.0%) | 26 (100.0%) |
| 5 Years | 0 (0.0%) | 0 (0.0%) |
| 6 to 11 Years | 10 (100.0%) | 17 (100.0%) |
| 12 to 14 Years | 0 (0.0%) | 9 (100.0%) |
| 15 Years | 0 (0.0%) | 0 (0.0%) |
| 16 and 17 Years | 0 (0.0%) | 0 (0.0%) |
| 18 to 24 Years | 0 (0.0%) | 0 (0.0%) |
| 25 to 34 Years | 51 (100.0%) | 36 (100.0%) |
| 35 to 44 Years | 12 (100.0%) | 11 (100.0%) |
| 45 to 54 Years | 55 (100.0%) | 23 (100.0%) |
| 55 to 64 Years | 20 (100.0%) | 50 (100.0%) |
| 65 to 74 Years | 14 (100.0%) | 11 (100.0%) |
| 75 Years and over | 0 (0.0%) | 0 (0.0%) |
| Total | 162 (100.0%) | 183 (100.0%) |
Income Below Poverty Among Married-Couple Families in Phippsburg
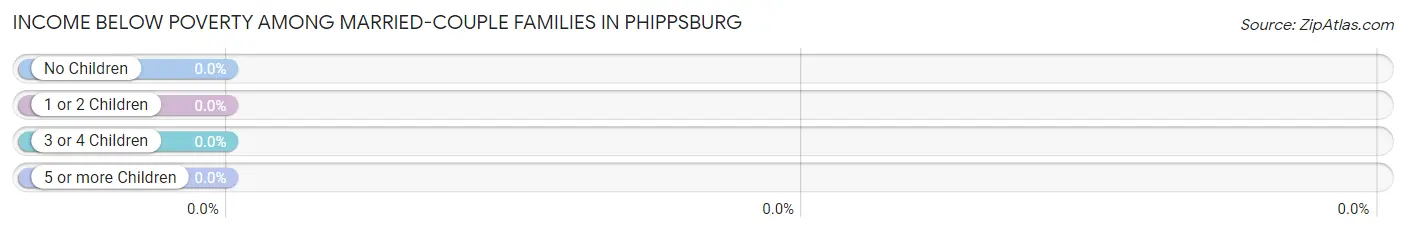
| Children | Above Poverty | Below Poverty |
| No Children | 68 (100.0%) | 0 (0.0%) |
| 1 or 2 Children | 35 (100.0%) | 0 (0.0%) |
| 3 or 4 Children | 0 (0.0%) | 0 (0.0%) |
| 5 or more Children | 0 (0.0%) | 0 (0.0%) |
| Total | 103 (100.0%) | 0 (0.0%) |
Income Below Poverty Among Single-Parent Households in Phippsburg
| Children | Single Father | Single Mother |
| No Children | 0 (0.0%) | 0 (0.0%) |
| 1 or 2 Children | 0 (0.0%) | 0 (0.0%) |
| 3 or 4 Children | 0 (0.0%) | 0 (0.0%) |
| 5 or more Children | 0 (0.0%) | 0 (0.0%) |
| Total | 0 (0.0%) | 0 (0.0%) |
Income Below Poverty Among Married-Couple vs Single-Parent Households in Phippsburg
| Children | Married-Couple Families | Single-Parent Households |
| No Children | 0 (0.0%) | 0 (0.0%) |
| 1 or 2 Children | 0 (0.0%) | 0 (0.0%) |
| 3 or 4 Children | 0 (0.0%) | 0 (0.0%) |
| 5 or more Children | 0 (0.0%) | 0 (0.0%) |
| Total | 0 (0.0%) | 0 (0.0%) |
Race in Phippsburg
The most populous races in Phippsburg are , and White / Caucasian (345 | 100.0%).
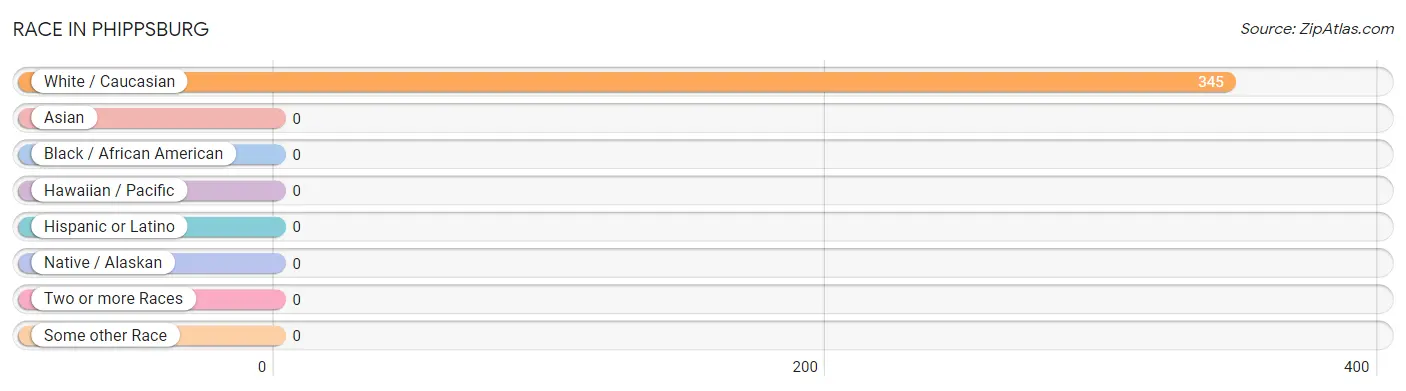
| Race | # Population | % Population |
| Asian | 0 | 0.0% |
| Black / African American | 0 | 0.0% |
| Hawaiian / Pacific | 0 | 0.0% |
| Hispanic or Latino | 0 | 0.0% |
| Native / Alaskan | 0 | 0.0% |
| White / Caucasian | 345 | 100.0% |
| Two or more Races | 0 | 0.0% |
| Some other Race | 0 | 0.0% |
| Total | 345 | 100.0% |
Ancestry in Phippsburg
The most populous ancestries reported in Phippsburg are German (54 | 15.7%), Italian (40 | 11.6%), English (33 | 9.6%), French Canadian (29 | 8.4%), and Finnish (28 | 8.1%), together accounting for 53.3% of all Phippsburg residents.
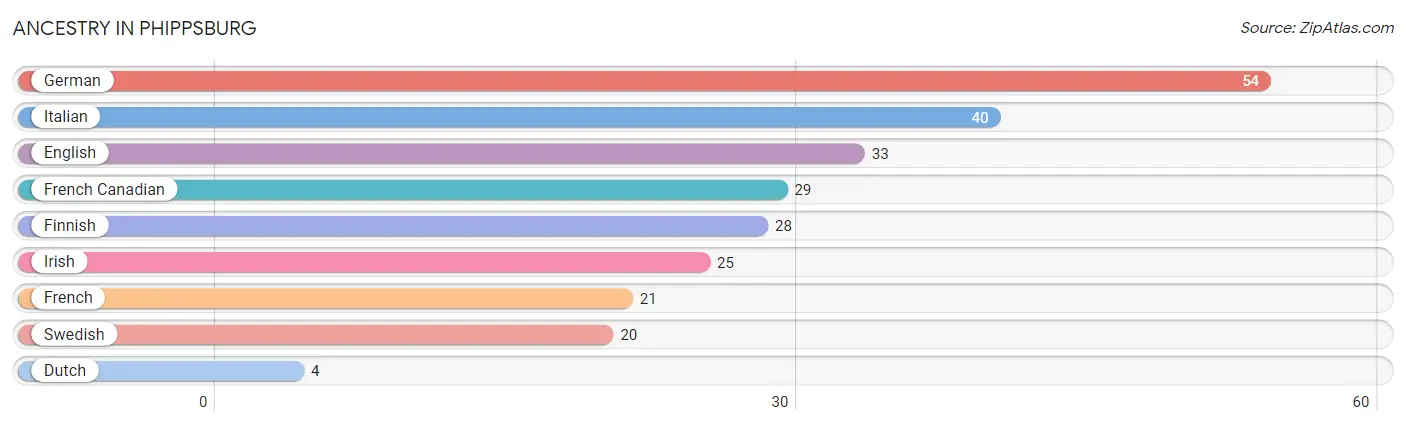
| Ancestry | # Population | % Population |
| Dutch | 4 | 1.2% |
| English | 33 | 9.6% |
| Finnish | 28 | 8.1% |
| French | 21 | 6.1% |
| French Canadian | 29 | 8.4% |
| German | 54 | 15.7% |
| Irish | 25 | 7.2% |
| Italian | 40 | 11.6% |
| Swedish | 20 | 5.8% | View All 9 Rows |
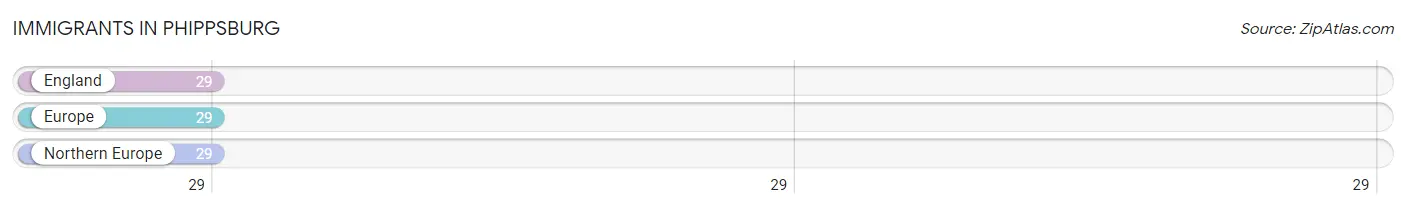
Immigrants in Phippsburg
The most numerous immigrant groups reported in Phippsburg came from England (29 | 8.4%), Europe (29 | 8.4%), and Northern Europe (29 | 8.4%), together accounting for 25.2% of all Phippsburg residents.
| Immigration Origin | # Population | % Population |
| England | 29 | 8.4% |
| Europe | 29 | 8.4% |
| Northern Europe | 29 | 8.4% | View All 3 Rows |
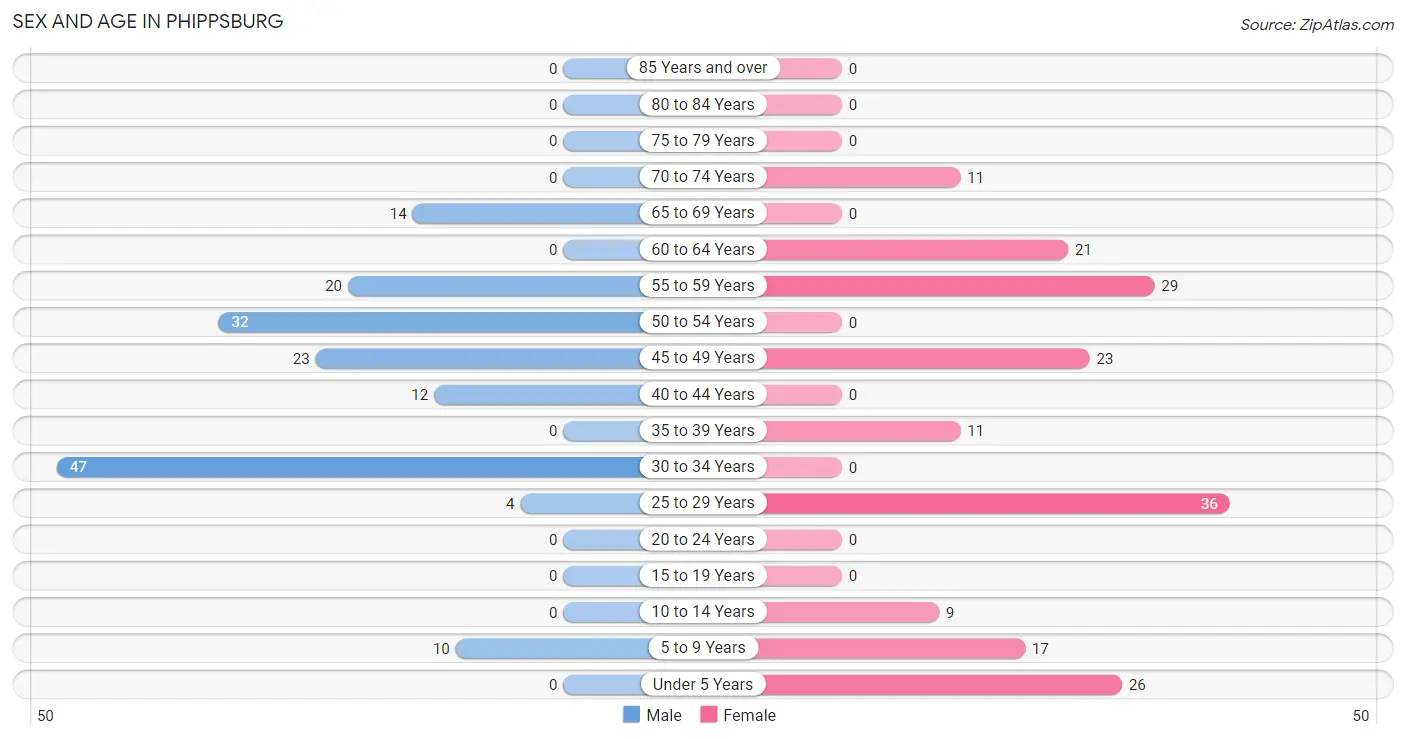
Sex and Age in Phippsburg
Sex and Age in Phippsburg
The most populous age groups in Phippsburg are 30 to 34 Years (47 | 29.0%) for men and 25 to 29 Years (36 | 19.7%) for women.
| Age Bracket | Male | Female |
| Under 5 Years | 0 (0.0%) | 26 (14.2%) |
| 5 to 9 Years | 10 (6.2%) | 17 (9.3%) |
| 10 to 14 Years | 0 (0.0%) | 9 (4.9%) |
| 15 to 19 Years | 0 (0.0%) | 0 (0.0%) |
| 20 to 24 Years | 0 (0.0%) | 0 (0.0%) |
| 25 to 29 Years | 4 (2.5%) | 36 (19.7%) |
| 30 to 34 Years | 47 (29.0%) | 0 (0.0%) |
| 35 to 39 Years | 0 (0.0%) | 11 (6.0%) |
| 40 to 44 Years | 12 (7.4%) | 0 (0.0%) |
| 45 to 49 Years | 23 (14.2%) | 23 (12.6%) |
| 50 to 54 Years | 32 (19.8%) | 0 (0.0%) |
| 55 to 59 Years | 20 (12.3%) | 29 (15.9%) |
| 60 to 64 Years | 0 (0.0%) | 21 (11.5%) |
| 65 to 69 Years | 14 (8.6%) | 0 (0.0%) |
| 70 to 74 Years | 0 (0.0%) | 11 (6.0%) |
| 75 to 79 Years | 0 (0.0%) | 0 (0.0%) |
| 80 to 84 Years | 0 (0.0%) | 0 (0.0%) |
| 85 Years and over | 0 (0.0%) | 0 (0.0%) |
| Total | 162 (100.0%) | 183 (100.0%) |
Families and Households in Phippsburg
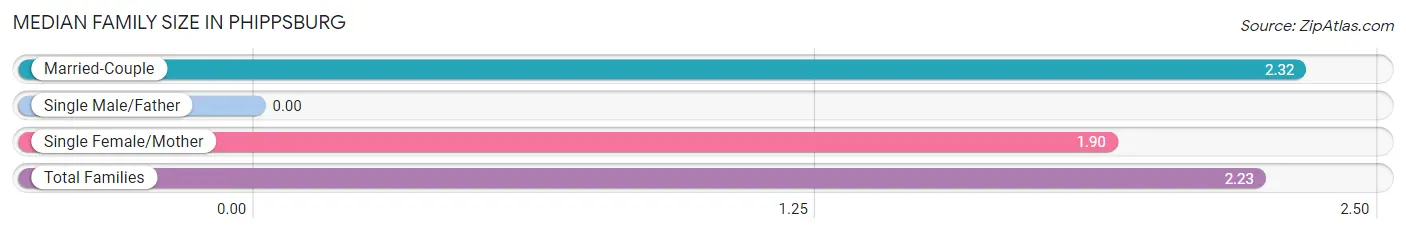
Median Family Size in Phippsburg
| Family Type | # Families | Family Size |
| Married-Couple | 103 (78.0%) | 2.32 |
| Single Male/Father | 0 (0.0%) | - |
| Single Female/Mother | 29 (22.0%) | 1.90 |
| Total Families | 132 (100.0%) | 2.23 |
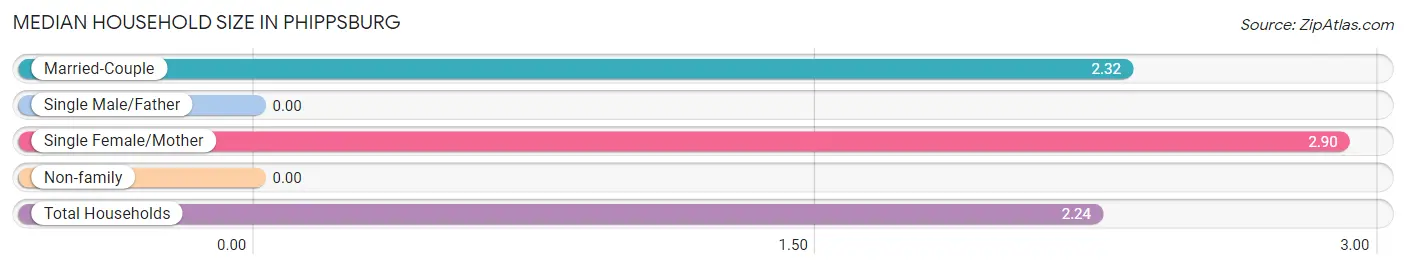
Median Household Size in Phippsburg
| Household Type | # Households | Household Size |
| Married-Couple | 103 (66.9%) | 2.32 |
| Single Male/Father | 0 (0.0%) | - |
| Single Female/Mother | 29 (18.8%) | 2.90 |
| Non-family | 22 (14.3%) | - |
| Total Households | 154 (100.0%) | 2.24 |
Household Size by Marriage Status in Phippsburg
Out of a total of 154 households in Phippsburg, 132 (85.7%) are family households, while 22 (14.3%) are nonfamily households. The most numerous type of family households are 2-person households, comprising 68, and the most common type of nonfamily households are 1-person households, comprising 22.
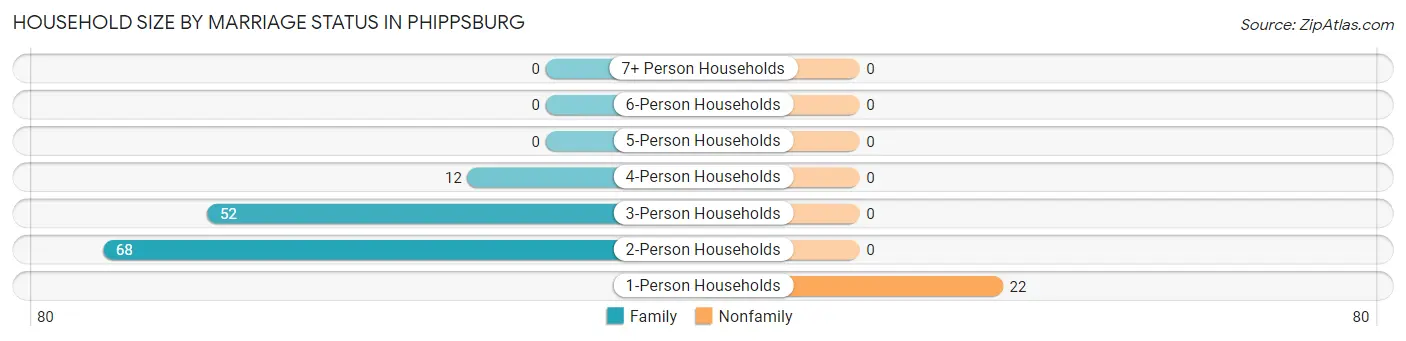
| Household Size | Family Households | Nonfamily Households |
| 1-Person Households | - | 22 (14.3%) |
| 2-Person Households | 68 (44.2%) | 0 (0.0%) |
| 3-Person Households | 52 (33.8%) | 0 (0.0%) |
| 4-Person Households | 12 (7.8%) | 0 (0.0%) |
| 5-Person Households | 0 (0.0%) | 0 (0.0%) |
| 6-Person Households | 0 (0.0%) | 0 (0.0%) |
| 7+ Person Households | 0 (0.0%) | 0 (0.0%) |
| Total | 132 (85.7%) | 22 (14.3%) |
Female Fertility in Phippsburg
Fertility by Age in Phippsburg
| Age Bracket | Women with Births | Births / 1,000 Women |
| 15 to 19 years | 0 (0.0%) | 0.0 |
| 20 to 34 years | 0 (0.0%) | 0.0 |
| 35 to 50 years | 0 (0.0%) | 0.0 |
| Total | 0 (0.0%) | 0.0 |
Fertility by Age by Marriage Status in Phippsburg
| Age Bracket | Married | Unmarried |
| 15 to 19 years | 0 (0.0%) | 0 (0.0%) |
| 20 to 34 years | 0 (0.0%) | 0 (0.0%) |
| 35 to 50 years | 0 (0.0%) | 0 (0.0%) |
| Total | 0 (0.0%) | 0 (0.0%) |
Fertility by Education in Phippsburg
| Educational Attainment | Women with Births | Births / 1,000 Women |
| Less than High School | 0 (0.0%) | 0.0 |
| High School Diploma | 0 (0.0%) | 0.0 |
| College or Associate's Degree | 0 (0.0%) | 0.0 |
| Bachelor's Degree | 0 (0.0%) | 0.0 |
| Graduate Degree | 0 (0.0%) | 0.0 |
| Total | 0 (0.0%) | 0.0 |
Fertility by Education by Marriage Status in Phippsburg
| Educational Attainment | Married | Unmarried |
| Less than High School | 0 (0.0%) | 0 (0.0%) |
| High School Diploma | 0 (0.0%) | 0 (0.0%) |
| College or Associate's Degree | 0 (0.0%) | 0 (0.0%) |
| Bachelor's Degree | 0 (0.0%) | 0 (0.0%) |
| Graduate Degree | 0 (0.0%) | 0 (0.0%) |
| Total | 0 (0.0%) | 0 (0.0%) |
Employment Characteristics in Phippsburg
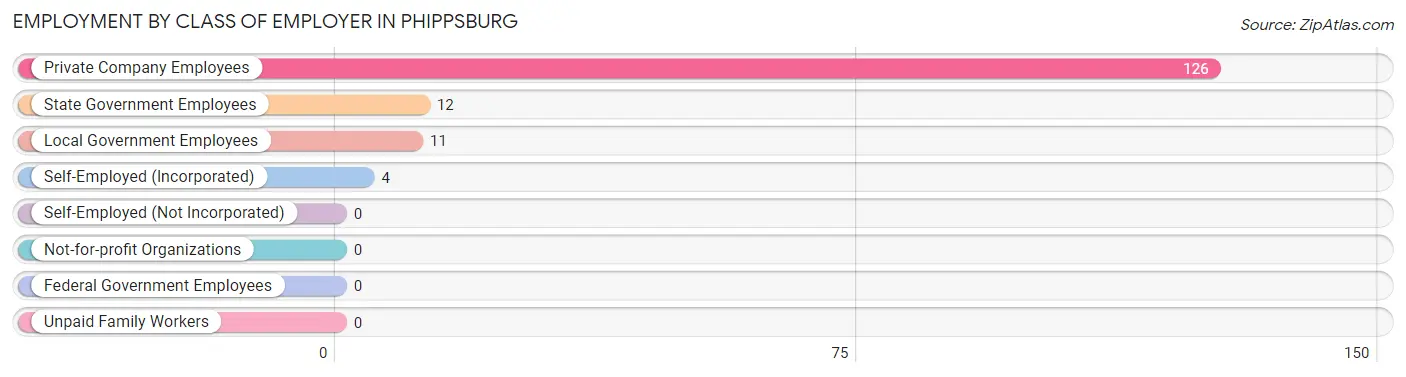
Employment by Class of Employer in Phippsburg
Among the 153 employed individuals in Phippsburg, private company employees (126 | 82.4%), state government employees (12 | 7.8%), and local government employees (11 | 7.2%) make up the most common classes of employment.
| Employer Class | # Employees | % Employees |
| Private Company Employees | 126 | 82.4% |
| Self-Employed (Incorporated) | 4 | 2.6% |
| Self-Employed (Not Incorporated) | 0 | 0.0% |
| Not-for-profit Organizations | 0 | 0.0% |
| Local Government Employees | 11 | 7.2% |
| State Government Employees | 12 | 7.8% |
| Federal Government Employees | 0 | 0.0% |
| Unpaid Family Workers | 0 | 0.0% |
| Total | 153 | 100.0% |
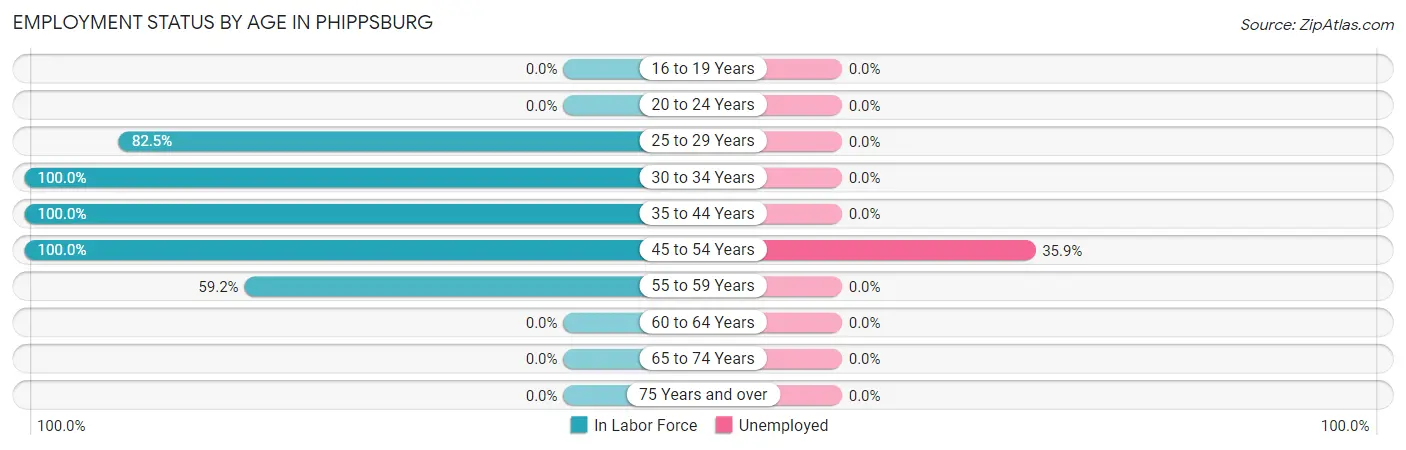
Employment Status by Age in Phippsburg
According to the labor force statistics for Phippsburg, out of the total population over 16 years of age (283), 74.2% or 210 individuals are in the labor force, with 13.3% or 28 of them unemployed. The age group with the highest labor force participation rate is 30 to 34 years, with 100.0% or 47 individuals in the labor force. Within the labor force, the 45 to 54 years age range has the highest percentage of unemployed individuals, with 35.9% or 28 of them being unemployed.
| Age Bracket | In Labor Force | Unemployed |
| 16 to 19 Years | 0 (0.0%) | 0 (0.0%) |
| 20 to 24 Years | 0 (0.0%) | 0 (0.0%) |
| 25 to 29 Years | 33 (82.5%) | 0 (0.0%) |
| 30 to 34 Years | 47 (100.0%) | 0 (0.0%) |
| 35 to 44 Years | 23 (100.0%) | 0 (0.0%) |
| 45 to 54 Years | 78 (100.0%) | 28 (35.9%) |
| 55 to 59 Years | 29 (59.2%) | 0 (0.0%) |
| 60 to 64 Years | 0 (0.0%) | 0 (0.0%) |
| 65 to 74 Years | 0 (0.0%) | 0 (0.0%) |
| 75 Years and over | 0 (0.0%) | 0 (0.0%) |
| Total | 210 (74.2%) | 28 (13.3%) |
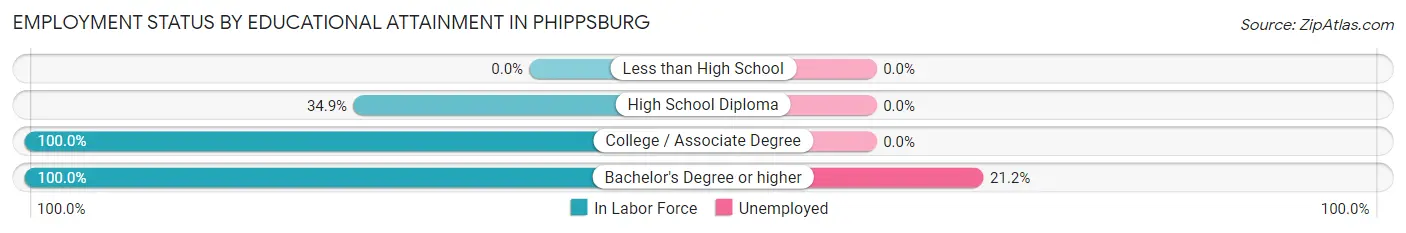
Employment Status by Educational Attainment in Phippsburg
According to labor force statistics for Phippsburg, 81.4% of individuals (210) out of the total population between 25 and 64 years of age (258) are in the labor force, with 13.3% or 28 of them being unemployed. The group with the highest labor force participation rate are those with the educational attainment of college / associate degree, with 100.0% or 56 individuals in the labor force. Within the labor force, individuals with bachelor's degree or higher education have the highest percentage of unemployment, with 21.2% or 28 of them being unemployed.
| Educational Attainment | In Labor Force | Unemployed |
| Less than High School | 0 (0.0%) | 0 (0.0%) |
| High School Diploma | 22 (34.9%) | 0 (0.0%) |
| College / Associate Degree | 56 (100.0%) | 0 (0.0%) |
| Bachelor's Degree or higher | 132 (100.0%) | 28 (21.2%) |
| Total | 210 (81.4%) | 34 (13.3%) |
Employment Occupations by Sex in Phippsburg
Management, Business, Science and Arts Occupations
The most common Management, Business, Science and Arts occupations in Phippsburg are , and Management (46 | 25.3%).
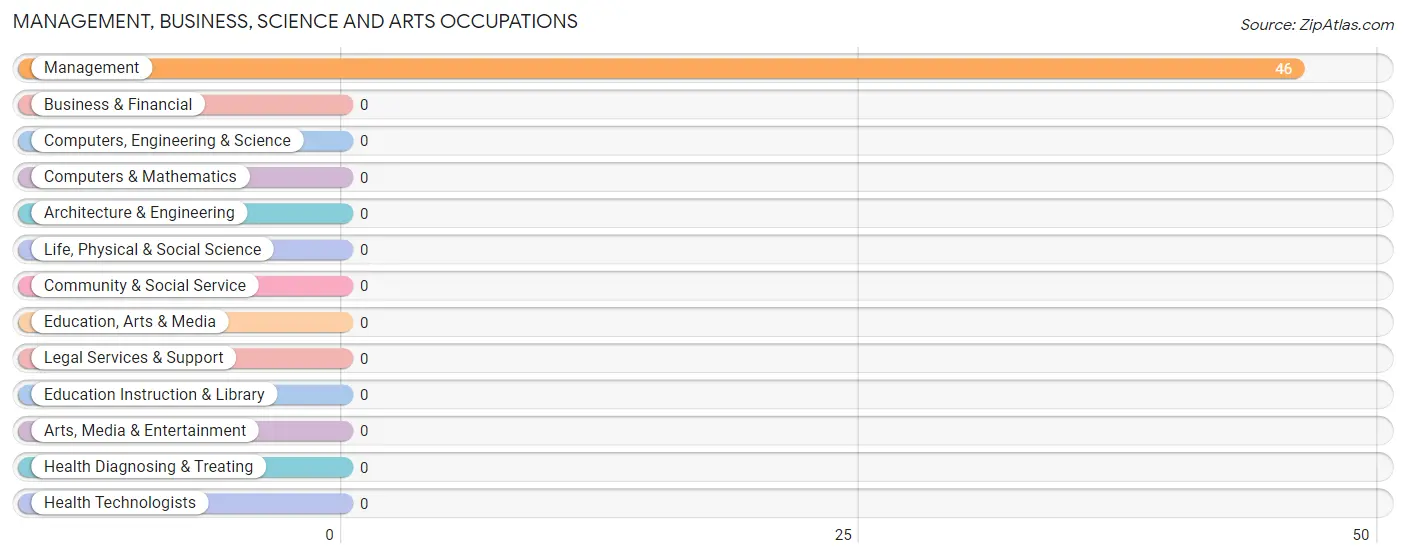
Management, Business, Science and Arts Occupations by Sex
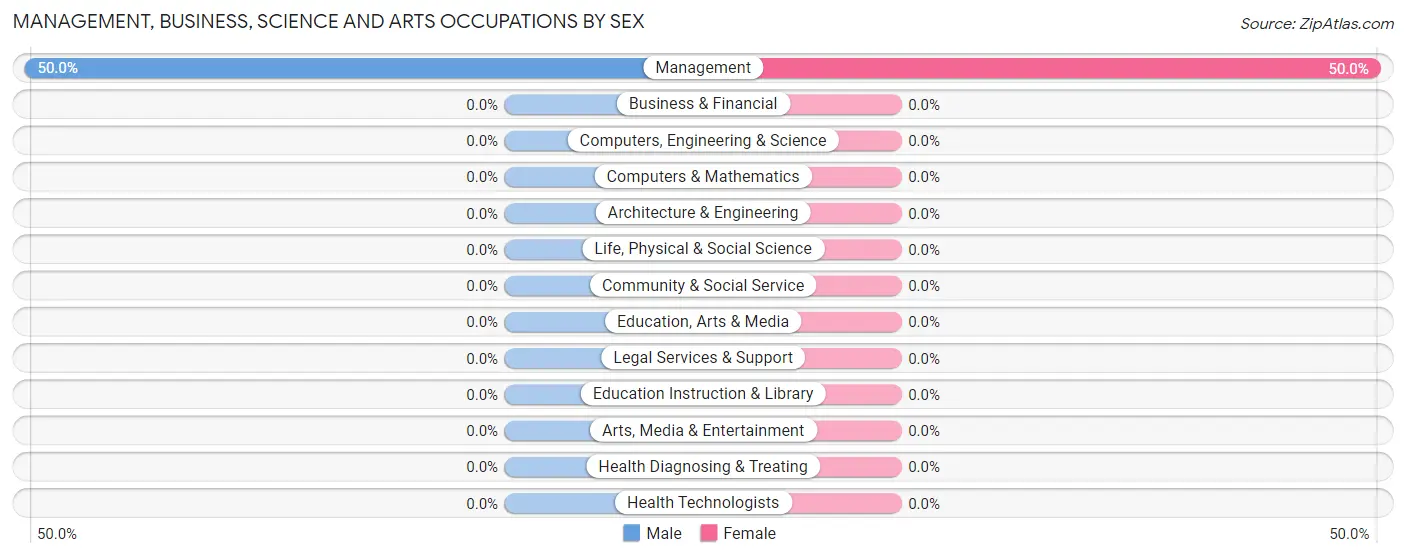
| Occupation | Male | Female |
| Management | 23 (50.0%) | 23 (50.0%) |
| Business & Financial | 0 (0.0%) | 0 (0.0%) |
| Computers, Engineering & Science | 0 (0.0%) | 0 (0.0%) |
| Computers & Mathematics | 0 (0.0%) | 0 (0.0%) |
| Architecture & Engineering | 0 (0.0%) | 0 (0.0%) |
| Life, Physical & Social Science | 0 (0.0%) | 0 (0.0%) |
| Community & Social Service | 0 (0.0%) | 0 (0.0%) |
| Education, Arts & Media | 0 (0.0%) | 0 (0.0%) |
| Legal Services & Support | 0 (0.0%) | 0 (0.0%) |
| Education Instruction & Library | 0 (0.0%) | 0 (0.0%) |
| Arts, Media & Entertainment | 0 (0.0%) | 0 (0.0%) |
| Health Diagnosing & Treating | 0 (0.0%) | 0 (0.0%) |
| Health Technologists | 0 (0.0%) | 0 (0.0%) |
| Total (Category) | 23 (50.0%) | 23 (50.0%) |
| Total (Overall) | 90 (49.4%) | 92 (50.5%) |
Services Occupations
The most common Services occupations in Phippsburg are Personal Care & Service (29 | 15.9%), and Food Preparation & Serving (11 | 6.0%).
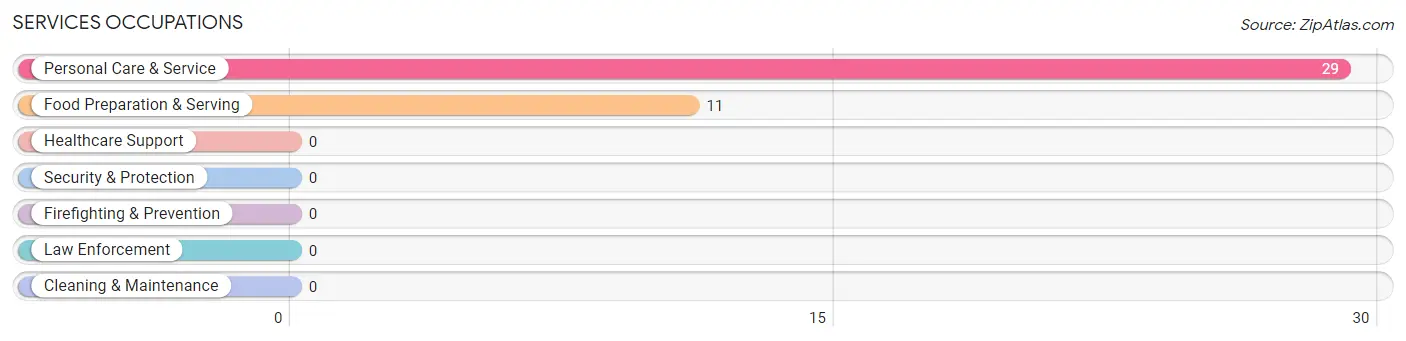
Services Occupations by Sex
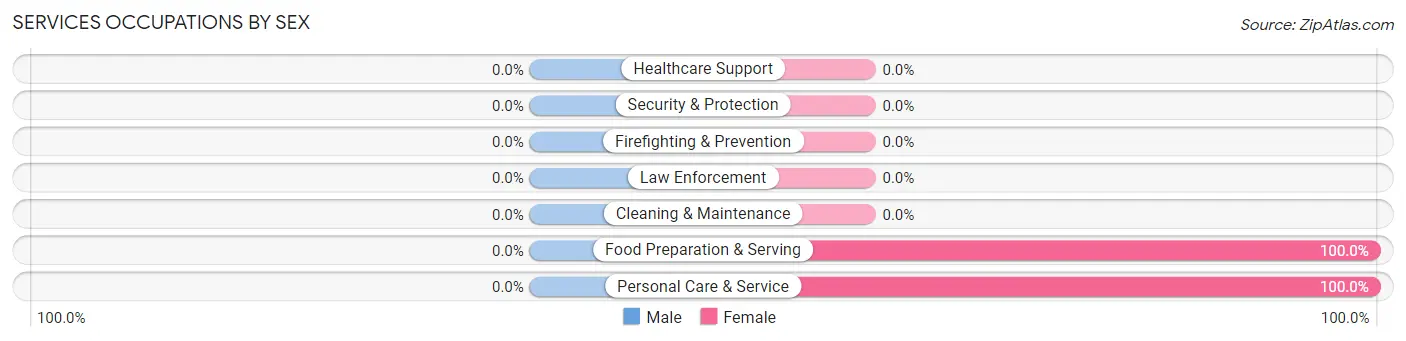
| Occupation | Male | Female |
| Healthcare Support | 0 (0.0%) | 0 (0.0%) |
| Security & Protection | 0 (0.0%) | 0 (0.0%) |
| Firefighting & Prevention | 0 (0.0%) | 0 (0.0%) |
| Law Enforcement | 0 (0.0%) | 0 (0.0%) |
| Food Preparation & Serving | 0 (0.0%) | 11 (100.0%) |
| Cleaning & Maintenance | 0 (0.0%) | 0 (0.0%) |
| Personal Care & Service | 0 (0.0%) | 29 (100.0%) |
| Total (Category) | 0 (0.0%) | 40 (100.0%) |
| Total (Overall) | 90 (49.4%) | 92 (50.5%) |
Sales and Office Occupations
Sales and Office Occupations by Sex
| Occupation | Male | Female |
| Sales & Related | 0 (0.0%) | 0 (0.0%) |
| Office & Administration | 0 (0.0%) | 0 (0.0%) |
| Total (Category) | 0 (0.0%) | 0 (0.0%) |
| Total (Overall) | 90 (49.4%) | 92 (50.5%) |
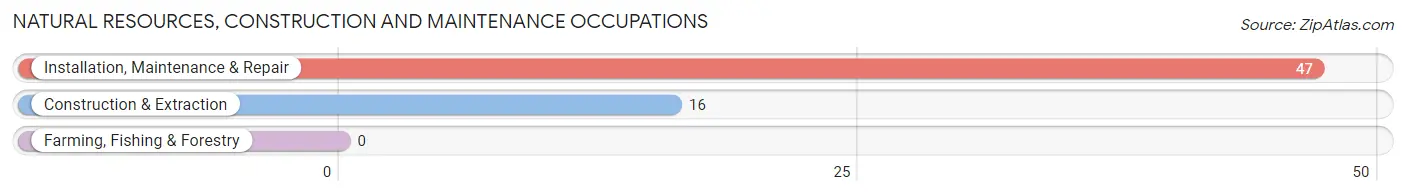
Natural Resources, Construction and Maintenance Occupations
The most common Natural Resources, Construction and Maintenance occupations in Phippsburg are Installation, Maintenance & Repair (47 | 25.8%), and Construction & Extraction (16 | 8.8%).
Natural Resources, Construction and Maintenance Occupations by Sex
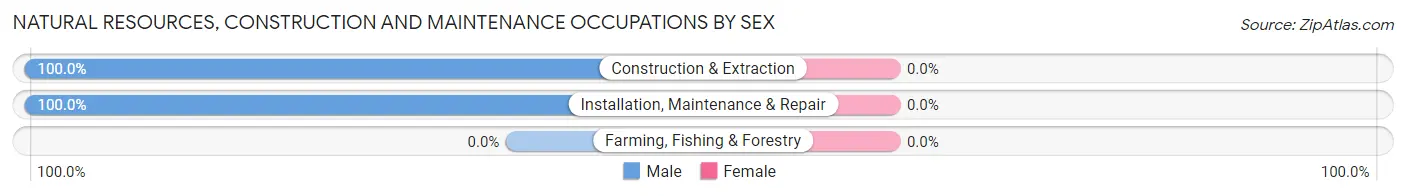
| Occupation | Male | Female |
| Farming, Fishing & Forestry | 0 (0.0%) | 0 (0.0%) |
| Construction & Extraction | 16 (100.0%) | 0 (0.0%) |
| Installation, Maintenance & Repair | 47 (100.0%) | 0 (0.0%) |
| Total (Category) | 63 (100.0%) | 0 (0.0%) |
| Total (Overall) | 90 (49.4%) | 92 (50.5%) |
Production, Transportation and Moving Occupations
The most common Production, Transportation and Moving occupations in Phippsburg are Production (29 | 15.9%), and Material Moving (4 | 2.2%).
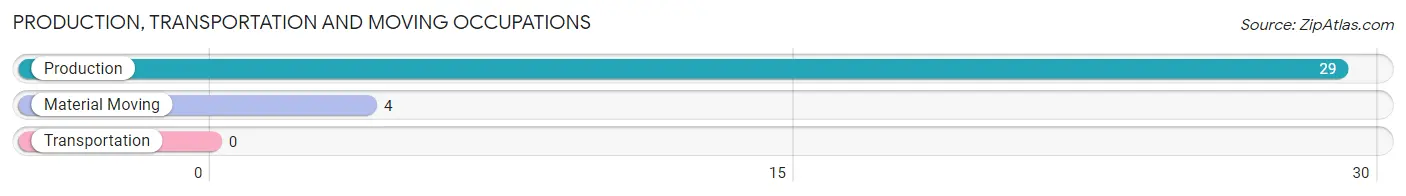
Production, Transportation and Moving Occupations by Sex
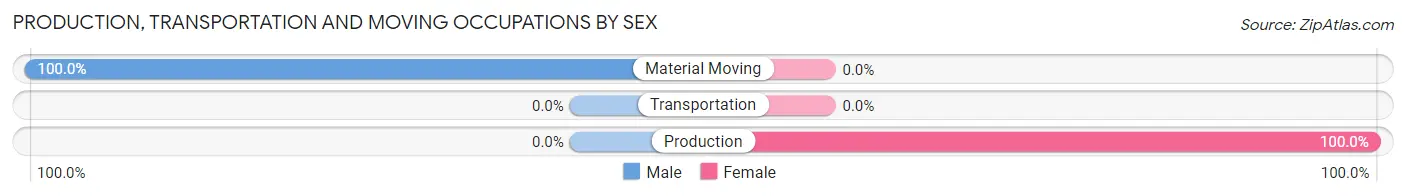
| Occupation | Male | Female |
| Production | 0 (0.0%) | 29 (100.0%) |
| Transportation | 0 (0.0%) | 0 (0.0%) |
| Material Moving | 4 (100.0%) | 0 (0.0%) |
| Total (Category) | 4 (12.1%) | 29 (87.9%) |
| Total (Overall) | 90 (49.4%) | 92 (50.5%) |
Employment Industries by Sex in Phippsburg
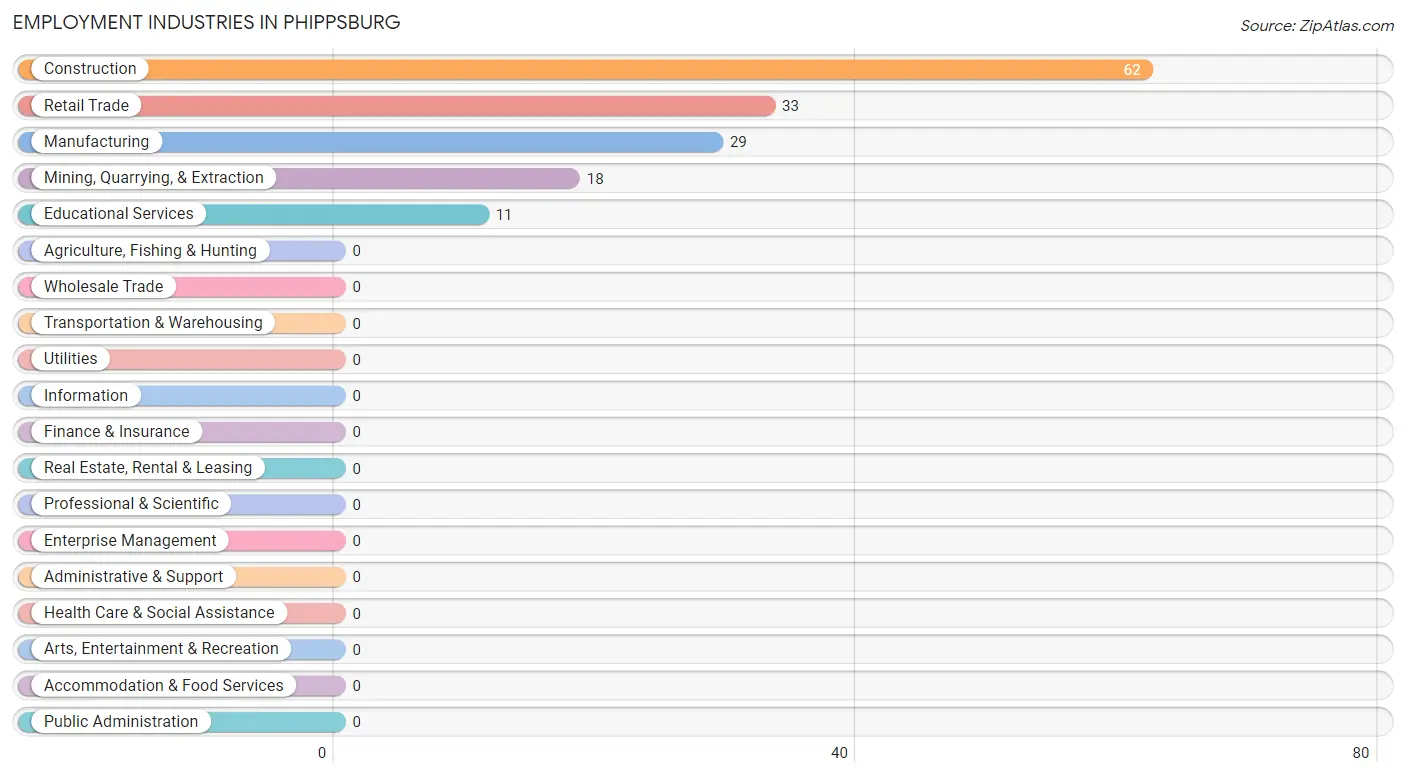
Employment Industries in Phippsburg
The major employment industries in Phippsburg include Construction (62 | 34.1%), Retail Trade (33 | 18.1%), Manufacturing (29 | 15.9%), Mining, Quarrying, & Extraction (18 | 9.9%), and Educational Services (11 | 6.0%).
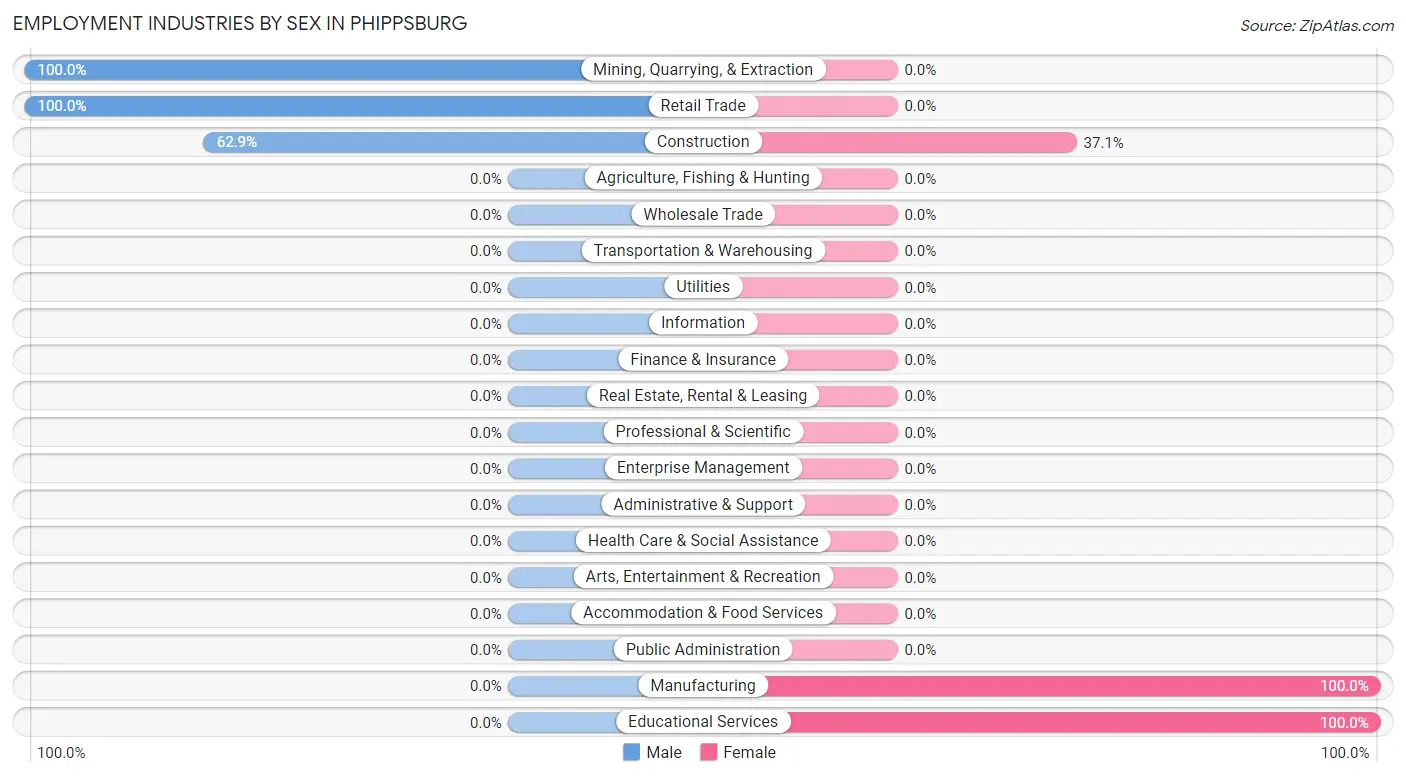
Employment Industries by Sex in Phippsburg
The Phippsburg industries that see more men than women are Mining, Quarrying, & Extraction (100.0%), Retail Trade (100.0%), and Construction (62.9%), whereas the industries that tend to have a higher number of women are Manufacturing (100.0%), Educational Services (100.0%), and Construction (37.1%).
| Industry | Male | Female |
| Agriculture, Fishing & Hunting | 0 (0.0%) | 0 (0.0%) |
| Mining, Quarrying, & Extraction | 18 (100.0%) | 0 (0.0%) |
| Construction | 39 (62.9%) | 23 (37.1%) |
| Manufacturing | 0 (0.0%) | 29 (100.0%) |
| Wholesale Trade | 0 (0.0%) | 0 (0.0%) |
| Retail Trade | 33 (100.0%) | 0 (0.0%) |
| Transportation & Warehousing | 0 (0.0%) | 0 (0.0%) |
| Utilities | 0 (0.0%) | 0 (0.0%) |
| Information | 0 (0.0%) | 0 (0.0%) |
| Finance & Insurance | 0 (0.0%) | 0 (0.0%) |
| Real Estate, Rental & Leasing | 0 (0.0%) | 0 (0.0%) |
| Professional & Scientific | 0 (0.0%) | 0 (0.0%) |
| Enterprise Management | 0 (0.0%) | 0 (0.0%) |
| Administrative & Support | 0 (0.0%) | 0 (0.0%) |
| Educational Services | 0 (0.0%) | 11 (100.0%) |
| Health Care & Social Assistance | 0 (0.0%) | 0 (0.0%) |
| Arts, Entertainment & Recreation | 0 (0.0%) | 0 (0.0%) |
| Accommodation & Food Services | 0 (0.0%) | 0 (0.0%) |
| Public Administration | 0 (0.0%) | 0 (0.0%) |
| Total | 90 (49.4%) | 92 (50.5%) |
Education in Phippsburg
School Enrollment in Phippsburg
The most common levels of schooling among the 62 students in Phippsburg are elementary school (27 | 43.5%), nursery / preschool (26 | 41.9%), and middle school (9 | 14.5%).
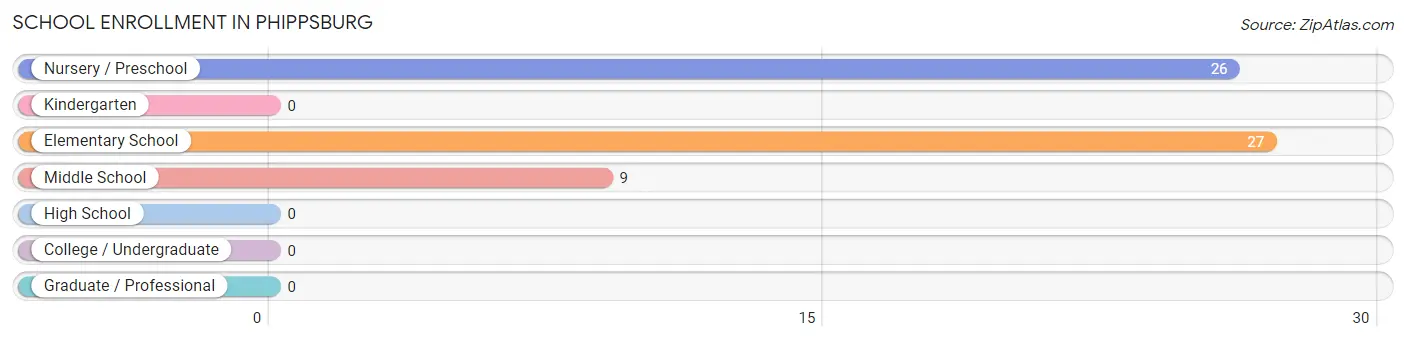
| School Level | # Students | % Students |
| Nursery / Preschool | 26 | 41.9% |
| Kindergarten | 0 | 0.0% |
| Elementary School | 27 | 43.5% |
| Middle School | 9 | 14.5% |
| High School | 0 | 0.0% |
| College / Undergraduate | 0 | 0.0% |
| Graduate / Professional | 0 | 0.0% |
| Total | 62 | 100.0% |
School Enrollment by Age by Funding Source in Phippsburg
Out of a total of 62 students who are enrolled in schools in Phippsburg, 26 (41.9%) attend a private institution, while the remaining 36 (58.1%) are enrolled in public schools. The age group of 3 to 4 year olds has the highest likelihood of being enrolled in private schools, with 26 (100.0% in the age bracket) enrolled. Conversely, the age group of 5 to 9 year old has the lowest likelihood of being enrolled in a private school, with 27 (100.0% in the age bracket) attending a public institution.
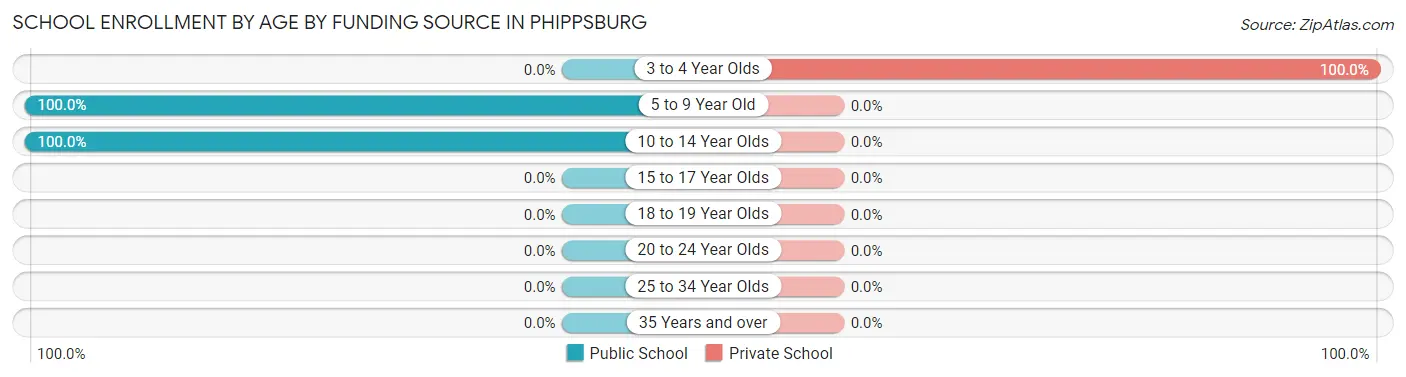
| Age Bracket | Public School | Private School |
| 3 to 4 Year Olds | 0 (0.0%) | 26 (100.0%) |
| 5 to 9 Year Old | 27 (100.0%) | 0 (0.0%) |
| 10 to 14 Year Olds | 9 (100.0%) | 0 (0.0%) |
| 15 to 17 Year Olds | 0 (0.0%) | 0 (0.0%) |
| 18 to 19 Year Olds | 0 (0.0%) | 0 (0.0%) |
| 20 to 24 Year Olds | 0 (0.0%) | 0 (0.0%) |
| 25 to 34 Year Olds | 0 (0.0%) | 0 (0.0%) |
| 35 Years and over | 0 (0.0%) | 0 (0.0%) |
| Total | 36 (58.1%) | 26 (41.9%) |
Educational Attainment by Field of Study in Phippsburg
Literature & languages (29 | 18.0%), visual & performing arts (29 | 18.0%), arts & humanities (29 | 18.0%), bio, nature & agricultural (28 | 17.4%), and psychology (23 | 14.3%) are the most common fields of study among 161 individuals in Phippsburg who have obtained a bachelor's degree or higher.
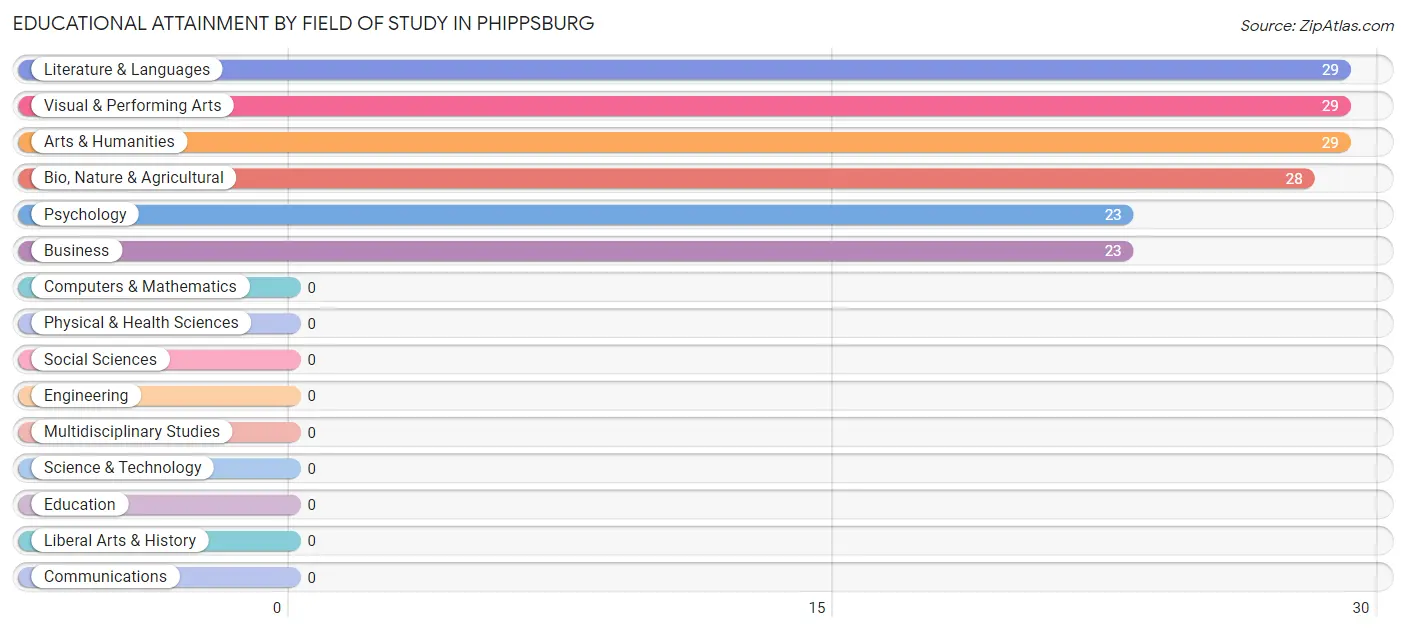
| Field of Study | # Graduates | % Graduates |
| Computers & Mathematics | 0 | 0.0% |
| Bio, Nature & Agricultural | 28 | 17.4% |
| Physical & Health Sciences | 0 | 0.0% |
| Psychology | 23 | 14.3% |
| Social Sciences | 0 | 0.0% |
| Engineering | 0 | 0.0% |
| Multidisciplinary Studies | 0 | 0.0% |
| Science & Technology | 0 | 0.0% |
| Business | 23 | 14.3% |
| Education | 0 | 0.0% |
| Literature & Languages | 29 | 18.0% |
| Liberal Arts & History | 0 | 0.0% |
| Visual & Performing Arts | 29 | 18.0% |
| Communications | 0 | 0.0% |
| Arts & Humanities | 29 | 18.0% |
| Total | 161 | 100.0% |
Transportation & Commute in Phippsburg
Vehicle Availability by Sex in Phippsburg
The most prevalent vehicle ownership categories in Phippsburg are males with 5 or more vehicles (41, accounting for 67.2%) and females with 5 or more vehicles (52, making up 44.6%).
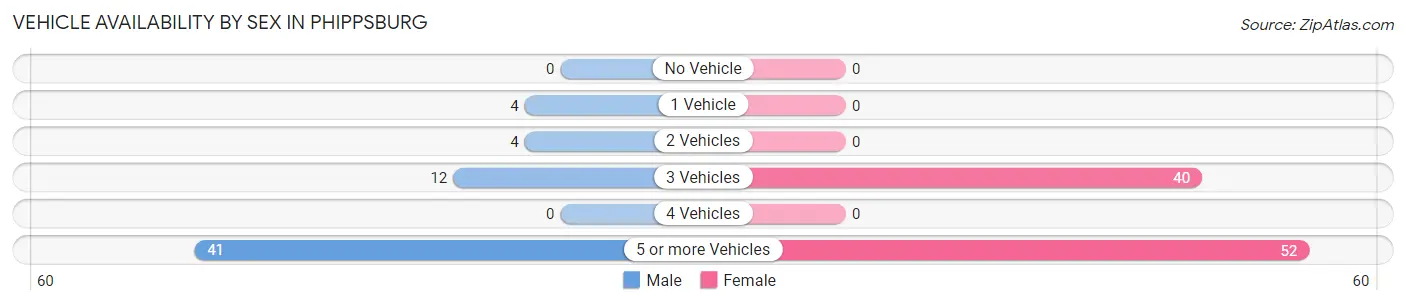
| Vehicles Available | Male | Female |
| No Vehicle | 0 (0.0%) | 0 (0.0%) |
| 1 Vehicle | 4 (6.6%) | 0 (0.0%) |
| 2 Vehicles | 4 (6.6%) | 0 (0.0%) |
| 3 Vehicles | 12 (19.7%) | 40 (43.5%) |
| 4 Vehicles | 0 (0.0%) | 0 (0.0%) |
| 5 or more Vehicles | 41 (67.2%) | 52 (56.5%) |
| Total | 61 (100.0%) | 92 (100.0%) |
Commute Time in Phippsburg
The most frequently occuring commute durations in Phippsburg are 10 to 14 minutes (58 commuters, 44.6%), 5 to 9 minutes (23 commuters, 17.7%), and 60 to 89 minutes (23 commuters, 17.7%).
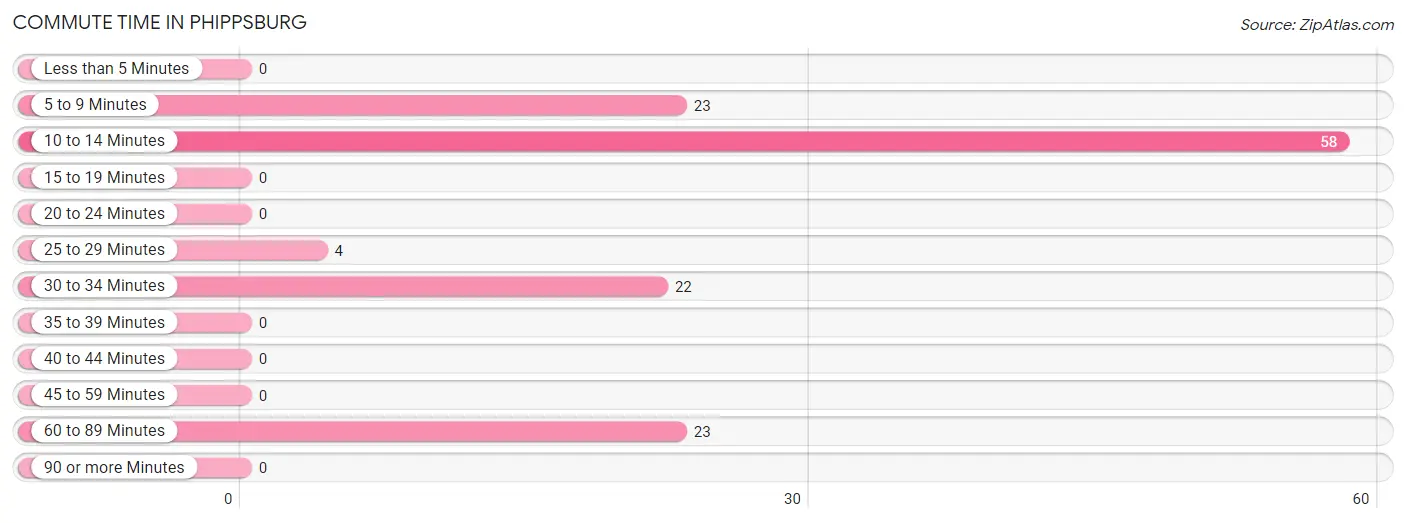
| Commute Time | # Commuters | % Commuters |
| Less than 5 Minutes | 0 | 0.0% |
| 5 to 9 Minutes | 23 | 17.7% |
| 10 to 14 Minutes | 58 | 44.6% |
| 15 to 19 Minutes | 0 | 0.0% |
| 20 to 24 Minutes | 0 | 0.0% |
| 25 to 29 Minutes | 4 | 3.1% |
| 30 to 34 Minutes | 22 | 16.9% |
| 35 to 39 Minutes | 0 | 0.0% |
| 40 to 44 Minutes | 0 | 0.0% |
| 45 to 59 Minutes | 0 | 0.0% |
| 60 to 89 Minutes | 23 | 17.7% |
| 90 or more Minutes | 0 | 0.0% |
Commute Time by Sex in Phippsburg
The most common commute times in Phippsburg are 60 to 89 minutes (23 commuters, 37.7%) for males and 10 to 14 minutes (58 commuters, 84.1%) for females.
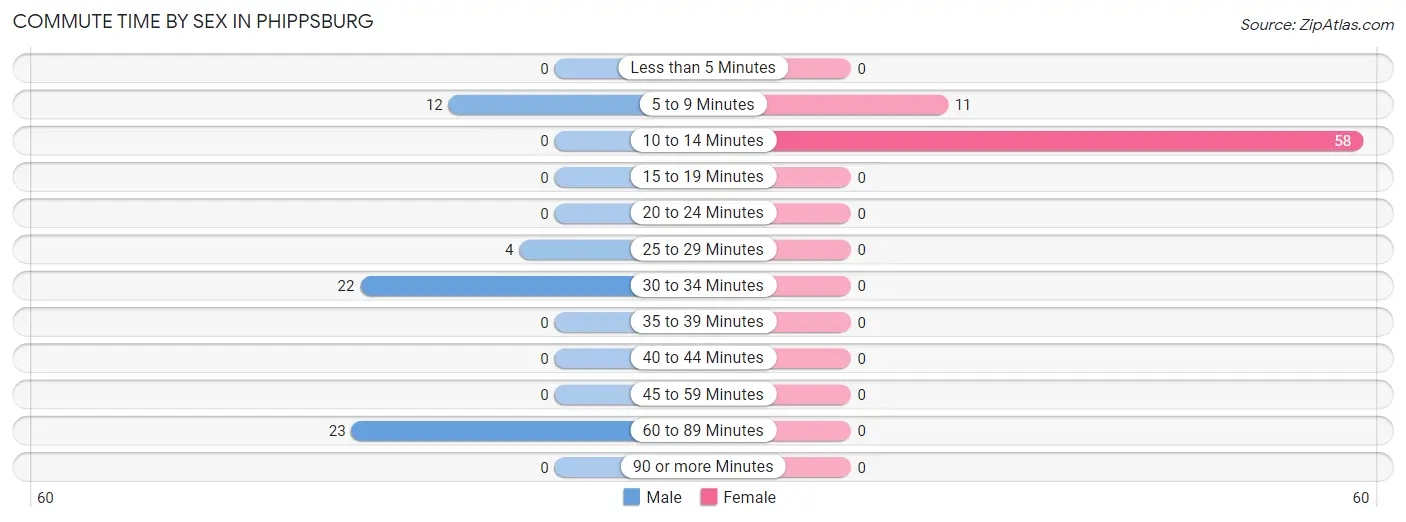
| Commute Time | Male | Female |
| Less than 5 Minutes | 0 (0.0%) | 0 (0.0%) |
| 5 to 9 Minutes | 12 (19.7%) | 11 (15.9%) |
| 10 to 14 Minutes | 0 (0.0%) | 58 (84.1%) |
| 15 to 19 Minutes | 0 (0.0%) | 0 (0.0%) |
| 20 to 24 Minutes | 0 (0.0%) | 0 (0.0%) |
| 25 to 29 Minutes | 4 (6.6%) | 0 (0.0%) |
| 30 to 34 Minutes | 22 (36.1%) | 0 (0.0%) |
| 35 to 39 Minutes | 0 (0.0%) | 0 (0.0%) |
| 40 to 44 Minutes | 0 (0.0%) | 0 (0.0%) |
| 45 to 59 Minutes | 0 (0.0%) | 0 (0.0%) |
| 60 to 89 Minutes | 23 (37.7%) | 0 (0.0%) |
| 90 or more Minutes | 0 (0.0%) | 0 (0.0%) |
Time of Departure to Work by Sex in Phippsburg
The most frequent times of departure to work in Phippsburg are 7:00 AM to 7:29 AM (45, 73.8%) for males and 12:00 AM to 4:59 AM (29, 42.0%) for females.
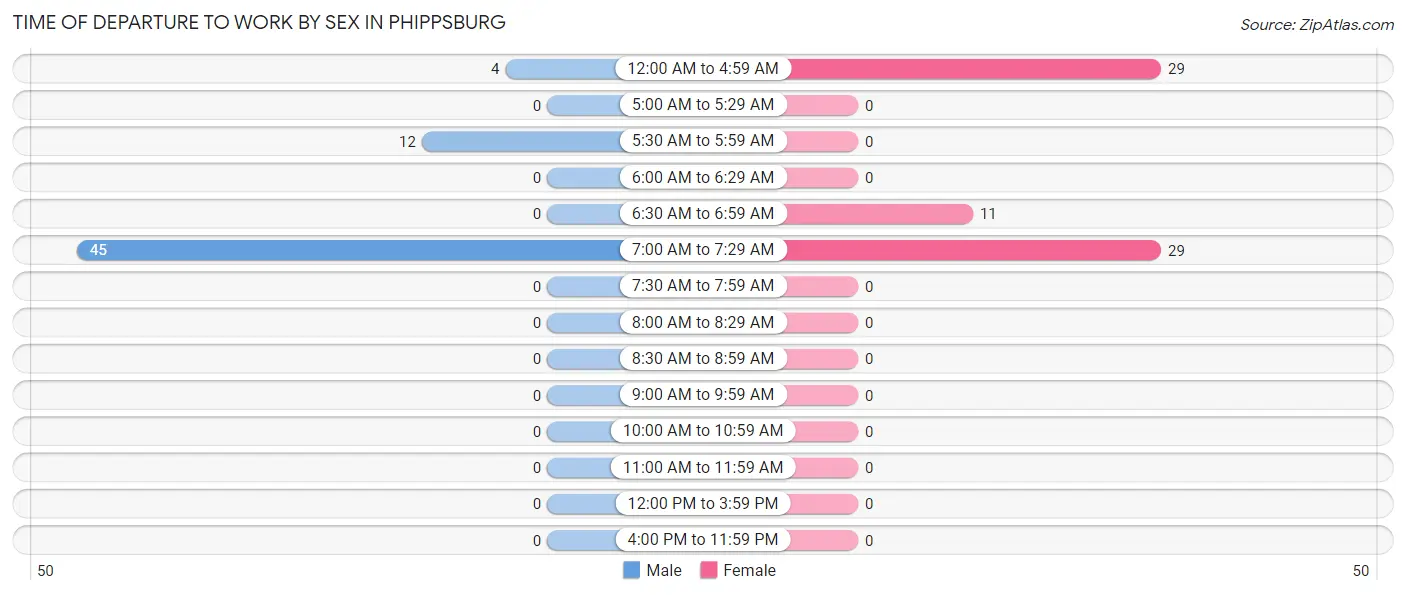
| Time of Departure | Male | Female |
| 12:00 AM to 4:59 AM | 4 (6.6%) | 29 (42.0%) |
| 5:00 AM to 5:29 AM | 0 (0.0%) | 0 (0.0%) |
| 5:30 AM to 5:59 AM | 12 (19.7%) | 0 (0.0%) |
| 6:00 AM to 6:29 AM | 0 (0.0%) | 0 (0.0%) |
| 6:30 AM to 6:59 AM | 0 (0.0%) | 11 (15.9%) |
| 7:00 AM to 7:29 AM | 45 (73.8%) | 29 (42.0%) |
| 7:30 AM to 7:59 AM | 0 (0.0%) | 0 (0.0%) |
| 8:00 AM to 8:29 AM | 0 (0.0%) | 0 (0.0%) |
| 8:30 AM to 8:59 AM | 0 (0.0%) | 0 (0.0%) |
| 9:00 AM to 9:59 AM | 0 (0.0%) | 0 (0.0%) |
| 10:00 AM to 10:59 AM | 0 (0.0%) | 0 (0.0%) |
| 11:00 AM to 11:59 AM | 0 (0.0%) | 0 (0.0%) |
| 12:00 PM to 3:59 PM | 0 (0.0%) | 0 (0.0%) |
| 4:00 PM to 11:59 PM | 0 (0.0%) | 0 (0.0%) |
| Total | 61 (100.0%) | 69 (100.0%) |
Housing Occupancy in Phippsburg
Occupancy by Ownership in Phippsburg
Of the total 154 dwellings in Phippsburg, owner-occupied units account for 125 (81.2%), while renter-occupied units make up 29 (18.8%).
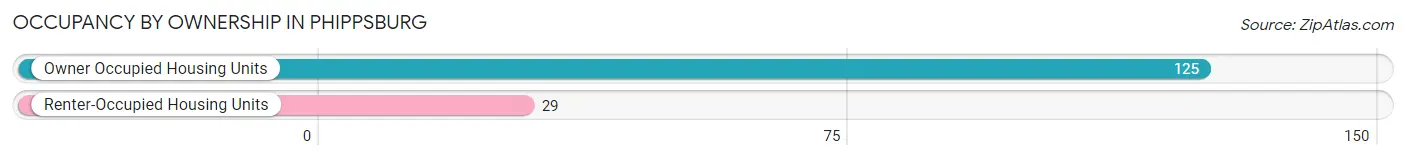
| Occupancy | # Housing Units | % Housing Units |
| Owner Occupied Housing Units | 125 | 81.2% |
| Renter-Occupied Housing Units | 29 | 18.8% |
| Total Occupied Housing Units | 154 | 100.0% |
Occupancy by Household Size in Phippsburg
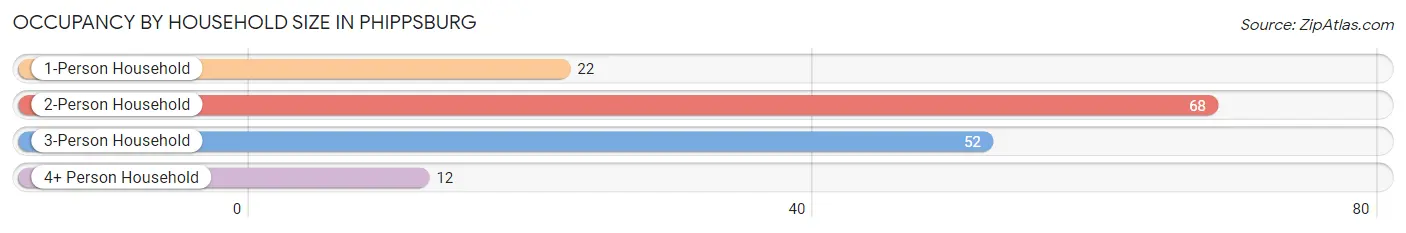
| Household Size | # Housing Units | % Housing Units |
| 1-Person Household | 22 | 14.3% |
| 2-Person Household | 68 | 44.2% |
| 3-Person Household | 52 | 33.8% |
| 4+ Person Household | 12 | 7.8% |
| Total Housing Units | 154 | 100.0% |
Occupancy by Ownership by Household Size in Phippsburg
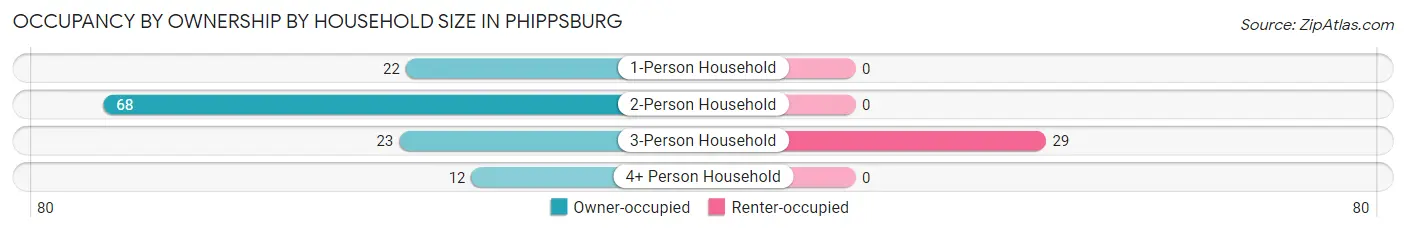
| Household Size | Owner-occupied | Renter-occupied |
| 1-Person Household | 22 (100.0%) | 0 (0.0%) |
| 2-Person Household | 68 (100.0%) | 0 (0.0%) |
| 3-Person Household | 23 (44.2%) | 29 (55.8%) |
| 4+ Person Household | 12 (100.0%) | 0 (0.0%) |
| Total Housing Units | 125 (81.2%) | 29 (18.8%) |
Occupancy by Educational Attainment in Phippsburg
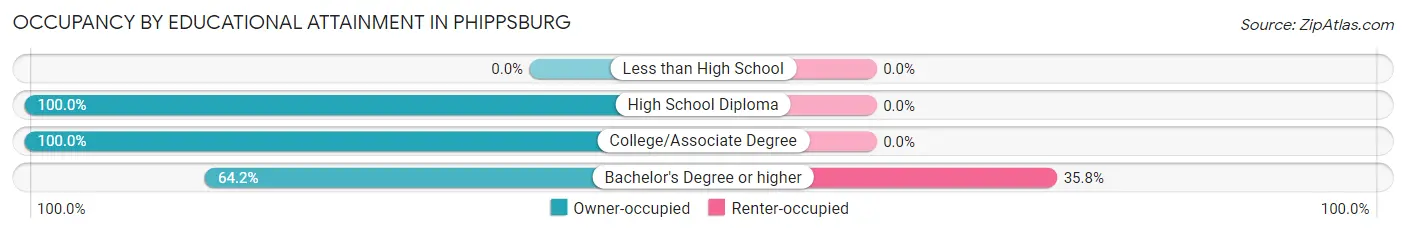
| Household Size | Owner-occupied | Renter-occupied |
| Less than High School | 0 (0.0%) | 0 (0.0%) |
| High School Diploma | 57 (100.0%) | 0 (0.0%) |
| College/Associate Degree | 16 (100.0%) | 0 (0.0%) |
| Bachelor's Degree or higher | 52 (64.2%) | 29 (35.8%) |
Occupancy by Age of Householder in Phippsburg
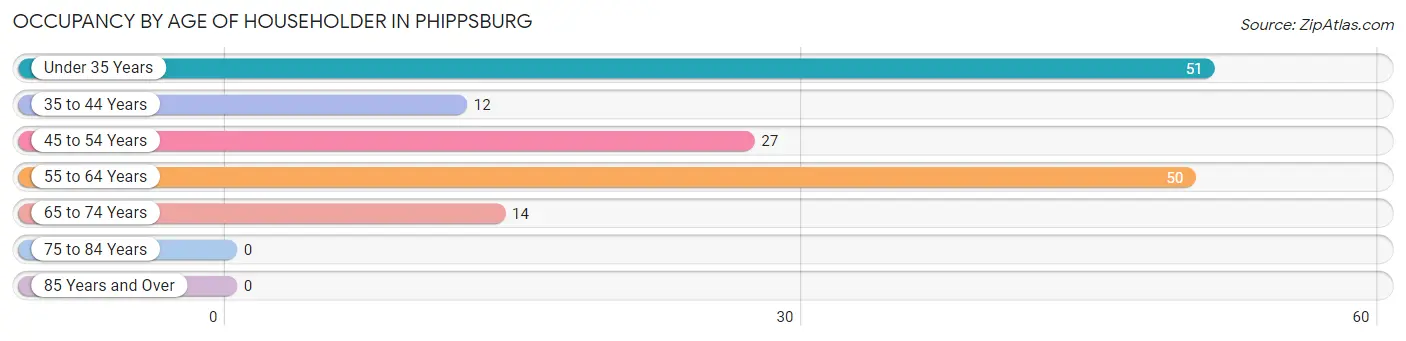
| Age Bracket | # Households | % Households |
| Under 35 Years | 51 | 33.1% |
| 35 to 44 Years | 12 | 7.8% |
| 45 to 54 Years | 27 | 17.5% |
| 55 to 64 Years | 50 | 32.5% |
| 65 to 74 Years | 14 | 9.1% |
| 75 to 84 Years | 0 | 0.0% |
| 85 Years and Over | 0 | 0.0% |
| Total | 154 | 100.0% |
Housing Finances in Phippsburg
Median Income by Occupancy in Phippsburg
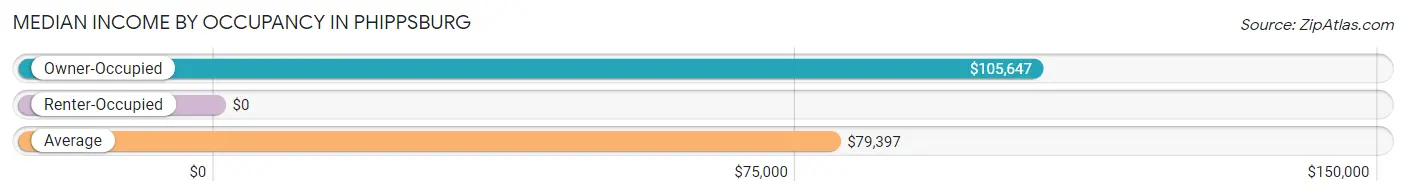
| Occupancy Type | # Households | Median Income |
| Owner-Occupied | 125 (81.2%) | $105,647 |
| Renter-Occupied | 29 (18.8%) | $0 |
| Average | 154 (100.0%) | $79,397 |
Occupancy by Householder Income Bracket in Phippsburg
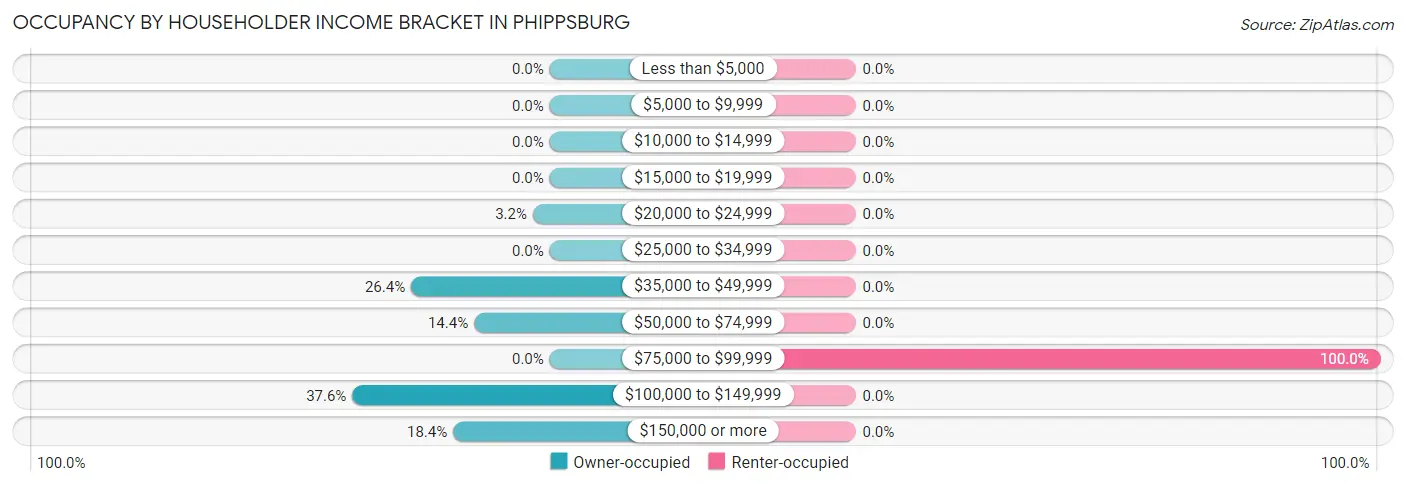
| Income Bracket | Owner-occupied | Renter-occupied |
| Less than $5,000 | 0 (0.0%) | 0 (0.0%) |
| $5,000 to $9,999 | 0 (0.0%) | 0 (0.0%) |
| $10,000 to $14,999 | 0 (0.0%) | 0 (0.0%) |
| $15,000 to $19,999 | 0 (0.0%) | 0 (0.0%) |
| $20,000 to $24,999 | 4 (3.2%) | 0 (0.0%) |
| $25,000 to $34,999 | 0 (0.0%) | 0 (0.0%) |
| $35,000 to $49,999 | 33 (26.4%) | 0 (0.0%) |
| $50,000 to $74,999 | 18 (14.4%) | 0 (0.0%) |
| $75,000 to $99,999 | 0 (0.0%) | 29 (100.0%) |
| $100,000 to $149,999 | 47 (37.6%) | 0 (0.0%) |
| $150,000 or more | 23 (18.4%) | 0 (0.0%) |
| Total | 125 (100.0%) | 29 (100.0%) |
Monthly Housing Cost Tiers in Phippsburg
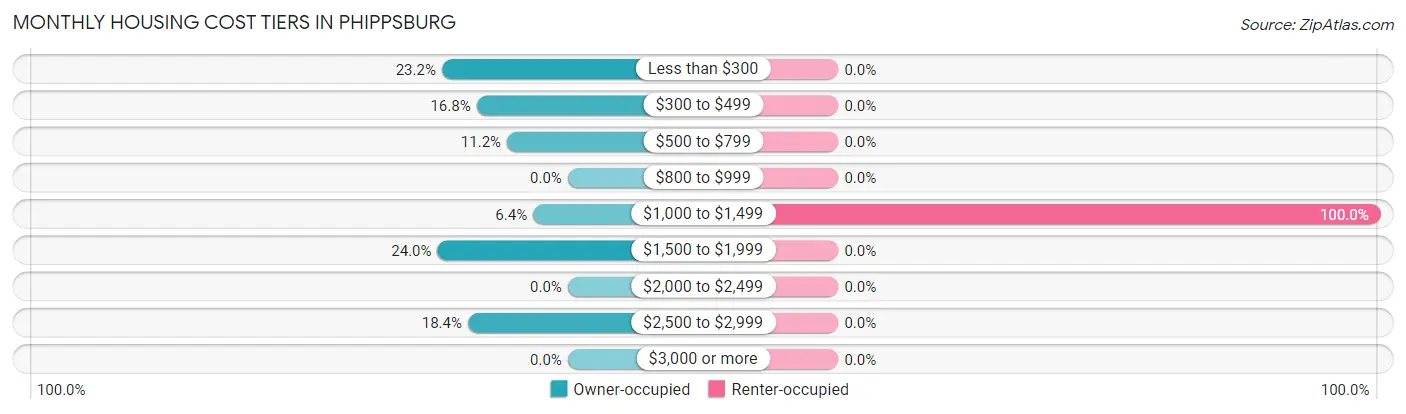
| Monthly Cost | Owner-occupied | Renter-occupied |
| Less than $300 | 29 (23.2%) | 0 (0.0%) |
| $300 to $499 | 21 (16.8%) | 0 (0.0%) |
| $500 to $799 | 14 (11.2%) | 0 (0.0%) |
| $800 to $999 | 0 (0.0%) | 0 (0.0%) |
| $1,000 to $1,499 | 8 (6.4%) | 29 (100.0%) |
| $1,500 to $1,999 | 30 (24.0%) | 0 (0.0%) |
| $2,000 to $2,499 | 0 (0.0%) | 0 (0.0%) |
| $2,500 to $2,999 | 23 (18.4%) | 0 (0.0%) |
| $3,000 or more | 0 (0.0%) | 0 (0.0%) |
| Total | 125 (100.0%) | 29 (100.0%) |
Physical Housing Characteristics in Phippsburg
Housing Structures in Phippsburg
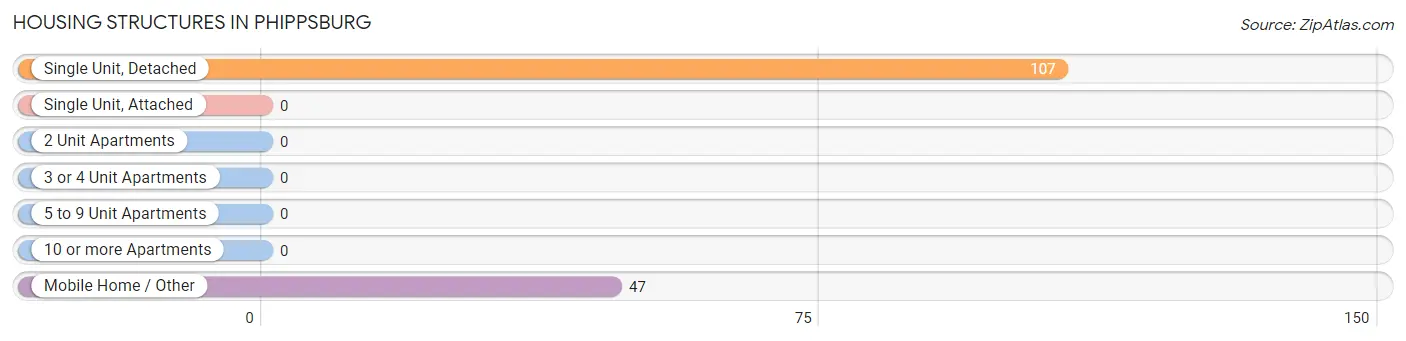
| Structure Type | # Housing Units | % Housing Units |
| Single Unit, Detached | 107 | 69.5% |
| Single Unit, Attached | 0 | 0.0% |
| 2 Unit Apartments | 0 | 0.0% |
| 3 or 4 Unit Apartments | 0 | 0.0% |
| 5 to 9 Unit Apartments | 0 | 0.0% |
| 10 or more Apartments | 0 | 0.0% |
| Mobile Home / Other | 47 | 30.5% |
| Total | 154 | 100.0% |
Housing Structures by Occupancy in Phippsburg
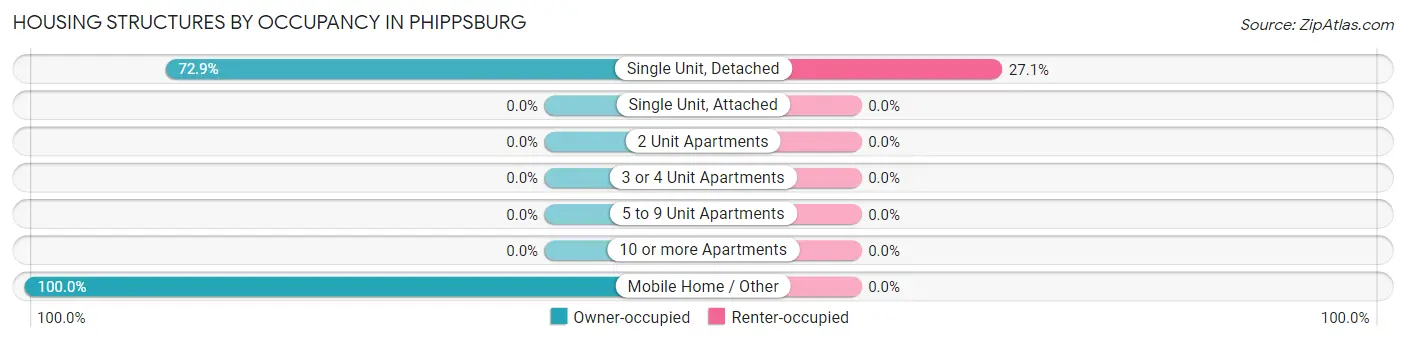
| Structure Type | Owner-occupied | Renter-occupied |
| Single Unit, Detached | 78 (72.9%) | 29 (27.1%) |
| Single Unit, Attached | 0 (0.0%) | 0 (0.0%) |
| 2 Unit Apartments | 0 (0.0%) | 0 (0.0%) |
| 3 or 4 Unit Apartments | 0 (0.0%) | 0 (0.0%) |
| 5 to 9 Unit Apartments | 0 (0.0%) | 0 (0.0%) |
| 10 or more Apartments | 0 (0.0%) | 0 (0.0%) |
| Mobile Home / Other | 47 (100.0%) | 0 (0.0%) |
| Total | 125 (81.2%) | 29 (18.8%) |
Housing Structures by Number of Rooms in Phippsburg
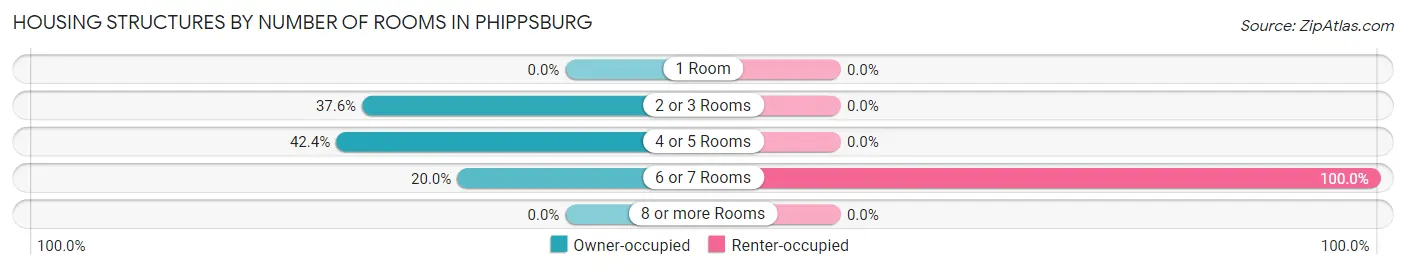
| Number of Rooms | Owner-occupied | Renter-occupied |
| 1 Room | 0 (0.0%) | 0 (0.0%) |
| 2 or 3 Rooms | 47 (37.6%) | 0 (0.0%) |
| 4 or 5 Rooms | 53 (42.4%) | 0 (0.0%) |
| 6 or 7 Rooms | 25 (20.0%) | 29 (100.0%) |
| 8 or more Rooms | 0 (0.0%) | 0 (0.0%) |
| Total | 125 (100.0%) | 29 (100.0%) |
Housing Structure by Heating Type in Phippsburg
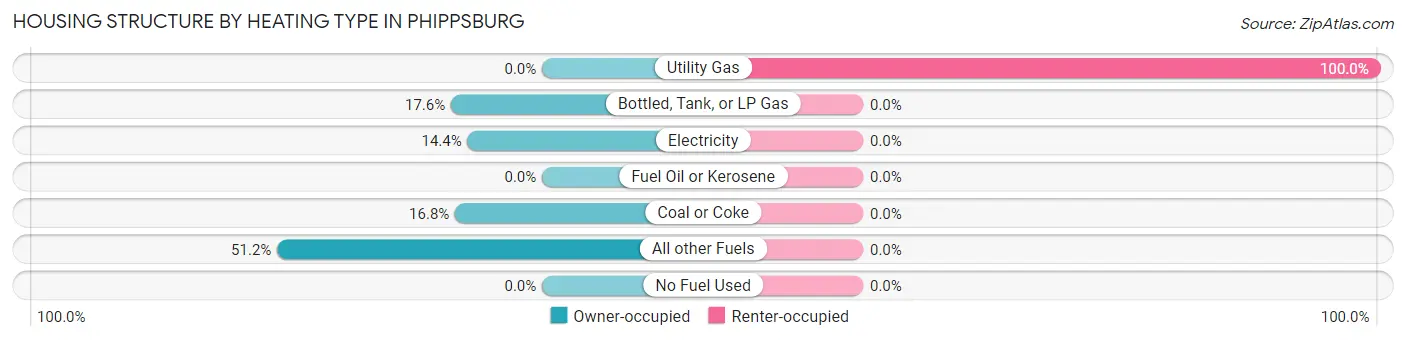
| Heating Type | Owner-occupied | Renter-occupied |
| Utility Gas | 0 (0.0%) | 29 (100.0%) |
| Bottled, Tank, or LP Gas | 22 (17.6%) | 0 (0.0%) |
| Electricity | 18 (14.4%) | 0 (0.0%) |
| Fuel Oil or Kerosene | 0 (0.0%) | 0 (0.0%) |
| Coal or Coke | 21 (16.8%) | 0 (0.0%) |
| All other Fuels | 64 (51.2%) | 0 (0.0%) |
| No Fuel Used | 0 (0.0%) | 0 (0.0%) |
| Total | 125 (100.0%) | 29 (100.0%) |
Household Vehicle Usage in Phippsburg
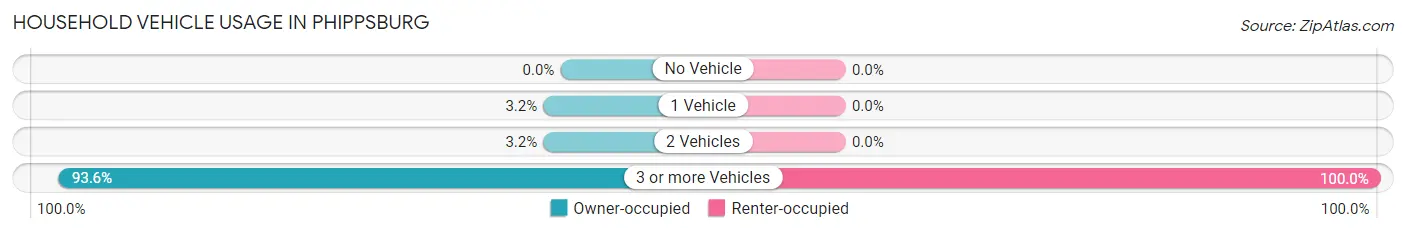
| Vehicles per Household | Owner-occupied | Renter-occupied |
| No Vehicle | 0 (0.0%) | 0 (0.0%) |
| 1 Vehicle | 4 (3.2%) | 0 (0.0%) |
| 2 Vehicles | 4 (3.2%) | 0 (0.0%) |
| 3 or more Vehicles | 117 (93.6%) | 29 (100.0%) |
| Total | 125 (100.0%) | 29 (100.0%) |
Real Estate & Mortgages in Phippsburg
Real Estate and Mortgage Overview in Phippsburg
| Characteristic | Without Mortgage | With Mortgage |
| Housing Units | 64 | 61 |
| Median Property Value | $281,000 | $0 |
| Median Household Income | $74,464 | $23 |
| Monthly Housing Costs | $357 | $0 |
| Real Estate Taxes | $524 | $0 |
Property Value by Mortgage Status in Phippsburg
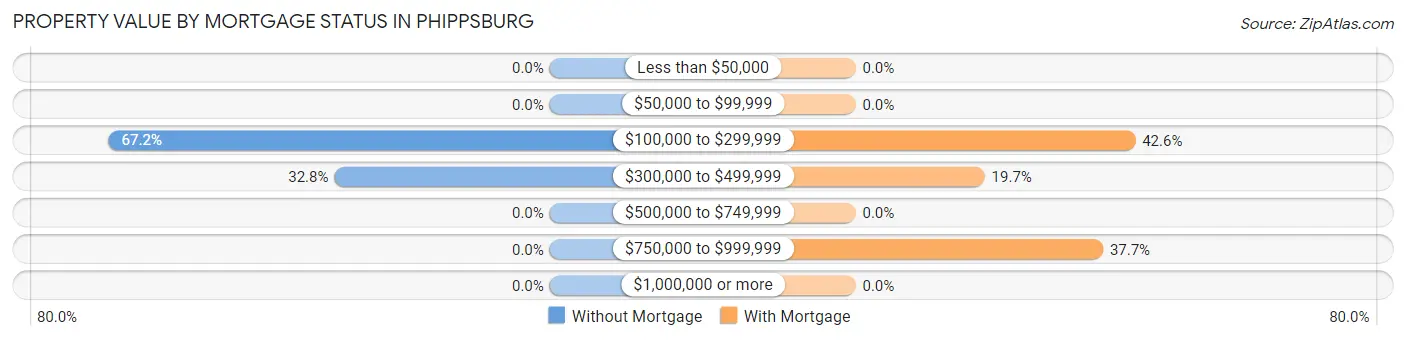
| Property Value | Without Mortgage | With Mortgage |
| Less than $50,000 | 0 (0.0%) | 0 (0.0%) |
| $50,000 to $99,999 | 0 (0.0%) | 0 (0.0%) |
| $100,000 to $299,999 | 43 (67.2%) | 26 (42.6%) |
| $300,000 to $499,999 | 21 (32.8%) | 12 (19.7%) |
| $500,000 to $749,999 | 0 (0.0%) | 0 (0.0%) |
| $750,000 to $999,999 | 0 (0.0%) | 23 (37.7%) |
| $1,000,000 or more | 0 (0.0%) | 0 (0.0%) |
| Total | 64 (100.0%) | 61 (100.0%) |
Household Income by Mortgage Status in Phippsburg
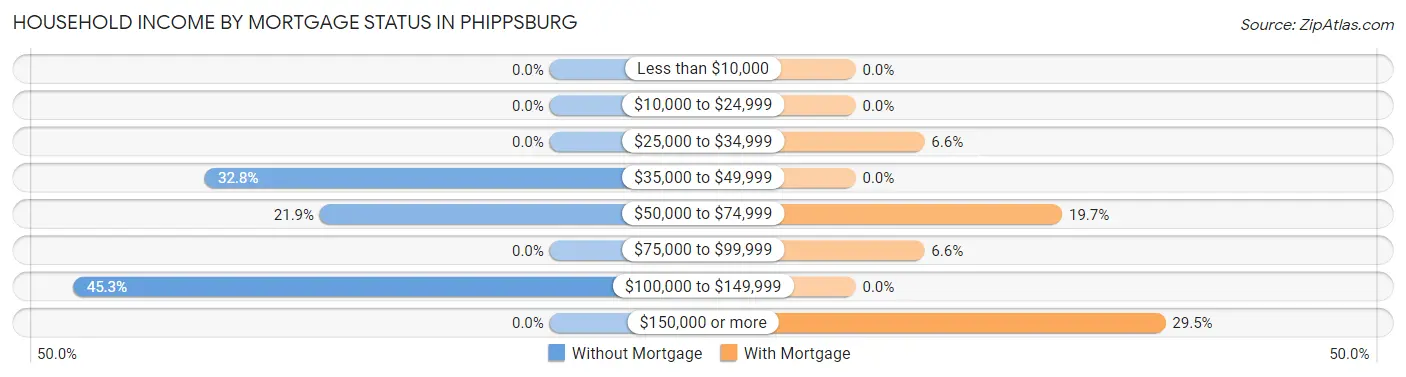
| Household Income | Without Mortgage | With Mortgage |
| Less than $10,000 | 0 (0.0%) | 0 (0.0%) |
| $10,000 to $24,999 | 0 (0.0%) | 0 (0.0%) |
| $25,000 to $34,999 | 0 (0.0%) | 4 (6.6%) |
| $35,000 to $49,999 | 21 (32.8%) | 0 (0.0%) |
| $50,000 to $74,999 | 14 (21.9%) | 12 (19.7%) |
| $75,000 to $99,999 | 0 (0.0%) | 4 (6.6%) |
| $100,000 to $149,999 | 29 (45.3%) | 0 (0.0%) |
| $150,000 or more | 0 (0.0%) | 18 (29.5%) |
| Total | 64 (100.0%) | 61 (100.0%) |
Property Value to Household Income Ratio in Phippsburg
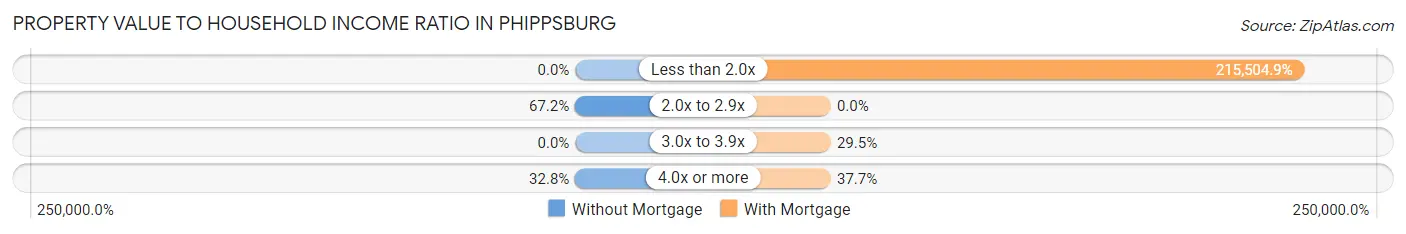
| Value-to-Income Ratio | Without Mortgage | With Mortgage |
| Less than 2.0x | 0 (0.0%) | 131,458 (215,504.9%) |
| 2.0x to 2.9x | 43 (67.2%) | 0 (0.0%) |
| 3.0x to 3.9x | 0 (0.0%) | 18 (29.5%) |
| 4.0x or more | 21 (32.8%) | 23 (37.7%) |
| Total | 64 (100.0%) | 61 (100.0%) |
Real Estate Taxes by Mortgage Status in Phippsburg
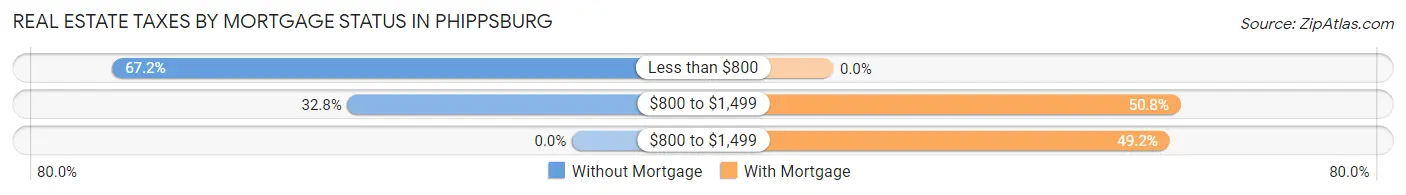
| Property Taxes | Without Mortgage | With Mortgage |
| Less than $800 | 43 (67.2%) | 0 (0.0%) |
| $800 to $1,499 | 21 (32.8%) | 31 (50.8%) |
| $800 to $1,499 | 0 (0.0%) | 30 (49.2%) |
| Total | 64 (100.0%) | 61 (100.0%) |
Health & Disability in Phippsburg
Health Insurance Coverage by Age in Phippsburg
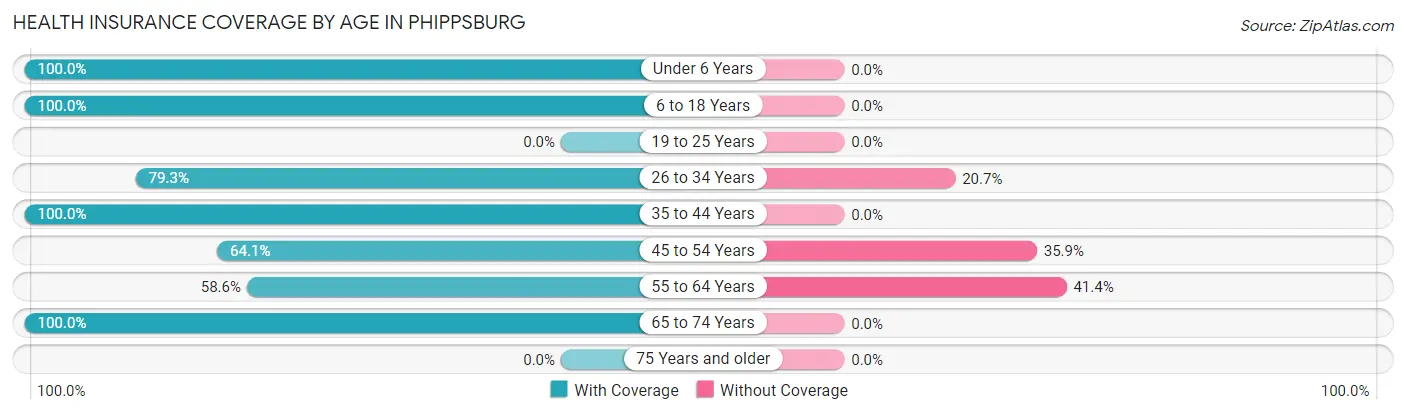
| Age Bracket | With Coverage | Without Coverage |
| Under 6 Years | 26 (100.0%) | 0 (0.0%) |
| 6 to 18 Years | 36 (100.0%) | 0 (0.0%) |
| 19 to 25 Years | 0 (0.0%) | 0 (0.0%) |
| 26 to 34 Years | 69 (79.3%) | 18 (20.7%) |
| 35 to 44 Years | 23 (100.0%) | 0 (0.0%) |
| 45 to 54 Years | 50 (64.1%) | 28 (35.9%) |
| 55 to 64 Years | 41 (58.6%) | 29 (41.4%) |
| 65 to 74 Years | 25 (100.0%) | 0 (0.0%) |
| 75 Years and older | 0 (0.0%) | 0 (0.0%) |
| Total | 270 (78.3%) | 75 (21.7%) |
Health Insurance Coverage by Citizenship Status in Phippsburg
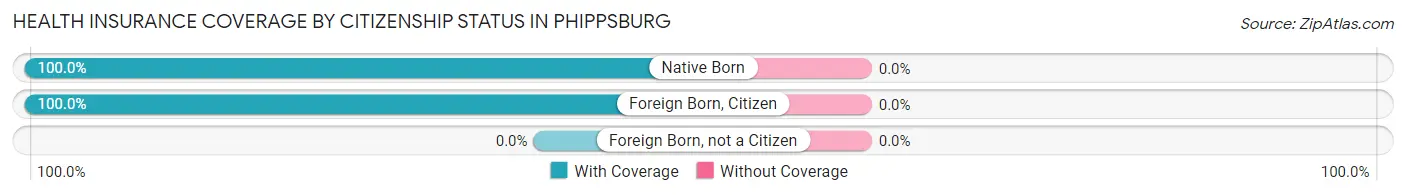
| Citizenship Status | With Coverage | Without Coverage |
| Native Born | 26 (100.0%) | 0 (0.0%) |
| Foreign Born, Citizen | 36 (100.0%) | 0 (0.0%) |
| Foreign Born, not a Citizen | 0 (0.0%) | 0 (0.0%) |
Health Insurance Coverage by Household Income in Phippsburg
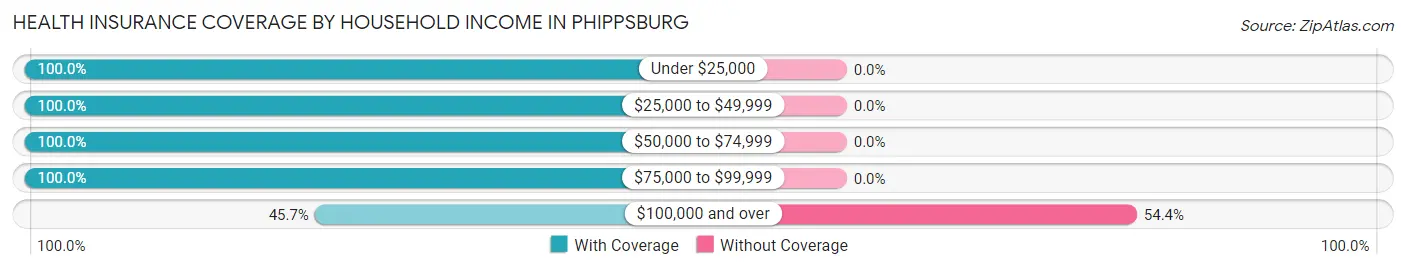
| Household Income | With Coverage | Without Coverage |
| Under $25,000 | 11 (100.0%) | 0 (0.0%) |
| $25,000 to $49,999 | 83 (100.0%) | 0 (0.0%) |
| $50,000 to $74,999 | 29 (100.0%) | 0 (0.0%) |
| $75,000 to $99,999 | 84 (100.0%) | 0 (0.0%) |
| $100,000 and over | 63 (45.7%) | 75 (54.3%) |
Public vs Private Health Insurance Coverage by Age in Phippsburg
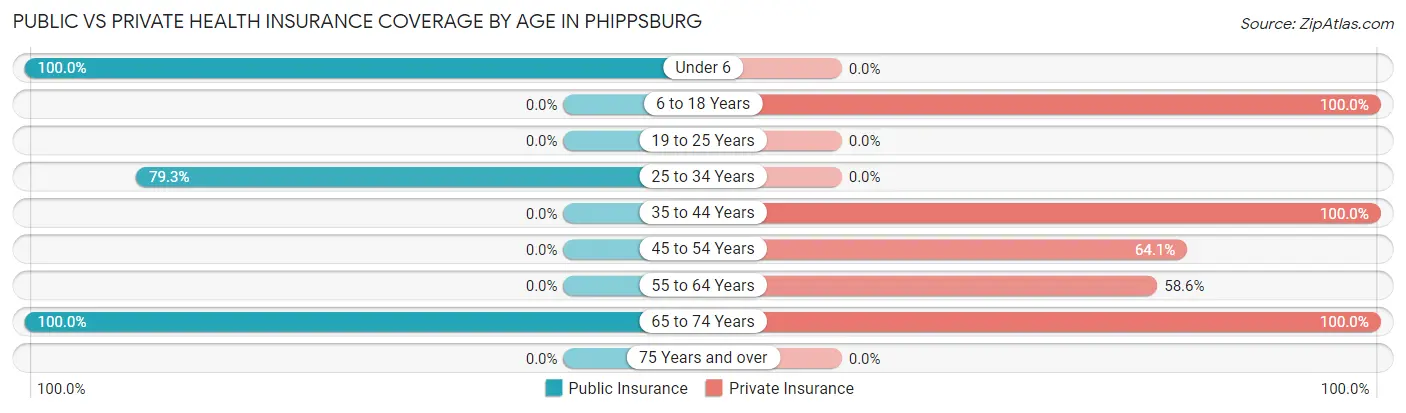
| Age Bracket | Public Insurance | Private Insurance |
| Under 6 | 26 (100.0%) | 0 (0.0%) |
| 6 to 18 Years | 0 (0.0%) | 36 (100.0%) |
| 19 to 25 Years | 0 (0.0%) | 0 (0.0%) |
| 25 to 34 Years | 69 (79.3%) | 0 (0.0%) |
| 35 to 44 Years | 0 (0.0%) | 23 (100.0%) |
| 45 to 54 Years | 0 (0.0%) | 50 (64.1%) |
| 55 to 64 Years | 0 (0.0%) | 41 (58.6%) |
| 65 to 74 Years | 25 (100.0%) | 25 (100.0%) |
| 75 Years and over | 0 (0.0%) | 0 (0.0%) |
| Total | 120 (34.8%) | 175 (50.7%) |
Disability Status by Sex by Age in Phippsburg
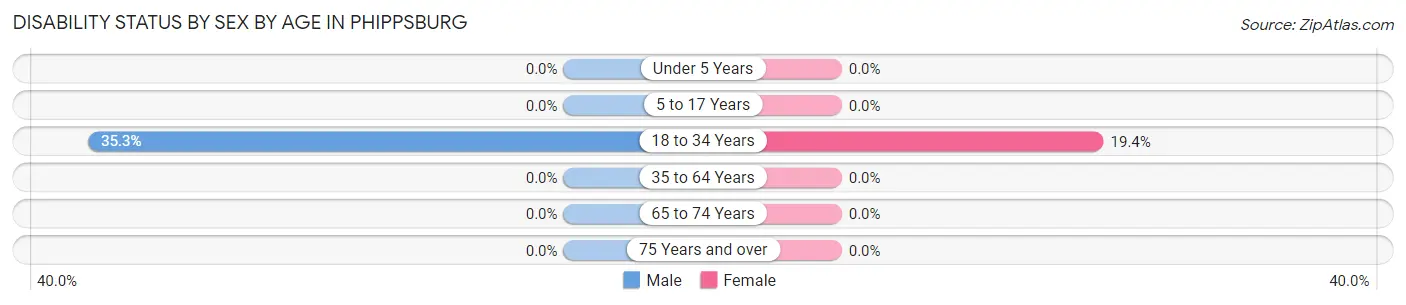
| Age Bracket | Male | Female |
| Under 5 Years | 0 (0.0%) | 0 (0.0%) |
| 5 to 17 Years | 0 (0.0%) | 0 (0.0%) |
| 18 to 34 Years | 18 (35.3%) | 7 (19.4%) |
| 35 to 64 Years | 0 (0.0%) | 0 (0.0%) |
| 65 to 74 Years | 0 (0.0%) | 0 (0.0%) |
| 75 Years and over | 0 (0.0%) | 0 (0.0%) |
Disability Class by Sex by Age in Phippsburg
Disability Class: Hearing Difficulty
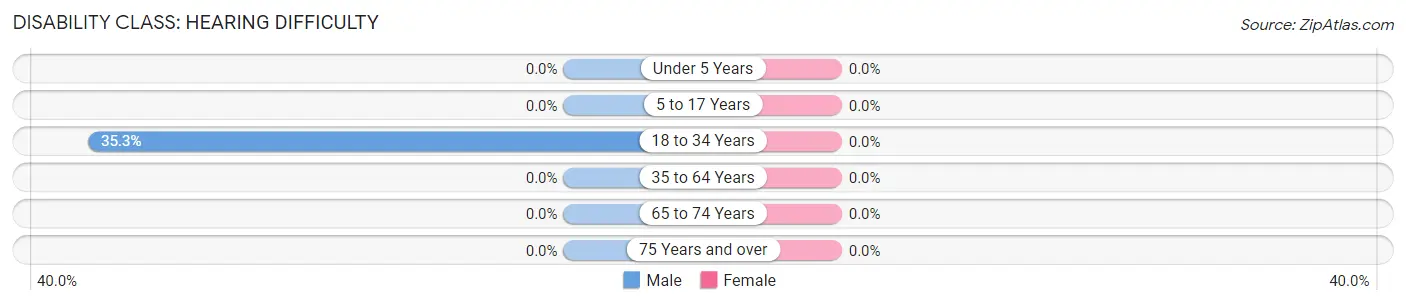
| Age Bracket | Male | Female |
| Under 5 Years | 0 (0.0%) | 0 (0.0%) |
| 5 to 17 Years | 0 (0.0%) | 0 (0.0%) |
| 18 to 34 Years | 18 (35.3%) | 0 (0.0%) |
| 35 to 64 Years | 0 (0.0%) | 0 (0.0%) |
| 65 to 74 Years | 0 (0.0%) | 0 (0.0%) |
| 75 Years and over | 0 (0.0%) | 0 (0.0%) |
Disability Class: Vision Difficulty
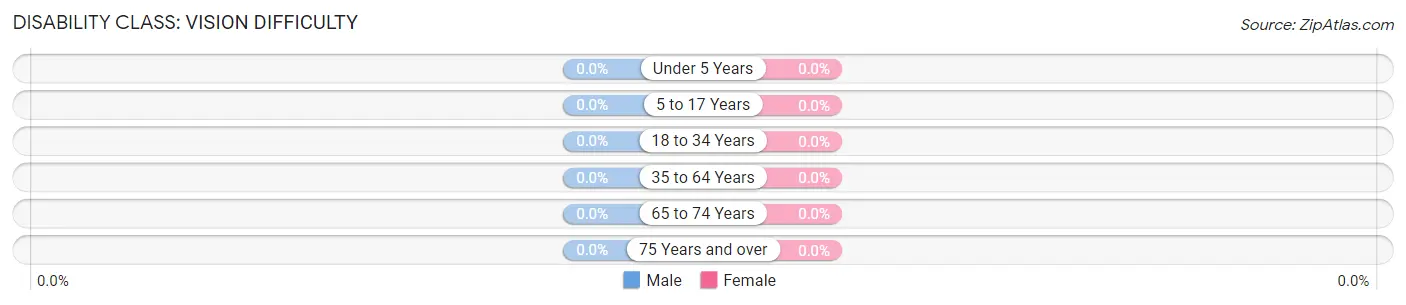
| Age Bracket | Male | Female |
| Under 5 Years | 0 (0.0%) | 0 (0.0%) |
| 5 to 17 Years | 0 (0.0%) | 0 (0.0%) |
| 18 to 34 Years | 0 (0.0%) | 0 (0.0%) |
| 35 to 64 Years | 0 (0.0%) | 0 (0.0%) |
| 65 to 74 Years | 0 (0.0%) | 0 (0.0%) |
| 75 Years and over | 0 (0.0%) | 0 (0.0%) |
Disability Class: Cognitive Difficulty
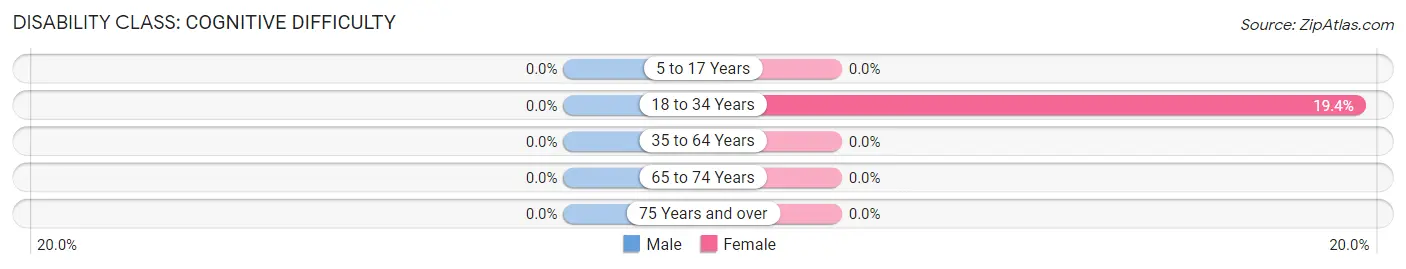
| Age Bracket | Male | Female |
| 5 to 17 Years | 0 (0.0%) | 0 (0.0%) |
| 18 to 34 Years | 0 (0.0%) | 7 (19.4%) |
| 35 to 64 Years | 0 (0.0%) | 0 (0.0%) |
| 65 to 74 Years | 0 (0.0%) | 0 (0.0%) |
| 75 Years and over | 0 (0.0%) | 0 (0.0%) |
Disability Class: Ambulatory Difficulty
| Age Bracket | Male | Female |
| 5 to 17 Years | 0 (0.0%) | 0 (0.0%) |
| 18 to 34 Years | 0 (0.0%) | 0 (0.0%) |
| 35 to 64 Years | 0 (0.0%) | 0 (0.0%) |
| 65 to 74 Years | 0 (0.0%) | 0 (0.0%) |
| 75 Years and over | 0 (0.0%) | 0 (0.0%) |
Disability Class: Self-Care Difficulty
| Age Bracket | Male | Female |
| 5 to 17 Years | 0 (0.0%) | 0 (0.0%) |
| 18 to 34 Years | 0 (0.0%) | 0 (0.0%) |
| 35 to 64 Years | 0 (0.0%) | 0 (0.0%) |
| 65 to 74 Years | 0 (0.0%) | 0 (0.0%) |
| 75 Years and over | 0 (0.0%) | 0 (0.0%) |
Technology Access in Phippsburg
Computing Device Access in Phippsburg
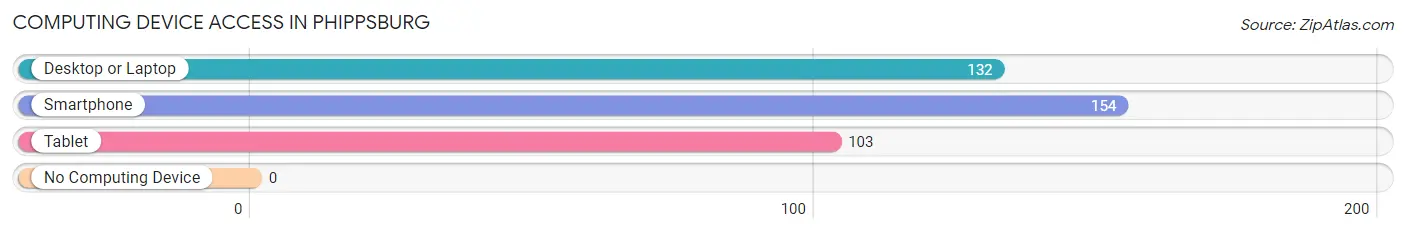
| Device Type | # Households | % Households |
| Desktop or Laptop | 132 | 85.7% |
| Smartphone | 154 | 100.0% |
| Tablet | 103 | 66.9% |
| No Computing Device | 0 | 0.0% |
| Total | 154 | 100.0% |
Internet Access in Phippsburg
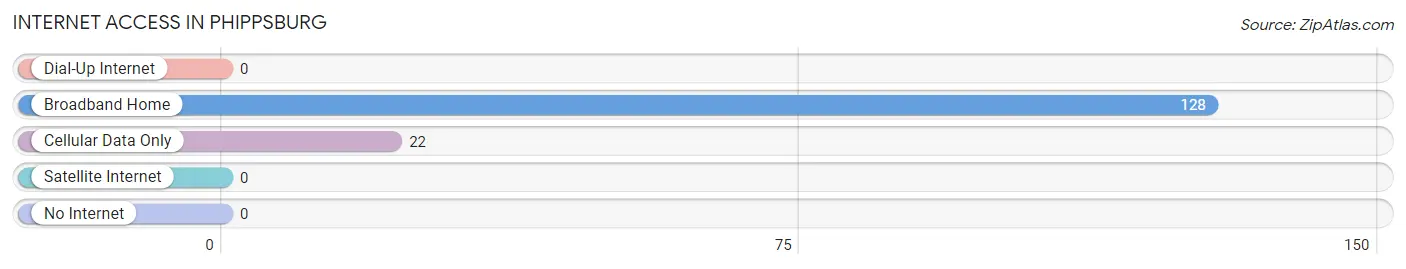
| Internet Type | # Households | % Households |
| Dial-Up Internet | 0 | 0.0% |
| Broadband Home | 128 | 83.1% |
| Cellular Data Only | 22 | 14.3% |
| Satellite Internet | 0 | 0.0% |
| No Internet | 0 | 0.0% |
| Total | 154 | 100.0% |
Phippsburg Summary
Phippsburg is a small town located in Routt County, Colorado, United States. It is situated in the Yampa Valley, along the Yampa River, and is surrounded by the Routt National Forest. The town was founded in 1881 and was named after the Phipps family, who were early settlers in the area. As of the 2010 census, the population of Phippsburg was 545.
History
The area around Phippsburg was first inhabited by the Ute Indians, who used the area for hunting and gathering. The first white settlers arrived in the area in the late 1870s, and the town of Phippsburg was founded in 1881. The town was named after the Phipps family, who were early settlers in the area.
The town grew quickly, and by the early 1900s, it had become a bustling center of commerce and industry. The town was home to several sawmills, a flour mill, a creamery, a blacksmith shop, and a general store. The town also had a post office, a school, and a hotel.
In the early 1900s, the town was also home to a large population of sheepherders, who used the area for grazing their herds. The town was also home to several coal mines, which provided employment for many of the town's residents.
Geography
Phippsburg is located in the Yampa Valley, along the Yampa River. The town is surrounded by the Routt National Forest, and is located approximately 25 miles south of Steamboat Springs. The town is situated at an elevation of 6,845 feet above sea level.
The climate in Phippsburg is semi-arid, with hot summers and cold winters. The average annual temperature is 44 degrees Fahrenheit, and the average annual precipitation is 16 inches.
Economy
The economy of Phippsburg is largely based on tourism and agriculture. The town is home to several tourist attractions, including the Yampa River State Park, the Routt National Forest, and the Steamboat Ski Resort. The town is also home to several farms and ranches, which produce hay, cattle, and sheep.
The town is also home to several small businesses, including restaurants, shops, and lodging. The town is also home to several manufacturing companies, which produce a variety of products, including furniture, clothing, and sporting goods.
Demographics
As of the 2010 census, the population of Phippsburg was 545. The racial makeup of the town was 95.3% White, 0.2% African American, 0.7% Native American, 0.2% Asian, 0.2% Pacific Islander, 1.3% from other races, and 2.3% from two or more races. Hispanic or Latino of any race were 4.2% of the population.
The median household income in Phippsburg was $45,833, and the median family income was $50,000. The per capita income in the town was $20,945. About 11.2% of families and 14.2% of the population were below the poverty line, including 18.2% of those under age 18 and 8.3% of those age 65 or over.
Common Questions
What is Per Capita Income in Phippsburg?
Per Capita income in Phippsburg is $42,778.
What is the Median Household income in Phippsburg?
Median Household Income in Phippsburg is $79,397.
What is Income or Wage Gap in Phippsburg?
Income or Wage Gap in Phippsburg is 50.5%.
Women in Phippsburg earn 49.5 cents for every dollar earned by a man.
What is Inequality or Gini Index in Phippsburg?
Inequality or Gini Index in Phippsburg is 0.30.
What is the Total Population of Phippsburg?
Total Population of Phippsburg is 345.
What is the Total Male Population of Phippsburg?
Total Male Population of Phippsburg is 162.
What is the Total Female Population of Phippsburg?
Total Female Population of Phippsburg is 183.
What is the Ratio of Males per 100 Females in Phippsburg?
There are 88.52 Males per 100 Females in Phippsburg.
What is the Ratio of Females per 100 Males in Phippsburg?
There are 112.96 Females per 100 Males in Phippsburg.
What is the Median Population Age in Phippsburg?
Median Population Age in Phippsburg is 45.0 Years.
What is the Average Family Size in Phippsburg
Average Family Size in Phippsburg is 2.2 People.
What is the Average Household Size in Phippsburg
Average Household Size in Phippsburg is 2.2 People.
How Large is the Labor Force in Phippsburg?
There are 210 People in the Labor Forcein in Phippsburg.
What is the Percentage of People in the Labor Force in Phippsburg?
74.2% of People are in the Labor Force in Phippsburg.
What is the Unemployment Rate in Phippsburg?
Unemployment Rate in Phippsburg is 13.3%.