Zip Codes with the Highest Percentage of Population with a Degree in Visual and Performing Arts in Denver, CO
RELATED REPORTS & OPTIONS
Visual and Performing Arts
Denver
Compare Zip Codes
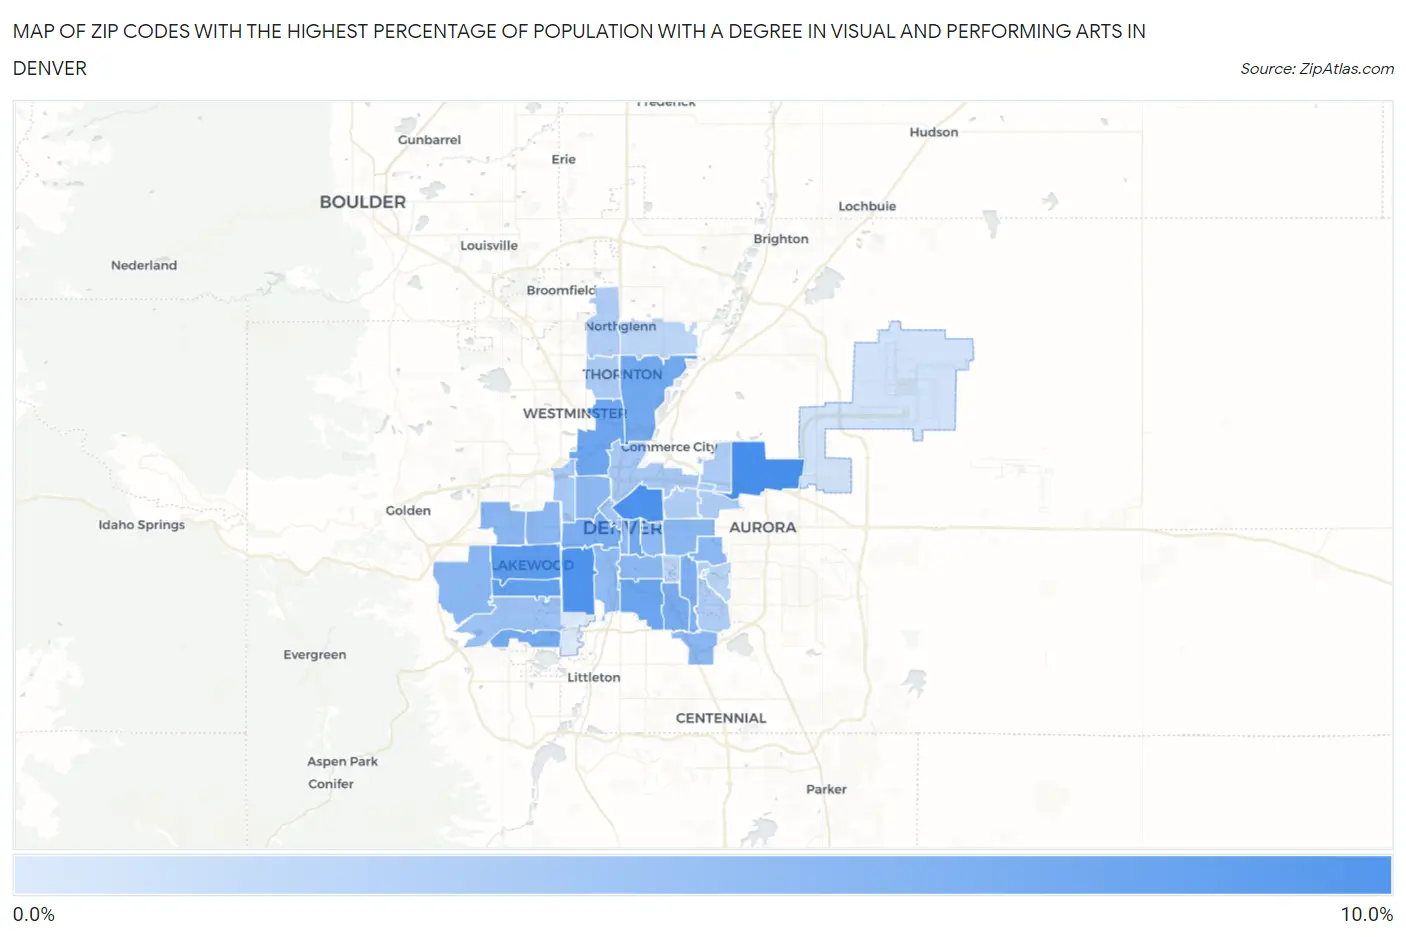
Map of Zip Codes with the Highest Percentage of Population with a Degree in Visual and Performing Arts in Denver
1.8%
8.7%
Zip Codes with the Highest Percentage of Population with a Degree in Visual and Performing Arts in Denver, CO
| Zip Code | % Graduates | vs State | vs National | |
| 1. | 80239 | 8.7% | 4.3%(+4.36)#43 | 4.3%(+4.43)#2,430 |
| 2. | 80205 | 8.4% | 4.3%(+4.11)#45 | 4.3%(+4.18)#2,573 |
| 3. | 80219 | 8.4% | 4.3%(+4.05)#46 | 4.3%(+4.13)#2,608 |
| 4. | 80226 | 7.7% | 4.3%(+3.36)#54 | 4.3%(+3.44)#3,079 |
| 5. | 80232 | 7.3% | 4.3%(+3.01)#60 | 4.3%(+3.08)#3,346 |
| 6. | 80210 | 6.9% | 4.3%(+2.62)#67 | 4.3%(+2.69)#3,713 |
| 7. | 80221 | 6.9% | 4.3%(+2.56)#68 | 4.3%(+2.64)#3,774 |
| 8. | 80218 | 6.7% | 4.3%(+2.38)#71 | 4.3%(+2.46)#3,972 |
| 9. | 80235 | 6.7% | 4.3%(+2.35)#72 | 4.3%(+2.42)#4,007 |
| 10. | 80229 | 6.6% | 4.3%(+2.29)#76 | 4.3%(+2.36)#4,106 |
| 11. | 80204 | 6.3% | 4.3%(+2.01)#82 | 4.3%(+2.08)#4,429 |
| 12. | 80222 | 6.3% | 4.3%(+1.95)#83 | 4.3%(+2.03)#4,498 |
| 13. | 80224 | 6.0% | 4.3%(+1.72)#89 | 4.3%(+1.79)#4,812 |
| 14. | 80230 | 5.6% | 4.3%(+1.27)#108 | 4.3%(+1.35)#5,502 |
| 15. | 80228 | 5.6% | 4.3%(+1.27)#109 | 4.3%(+1.35)#5,506 |
| 16. | 80237 | 5.6% | 4.3%(+1.26)#110 | 4.3%(+1.33)#5,523 |
| 17. | 80214 | 5.6% | 4.3%(+1.23)#114 | 4.3%(+1.30)#5,593 |
| 18. | 80215 | 5.5% | 4.3%(+1.21)#116 | 4.3%(+1.28)#5,617 |
| 19. | 80220 | 5.5% | 4.3%(+1.19)#118 | 4.3%(+1.26)#5,653 |
| 20. | 80209 | 5.5% | 4.3%(+1.17)#119 | 4.3%(+1.24)#5,696 |
| 21. | 80211 | 5.4% | 4.3%(+1.10)#120 | 4.3%(+1.17)#5,806 |
| 22. | 80206 | 5.4% | 4.3%(+1.09)#123 | 4.3%(+1.16)#5,826 |
| 23. | 80223 | 5.3% | 4.3%(+1.01)#127 | 4.3%(+1.08)#5,984 |
| 24. | 80203 | 5.3% | 4.3%(+0.931)#131 | 4.3%(+1.01)#6,142 |
| 25. | 80227 | 4.8% | 4.3%(+0.467)#154 | 4.3%(+0.542)#7,093 |
| 26. | 80202 | 4.5% | 4.3%(+0.187)#164 | 4.3%(+0.262)#7,772 |
| 27. | 80216 | 4.3% | 4.3%(-0.031)#173 | 4.3%(+0.044)#8,361 |
| 28. | 80212 | 4.2% | 4.3%(-0.166)#181 | 4.3%(-0.091)#8,750 |
| 29. | 80238 | 4.0% | 4.3%(-0.320)#188 | 4.3%(-0.246)#9,241 |
| 30. | 80260 | 3.9% | 4.3%(-0.399)#189 | 4.3%(-0.325)#9,483 |
| 31. | 80234 | 3.8% | 4.3%(-0.492)#197 | 4.3%(-0.418)#9,778 |
| 32. | 80231 | 3.8% | 4.3%(-0.495)#198 | 4.3%(-0.420)#9,783 |
| 33. | 80207 | 3.8% | 4.3%(-0.541)#200 | 4.3%(-0.466)#9,898 |
| 34. | 80246 | 3.4% | 4.3%(-0.937)#220 | 4.3%(-0.862)#11,290 |
| 35. | 80247 | 3.3% | 4.3%(-1.01)#225 | 4.3%(-0.939)#11,549 |
| 36. | 80233 | 3.2% | 4.3%(-1.12)#231 | 4.3%(-1.05)#11,980 |
| 37. | 80249 | 2.3% | 4.3%(-2.06)#289 | 4.3%(-1.99)#15,490 |
| 38. | 80236 | 1.8% | 4.3%(-2.53)#308 | 4.3%(-2.46)#17,170 |
1
Common Questions
What are the Top 10 Zip Codes with the Highest Percentage of Population with a Degree in Visual and Performing Arts in Denver, CO?
Top 10 Zip Codes with the Highest Percentage of Population with a Degree in Visual and Performing Arts in Denver, CO are:
What zip code has the Highest Percentage of Population with a Degree in Visual and Performing Arts in Denver, CO?
80239 has the Highest Percentage of Population with a Degree in Visual and Performing Arts in Denver, CO with 8.7%.
What is the Percentage of Population with a Degree in Visual and Performing Arts in Denver, CO?
Percentage of Population with a Degree in Visual and Performing Arts in Denver is 5.6%.
What is the Percentage of Population with a Degree in Visual and Performing Arts in Colorado?
Percentage of Population with a Degree in Visual and Performing Arts in Colorado is 4.3%.
What is the Percentage of Population with a Degree in Visual and Performing Arts in the United States?
Percentage of Population with a Degree in Visual and Performing Arts in the United States is 4.3%.