Zip Codes with the Highest Percentage of Population with a Degree in Visual and Performing Arts in Crested Butte, CO
RELATED REPORTS & OPTIONS
Visual and Performing Arts
Crested Butte
Compare Zip Codes
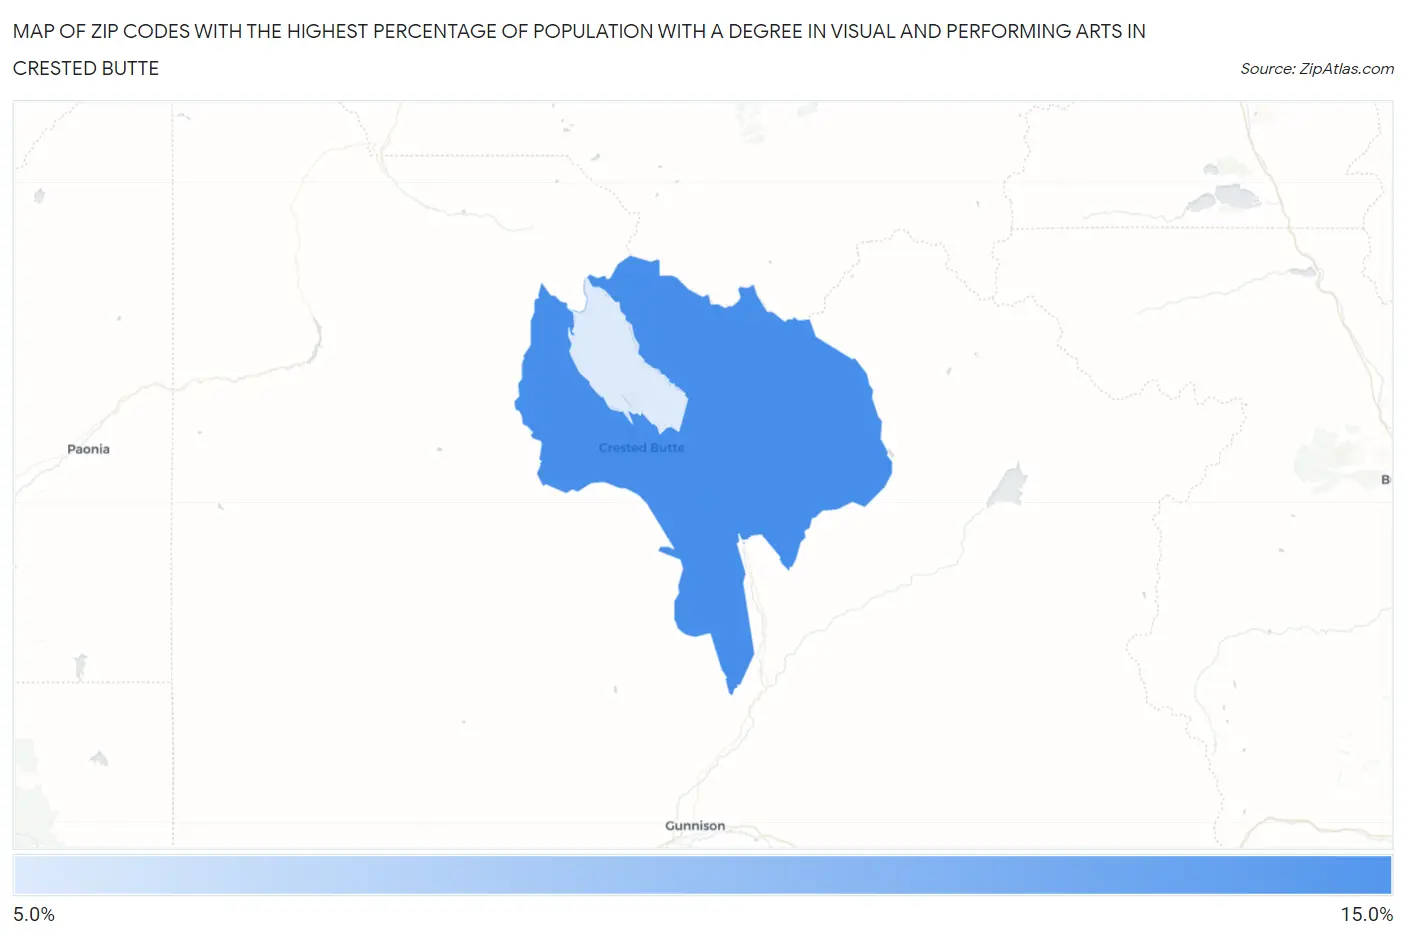
Map of Zip Codes with the Highest Percentage of Population with a Degree in Visual and Performing Arts in Crested Butte
7.7%
12.0%
Zip Codes with the Highest Percentage of Population with a Degree in Visual and Performing Arts in Crested Butte, CO
| Zip Code | % Graduates | vs State | vs National | |
| 1. | 81224 | 12.0% | 4.3%(+7.65)#24 | 4.3%(+7.72)#1,295 |
| 2. | 81225 | 7.7% | 4.3%(+3.39)#53 | 4.3%(+3.47)#3,039 |
1
Common Questions
What are the Top Zip Codes with the Highest Percentage of Population with a Degree in Visual and Performing Arts in Crested Butte, CO?
Top Zip Codes with the Highest Percentage of Population with a Degree in Visual and Performing Arts in Crested Butte, CO are:
What zip code has the Highest Percentage of Population with a Degree in Visual and Performing Arts in Crested Butte, CO?
81224 has the Highest Percentage of Population with a Degree in Visual and Performing Arts in Crested Butte, CO with 12.0%.
What is the Percentage of Population with a Degree in Visual and Performing Arts in Crested Butte, CO?
Percentage of Population with a Degree in Visual and Performing Arts in Crested Butte is 10.3%.
What is the Percentage of Population with a Degree in Visual and Performing Arts in Colorado?
Percentage of Population with a Degree in Visual and Performing Arts in Colorado is 4.3%.
What is the Percentage of Population with a Degree in Visual and Performing Arts in the United States?
Percentage of Population with a Degree in Visual and Performing Arts in the United States is 4.3%.