Zip Codes with the Highest Percentage of Population with a Degree in Visual and Performing Arts in Loveland, CO
RELATED REPORTS & OPTIONS
Visual and Performing Arts
Loveland
Compare Zip Codes
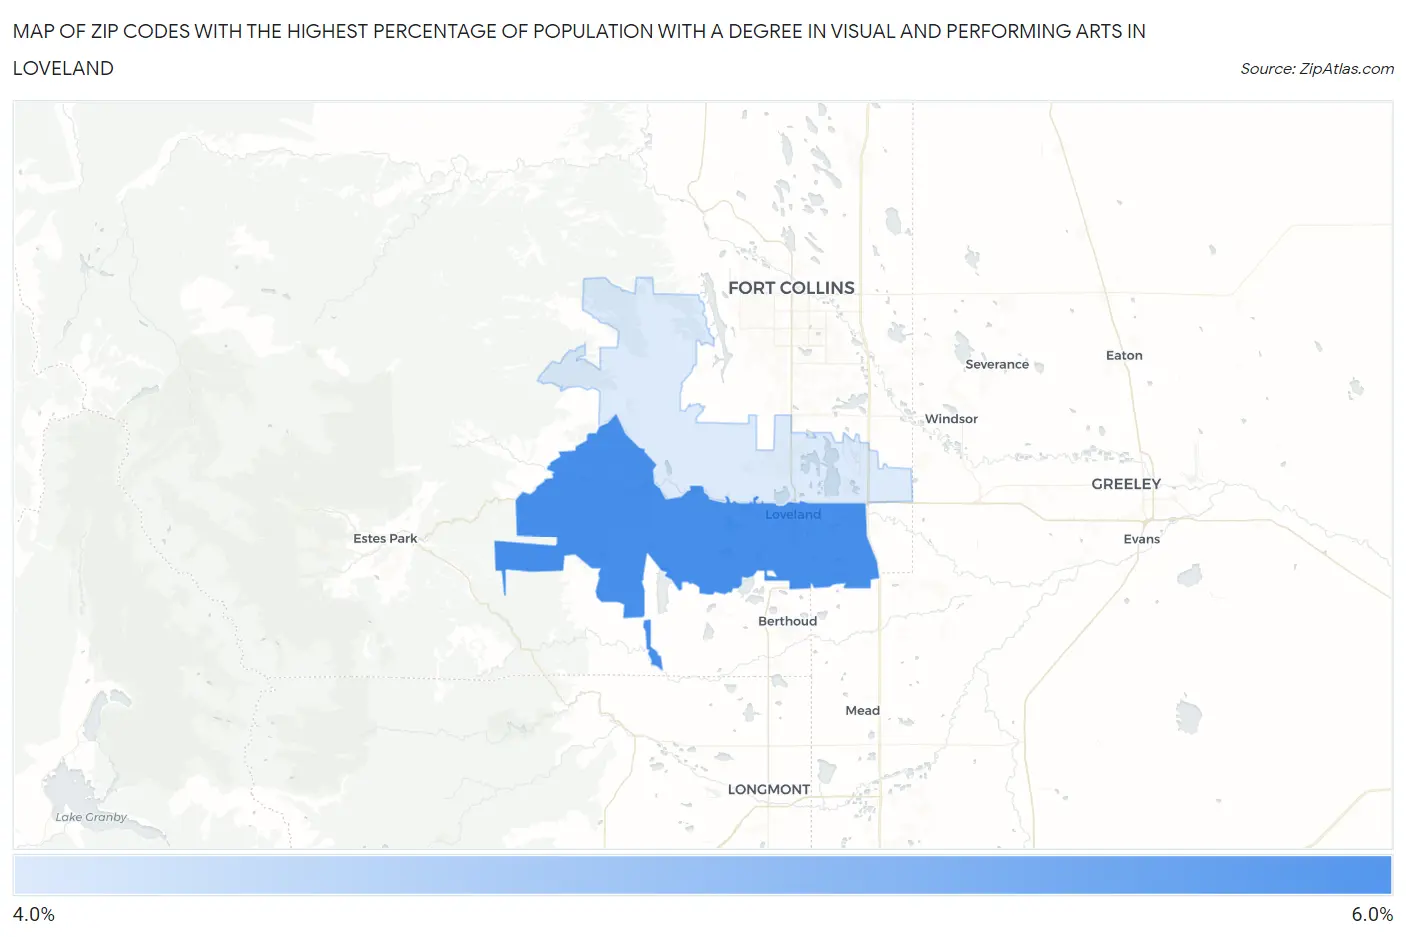
Map of Zip Codes with the Highest Percentage of Population with a Degree in Visual and Performing Arts in Loveland
4.2%
5.0%
Zip Codes with the Highest Percentage of Population with a Degree in Visual and Performing Arts in Loveland, CO
| Zip Code | % Graduates | vs State | vs National | |
| 1. | 80537 | 5.0% | 4.3%(+0.691)#140 | 4.3%(+0.766)#6,588 |
| 2. | 80538 | 4.2% | 4.3%(-0.116)#178 | 4.3%(-0.042)#8,596 |
1
Common Questions
What are the Top Zip Codes with the Highest Percentage of Population with a Degree in Visual and Performing Arts in Loveland, CO?
Top Zip Codes with the Highest Percentage of Population with a Degree in Visual and Performing Arts in Loveland, CO are:
What zip code has the Highest Percentage of Population with a Degree in Visual and Performing Arts in Loveland, CO?
80537 has the Highest Percentage of Population with a Degree in Visual and Performing Arts in Loveland, CO with 5.0%.
What is the Percentage of Population with a Degree in Visual and Performing Arts in Loveland, CO?
Percentage of Population with a Degree in Visual and Performing Arts in Loveland is 4.6%.
What is the Percentage of Population with a Degree in Visual and Performing Arts in Colorado?
Percentage of Population with a Degree in Visual and Performing Arts in Colorado is 4.3%.
What is the Percentage of Population with a Degree in Visual and Performing Arts in the United States?
Percentage of Population with a Degree in Visual and Performing Arts in the United States is 4.3%.