Zip Codes with the Highest Percentage of Families with Income Below $10,000 in Denver, CO
RELATED REPORTS & OPTIONS
Family Income | $0-10k
Denver
Compare Zip Codes
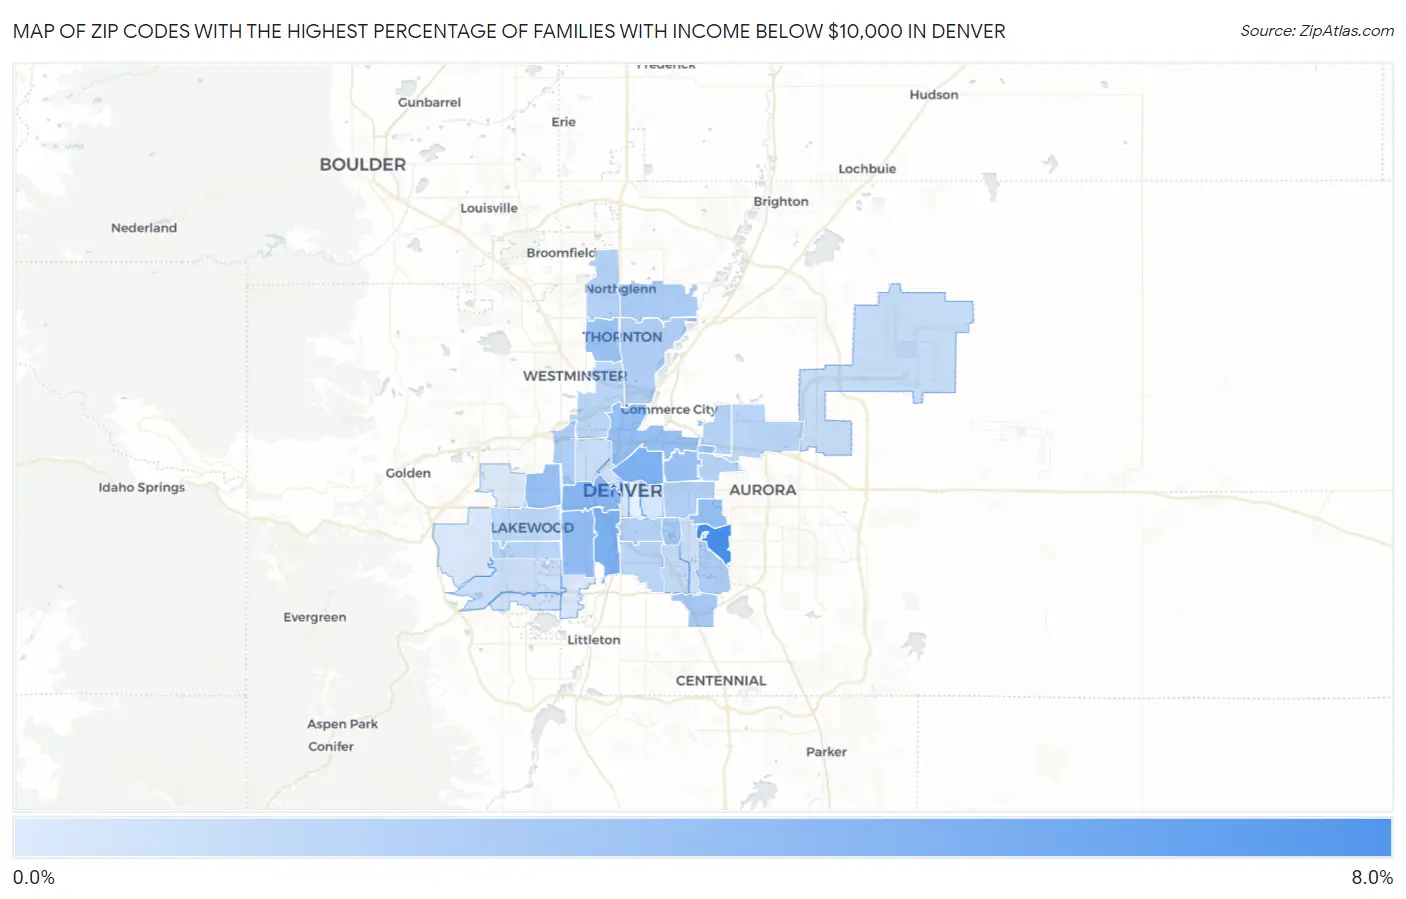
Map of Zip Codes with the Highest Percentage of Families with Income Below $10,000 in Denver
0.50%
7.7%
Zip Codes with the Highest Percentage of Families with Income Below $10,000 in Denver, CO
| Zip Code | Families with Income < $10k | vs State | vs National | |
| 1. | 80247 | 7.7% | 2.2%(+5.50)#24 | 3.1%(+4.60)#3,133 |
| 2. | 80223 | 5.1% | 2.2%(+2.90)#53 | 3.1%(+2.00)#5,954 |
| 3. | 80205 | 5.0% | 2.2%(+2.80)#55 | 3.1%(+1.90)#6,093 |
| 4. | 80204 | 4.5% | 2.2%(+2.30)#74 | 3.1%(+1.40)#6,998 |
| 5. | 80219 | 4.1% | 2.2%(+1.90)#82 | 3.1%(+1.000)#7,865 |
| 6. | 80230 | 4.0% | 2.2%(+1.80)#88 | 3.1%(+0.900)#8,222 |
| 7. | 80216 | 3.9% | 2.2%(+1.70)#92 | 3.1%(+0.800)#8,458 |
| 8. | 80214 | 3.8% | 2.2%(+1.60)#97 | 3.1%(+0.700)#8,684 |
| 9. | 80260 | 3.7% | 2.2%(+1.50)#102 | 3.1%(+0.600)#8,967 |
| 10. | 80207 | 3.6% | 2.2%(+1.40)#107 | 3.1%(+0.500)#9,269 |
| 11. | 80237 | 3.1% | 2.2%(+0.900)#124 | 3.1%(=0.000)#10,826 |
| 12. | 80246 | 3.1% | 2.2%(+0.900)#125 | 3.1%(=0.000)#10,882 |
| 13. | 80233 | 2.9% | 2.2%(+0.700)#135 | 3.1%(-0.200)#11,436 |
| 14. | 80231 | 2.8% | 2.2%(+0.600)#138 | 3.1%(-0.300)#11,858 |
| 15. | 80229 | 2.7% | 2.2%(+0.500)#143 | 3.1%(-0.400)#12,199 |
| 16. | 80212 | 2.7% | 2.2%(+0.500)#145 | 3.1%(-0.400)#12,326 |
| 17. | 80220 | 2.5% | 2.2%(+0.300)#153 | 3.1%(-0.600)#13,070 |
| 18. | 80234 | 2.4% | 2.2%(+0.200)#159 | 3.1%(-0.700)#13,502 |
| 19. | 80238 | 2.3% | 2.2%(+0.100)#166 | 3.1%(-0.800)#13,948 |
| 20. | 80209 | 2.3% | 2.2%(+0.100)#167 | 3.1%(-0.800)#13,968 |
| 21. | 80239 | 2.1% | 2.2%(-0.100)#177 | 3.1%(-1.000)#14,784 |
| 22. | 80221 | 2.1% | 2.2%(-0.100)#179 | 3.1%(-1.000)#14,805 |
| 23. | 80210 | 2.1% | 2.2%(-0.100)#180 | 3.1%(-1.000)#14,813 |
| 24. | 80232 | 2.1% | 2.2%(-0.100)#182 | 3.1%(-1.000)#14,894 |
| 25. | 80226 | 1.9% | 2.2%(-0.300)#196 | 3.1%(-1.20)#15,792 |
| 26. | 80249 | 1.6% | 2.2%(-0.600)#214 | 3.1%(-1.50)#17,220 |
| 27. | 80222 | 1.6% | 2.2%(-0.600)#216 | 3.1%(-1.50)#17,284 |
| 28. | 80211 | 1.5% | 2.2%(-0.700)#222 | 3.1%(-1.60)#17,708 |
| 29. | 80227 | 1.4% | 2.2%(-0.800)#227 | 3.1%(-1.70)#18,211 |
| 30. | 80224 | 1.4% | 2.2%(-0.800)#230 | 3.1%(-1.70)#18,306 |
| 31. | 80202 | 1.1% | 2.2%(-1.10)#258 | 3.1%(-2.00)#19,820 |
| 32. | 80235 | 1.1% | 2.2%(-1.10)#262 | 3.1%(-2.00)#19,914 |
| 33. | 80206 | 0.80% | 2.2%(-1.40)#289 | 3.1%(-2.30)#21,267 |
| 34. | 80203 | 0.70% | 2.2%(-1.50)#298 | 3.1%(-2.40)#21,727 |
| 35. | 80228 | 0.60% | 2.2%(-1.60)#304 | 3.1%(-2.50)#22,169 |
| 36. | 80236 | 0.60% | 2.2%(-1.60)#306 | 3.1%(-2.50)#22,252 |
| 37. | 80215 | 0.50% | 2.2%(-1.70)#313 | 3.1%(-2.60)#22,668 |
1
Common Questions
What are the Top 10 Zip Codes with the Highest Percentage of Families with Income Below $10,000 in Denver, CO?
Top 10 Zip Codes with the Highest Percentage of Families with Income Below $10,000 in Denver, CO are:
What zip code has the Highest Percentage of Families with Income Below $10,000 in Denver, CO?
80247 has the Highest Percentage of Families with Income Below $10,000 in Denver, CO with 7.7%.
What is the Percentage of Families with Income Below $10,000 in Denver, CO?
Percentage of Families with Income Below $10,000 in Denver is 2.7%.
What is the Percentage of Families with Income Below $10,000 in Colorado?
Percentage of Families with Income Below $10,000 in Colorado is 2.2%.
What is the Percentage of Families with Income Below $10,000 in the United States?
Percentage of Families with Income Below $10,000 in the United States is 3.1%.