Zip Codes with the Highest Percentage of Families with Income Below $10,000 in Colorado
RELATED REPORTS & OPTIONS
Family Income | $0-10k
Colorado
Compare Zip Codes
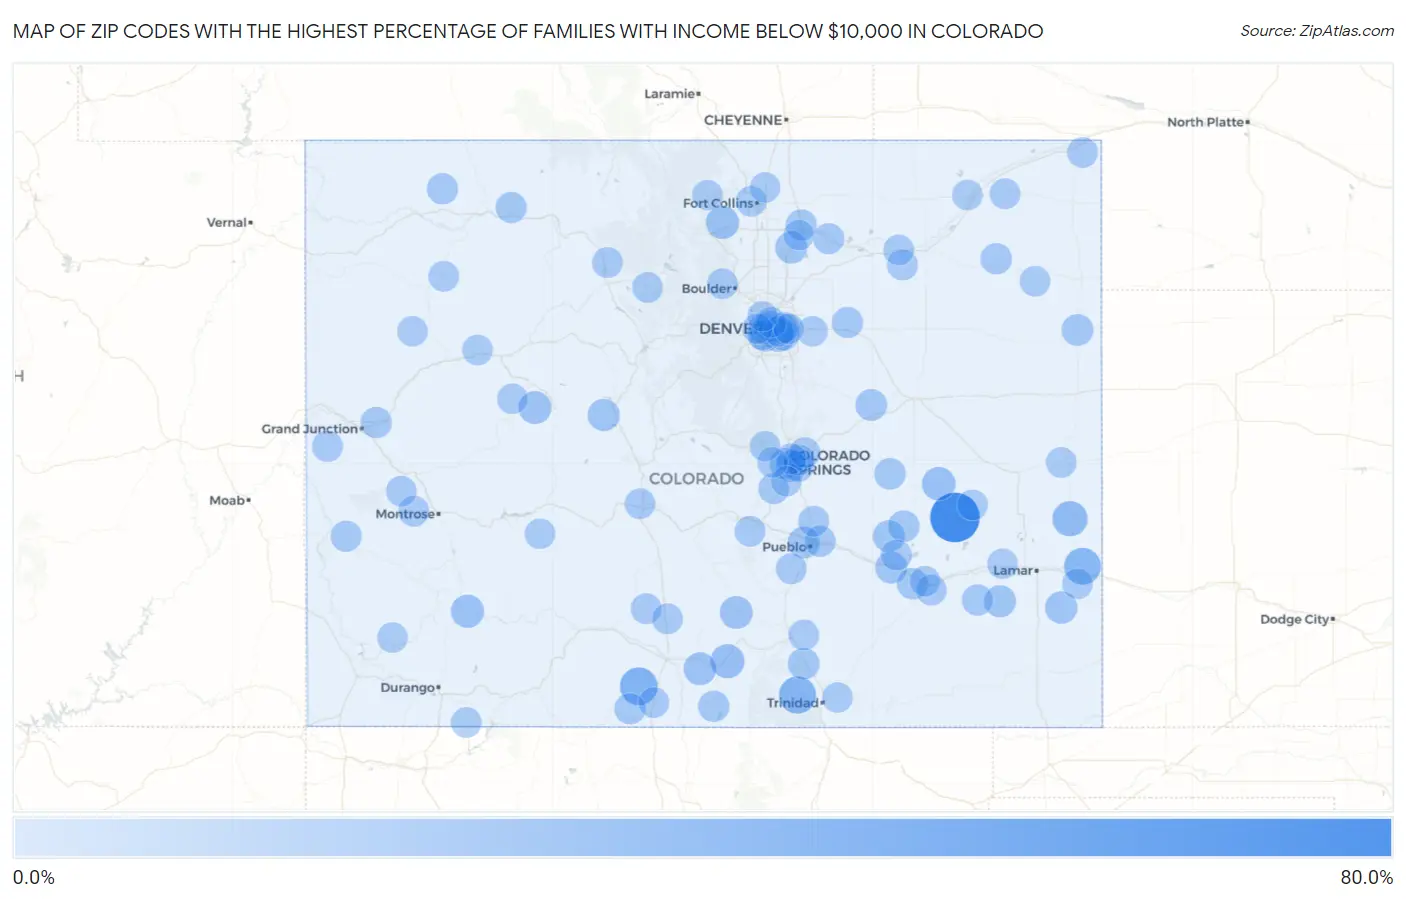
Map of Zip Codes with the Highest Percentage of Families with Income Below $10,000 in Colorado
0.0%
80.0%
Zip Codes with the Highest Percentage of Families with Income Below $10,000 in Colorado
| Zip Code | Families with Income < $10k | vs State | vs National | |
| 1. | 81021 | 80.0% | 2.2%(+77.8)#1 | 3.1%(+76.9)#16 |
| 2. | 81124 | 32.2% | 2.2%(+30.0)#2 | 3.1%(+29.1)#170 |
| 3. | 81024 | 30.2% | 2.2%(+28.0)#3 | 3.1%(+27.1)#190 |
| 4. | 81043 | 28.6% | 2.2%(+26.4)#4 | 3.1%(+25.5)#218 |
| 5. | 81071 | 22.4% | 2.2%(+20.2)#5 | 3.1%(+19.3)#392 |
| 6. | 81133 | 17.9% | 2.2%(+15.7)#6 | 3.1%(+14.8)#590 |
| 7. | 80823 | 15.9% | 2.2%(+13.7)#7 | 3.1%(+12.8)#763 |
| 8. | 81433 | 14.1% | 2.2%(+11.9)#8 | 3.1%(+11.0)#964 |
| 9. | 80515 | 14.0% | 2.2%(+11.8)#9 | 3.1%(+10.9)#973 |
| 10. | 81040 | 13.2% | 2.2%(+11.0)#10 | 3.1%(+10.1)#1,097 |
| 11. | 81654 | 13.0% | 2.2%(+10.8)#11 | 3.1%(+9.90)#1,120 |
| 12. | 81123 | 13.0% | 2.2%(+10.8)#12 | 3.1%(+9.90)#1,126 |
| 13. | 81041 | 11.2% | 2.2%(+9.00)#13 | 3.1%(+8.10)#1,548 |
| 14. | 80623 | 10.6% | 2.2%(+8.40)#14 | 3.1%(+7.50)#1,723 |
| 15. | 81251 | 10.6% | 2.2%(+8.40)#15 | 3.1%(+7.50)#1,729 |
| 16. | 81058 | 10.0% | 2.2%(+7.80)#16 | 3.1%(+6.90)#1,926 |
| 17. | 81044 | 9.8% | 2.2%(+7.60)#17 | 3.1%(+6.70)#2,026 |
| 18. | 81003 | 9.3% | 2.2%(+7.10)#18 | 3.1%(+6.20)#2,196 |
| 19. | 81062 | 9.2% | 2.2%(+7.00)#19 | 3.1%(+6.10)#2,277 |
| 20. | 80735 | 9.0% | 2.2%(+6.80)#20 | 3.1%(+5.90)#2,393 |
| 21. | 80835 | 8.8% | 2.2%(+6.60)#21 | 3.1%(+5.70)#2,489 |
| 22. | 81020 | 8.7% | 2.2%(+6.50)#22 | 3.1%(+5.60)#2,541 |
| 23. | 81063 | 8.2% | 2.2%(+6.00)#23 | 3.1%(+5.10)#2,867 |
| 24. | 80247 | 7.7% | 2.2%(+5.50)#24 | 3.1%(+4.60)#3,133 |
| 25. | 80833 | 7.5% | 2.2%(+5.30)#25 | 3.1%(+4.40)#3,315 |
| 26. | 81067 | 7.3% | 2.2%(+5.10)#26 | 3.1%(+4.20)#3,421 |
| 27. | 80743 | 7.3% | 2.2%(+5.10)#27 | 3.1%(+4.20)#3,451 |
| 28. | 81520 | 6.7% | 2.2%(+4.50)#28 | 3.1%(+3.60)#3,909 |
| 29. | 81625 | 6.7% | 2.2%(+4.50)#29 | 3.1%(+3.60)#3,911 |
| 30. | 81054 | 6.7% | 2.2%(+4.50)#30 | 3.1%(+3.60)#3,934 |
| 31. | 81639 | 6.7% | 2.2%(+4.50)#31 | 3.1%(+3.60)#3,946 |
| 32. | 81152 | 6.7% | 2.2%(+4.50)#32 | 3.1%(+3.60)#3,955 |
| 33. | 80631 | 6.6% | 2.2%(+4.40)#33 | 3.1%(+3.50)#3,988 |
| 34. | 80136 | 6.6% | 2.2%(+4.40)#34 | 3.1%(+3.50)#4,027 |
| 35. | 81001 | 6.5% | 2.2%(+4.30)#35 | 3.1%(+3.40)#4,103 |
| 36. | 81120 | 6.4% | 2.2%(+4.20)#36 | 3.1%(+3.30)#4,261 |
| 37. | 81422 | 6.2% | 2.2%(+4.00)#37 | 3.1%(+3.10)#4,509 |
| 38. | 80012 | 6.1% | 2.2%(+3.90)#38 | 3.1%(+3.00)#4,520 |
| 39. | 80910 | 6.1% | 2.2%(+3.90)#39 | 3.1%(+3.00)#4,531 |
| 40. | 80644 | 6.1% | 2.2%(+3.90)#40 | 3.1%(+3.00)#4,588 |
| 41. | 81523 | 6.0% | 2.2%(+3.80)#41 | 3.1%(+2.90)#4,745 |
| 42. | 80905 | 5.9% | 2.2%(+3.70)#42 | 3.1%(+2.80)#4,794 |
| 43. | 81125 | 5.6% | 2.2%(+3.40)#43 | 3.1%(+2.50)#5,223 |
| 44. | 80045 | 5.6% | 2.2%(+3.40)#44 | 3.1%(+2.50)#5,245 |
| 45. | 81033 | 5.6% | 2.2%(+3.40)#45 | 3.1%(+2.50)#5,286 |
| 46. | 81136 | 5.5% | 2.2%(+3.30)#46 | 3.1%(+2.40)#5,417 |
| 47. | 80701 | 5.4% | 2.2%(+3.20)#47 | 3.1%(+2.30)#5,467 |
| 48. | 80459 | 5.4% | 2.2%(+3.20)#48 | 3.1%(+2.30)#5,534 |
| 49. | 81008 | 5.3% | 2.2%(+3.10)#49 | 3.1%(+2.20)#5,639 |
| 50. | 81425 | 5.2% | 2.2%(+3.00)#50 | 3.1%(+2.10)#5,824 |
| 51. | 80916 | 5.1% | 2.2%(+2.90)#51 | 3.1%(+2.00)#5,922 |
| 52. | 81004 | 5.1% | 2.2%(+2.90)#52 | 3.1%(+2.00)#5,945 |
| 53. | 80223 | 5.1% | 2.2%(+2.90)#53 | 3.1%(+2.00)#5,954 |
| 54. | 80728 | 5.1% | 2.2%(+2.90)#54 | 3.1%(+2.00)#6,038 |
| 55. | 80205 | 5.0% | 2.2%(+2.80)#55 | 3.1%(+1.90)#6,093 |
| 56. | 81416 | 5.0% | 2.2%(+2.80)#56 | 3.1%(+1.90)#6,130 |
| 57. | 80302 | 4.9% | 2.2%(+2.70)#57 | 3.1%(+1.80)#6,265 |
| 58. | 80926 | 4.9% | 2.2%(+2.70)#58 | 3.1%(+1.80)#6,377 |
| 59. | 80451 | 4.9% | 2.2%(+2.70)#59 | 3.1%(+1.80)#6,385 |
| 60. | 80705 | 4.9% | 2.2%(+2.70)#60 | 3.1%(+1.80)#6,389 |
| 61. | 80915 | 4.8% | 2.2%(+2.60)#61 | 3.1%(+1.70)#6,448 |
| 62. | 81089 | 4.8% | 2.2%(+2.60)#62 | 3.1%(+1.70)#6,514 |
| 63. | 81221 | 4.8% | 2.2%(+2.60)#63 | 3.1%(+1.70)#6,584 |
| 64. | 81148 | 4.8% | 2.2%(+2.60)#64 | 3.1%(+1.70)#6,587 |
| 65. | 81045 | 4.8% | 2.2%(+2.60)#65 | 3.1%(+1.70)#6,595 |
| 66. | 80521 | 4.7% | 2.2%(+2.50)#66 | 3.1%(+1.60)#6,619 |
| 67. | 81201 | 4.7% | 2.2%(+2.50)#67 | 3.1%(+1.60)#6,677 |
| 68. | 81641 | 4.7% | 2.2%(+2.50)#68 | 3.1%(+1.60)#6,712 |
| 69. | 80737 | 4.7% | 2.2%(+2.50)#69 | 3.1%(+1.60)#6,749 |
| 70. | 81050 | 4.6% | 2.2%(+2.40)#70 | 3.1%(+1.50)#6,872 |
| 71. | 81647 | 4.6% | 2.2%(+2.40)#71 | 3.1%(+1.50)#6,886 |
| 72. | 81047 | 4.6% | 2.2%(+2.40)#72 | 3.1%(+1.50)#6,936 |
| 73. | 80010 | 4.5% | 2.2%(+2.30)#73 | 3.1%(+1.40)#6,989 |
| 74. | 80204 | 4.5% | 2.2%(+2.30)#74 | 3.1%(+1.40)#6,998 |
| 75. | 80751 | 4.5% | 2.2%(+2.30)#75 | 3.1%(+1.40)#7,032 |
| 76. | 80938 | 4.5% | 2.2%(+2.30)#76 | 3.1%(+1.40)#7,154 |
| 77. | 80620 | 4.4% | 2.2%(+2.20)#77 | 3.1%(+1.30)#7,243 |
| 78. | 81623 | 4.3% | 2.2%(+2.10)#78 | 3.1%(+1.20)#7,456 |
| 79. | 80810 | 4.3% | 2.2%(+2.10)#79 | 3.1%(+1.20)#7,568 |
| 80. | 80759 | 4.2% | 2.2%(+2.00)#80 | 3.1%(+1.10)#7,757 |
| 81. | 81077 | 4.2% | 2.2%(+2.00)#81 | 3.1%(+1.10)#7,843 |
| 82. | 80219 | 4.1% | 2.2%(+1.90)#82 | 3.1%(+1.000)#7,865 |
| 83. | 80909 | 4.1% | 2.2%(+1.90)#83 | 3.1%(+1.000)#7,886 |
| 84. | 80902 | 4.1% | 2.2%(+1.90)#84 | 3.1%(+1.000)#7,956 |
| 85. | 80137 | 4.1% | 2.2%(+1.90)#85 | 3.1%(+1.000)#8,046 |
| 86. | 80512 | 4.1% | 2.2%(+1.90)#86 | 3.1%(+1.000)#8,060 |
| 87. | 81650 | 4.0% | 2.2%(+1.80)#87 | 3.1%(+0.900)#8,204 |
| 88. | 80230 | 4.0% | 2.2%(+1.80)#88 | 3.1%(+0.900)#8,222 |
| 89. | 80829 | 4.0% | 2.2%(+1.80)#89 | 3.1%(+0.900)#8,252 |
| 90. | 80819 | 4.0% | 2.2%(+1.80)#90 | 3.1%(+0.900)#8,341 |
| 91. | 81057 | 4.0% | 2.2%(+1.80)#91 | 3.1%(+0.900)#8,351 |
| 92. | 80216 | 3.9% | 2.2%(+1.70)#92 | 3.1%(+0.800)#8,458 |
| 93. | 81082 | 3.9% | 2.2%(+1.70)#93 | 3.1%(+0.800)#8,481 |
| 94. | 81323 | 3.9% | 2.2%(+1.70)#94 | 3.1%(+0.800)#8,525 |
| 95. | 80011 | 3.8% | 2.2%(+1.60)#95 | 3.1%(+0.700)#8,637 |
| 96. | 80524 | 3.8% | 2.2%(+1.60)#96 | 3.1%(+0.700)#8,652 |
| 97. | 80214 | 3.8% | 2.2%(+1.60)#97 | 3.1%(+0.700)#8,684 |
| 98. | 80030 | 3.8% | 2.2%(+1.60)#98 | 3.1%(+0.700)#8,711 |
| 99. | 81230 | 3.8% | 2.2%(+1.60)#99 | 3.1%(+0.700)#8,740 |
| 100. | 81137 | 3.8% | 2.2%(+1.60)#100 | 3.1%(+0.700)#8,783 |
Common Questions
What are the Top 10 Zip Codes with the Highest Percentage of Families with Income Below $10,000 in Colorado?
Top 10 Zip Codes with the Highest Percentage of Families with Income Below $10,000 in Colorado are:
What zip code has the Highest Percentage of Families with Income Below $10,000 in Colorado?
81021 has the Highest Percentage of Families with Income Below $10,000 in Colorado with 80.0%.
What is the Percentage of Families with Income Below $10,000 in the State of Colorado?
Percentage of Families with Income Below $10,000 in Colorado is 2.2%.
What is the Percentage of Families with Income Below $10,000 in the United States?
Percentage of Families with Income Below $10,000 in the United States is 3.1%.