Immigrants from Burma/Myanmar Female Poverty
COMPARE
Immigrants from Burma/Myanmar
Select to Compare
Female Poverty
Immigrants from Burma/Myanmar Female Poverty
15.4%
POVERTY | FEMALES
0.3/ 100
METRIC RATING
252nd/ 347
METRIC RANK
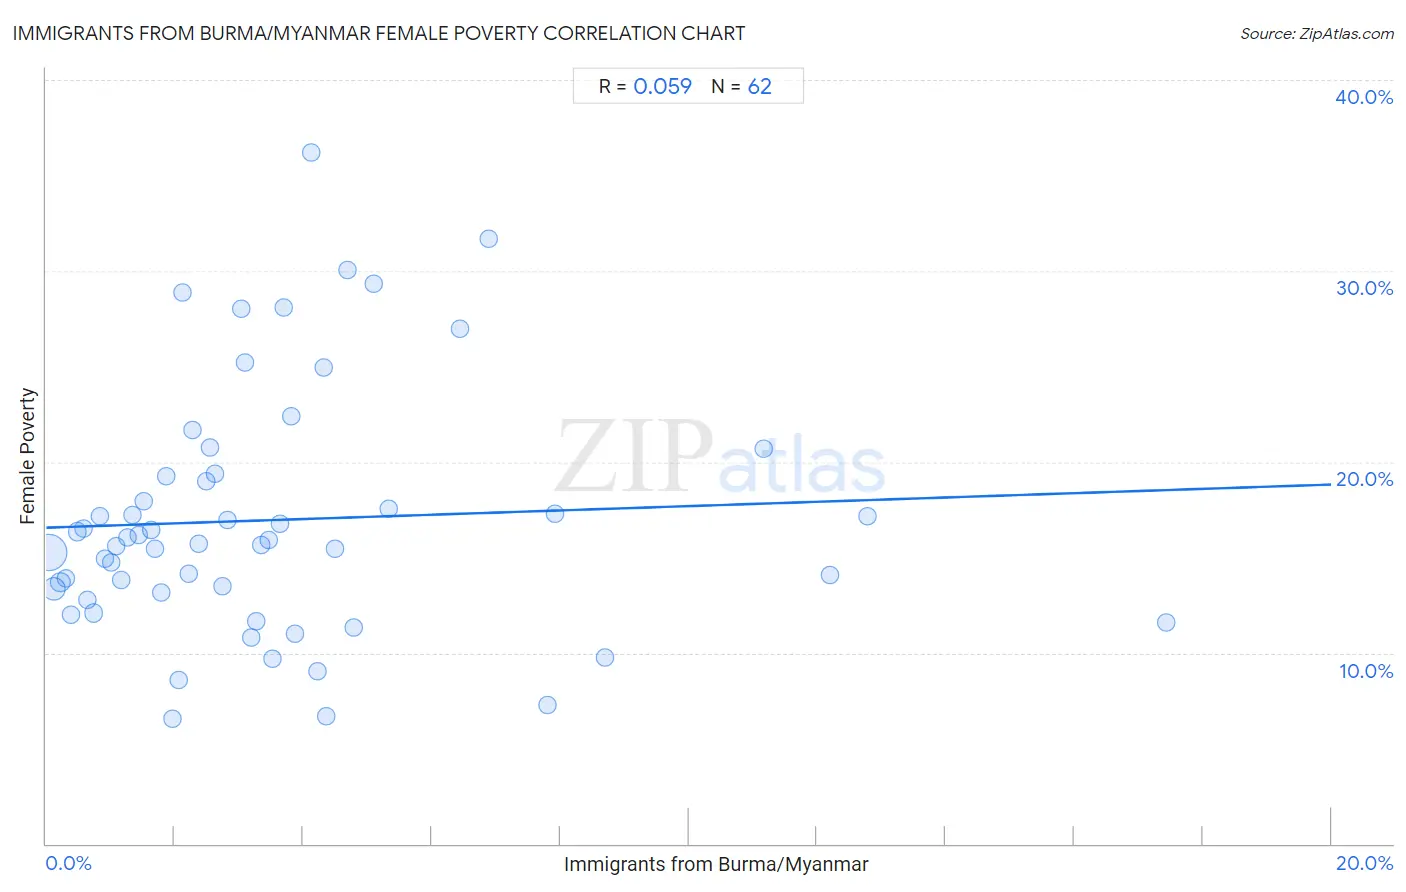
Immigrants from Burma/Myanmar Female Poverty Correlation Chart
The statistical analysis conducted on geographies consisting of 172,266,194 people shows a slight positive correlation between the proportion of Immigrants from Burma/Myanmar and poverty level among females in the United States with a correlation coefficient (R) of 0.059 and weighted average of 15.4%. On average, for every 1% (one percent) increase in Immigrants from Burma/Myanmar within a typical geography, there is an increase of 0.11% in poverty level among females.
It is essential to understand that the correlation between the percentage of Immigrants from Burma/Myanmar and poverty level among females does not imply a direct cause-and-effect relationship. It remains uncertain whether the presence of Immigrants from Burma/Myanmar influences an upward or downward trend in the level of poverty level among females within an area, or if Immigrants from Burma/Myanmar simply ended up residing in those areas with higher or lower levels of poverty level among females due to other factors.
Demographics Similar to Immigrants from Burma/Myanmar by Female Poverty
In terms of female poverty, the demographic groups most similar to Immigrants from Burma/Myanmar are Immigrants from Trinidad and Tobago (15.4%, a difference of 0.030%), Immigrants from Western Africa (15.3%, a difference of 0.19%), Salvadoran (15.3%, a difference of 0.23%), Liberian (15.4%, a difference of 0.26%), and Immigrants from Ghana (15.3%, a difference of 0.37%).
| Demographics | Rating | Rank | Female Poverty |
| Spanish American Indians | 0.3 /100 | #245 | Tragic 15.3% |
| Cubans | 0.3 /100 | #246 | Tragic 15.3% |
| Potawatomi | 0.3 /100 | #247 | Tragic 15.3% |
| Immigrants from Ghana | 0.3 /100 | #248 | Tragic 15.3% |
| Salvadorans | 0.3 /100 | #249 | Tragic 15.3% |
| Immigrants from Western Africa | 0.3 /100 | #250 | Tragic 15.3% |
| Immigrants from Trinidad and Tobago | 0.3 /100 | #251 | Tragic 15.4% |
| Immigrants from Burma/Myanmar | 0.3 /100 | #252 | Tragic 15.4% |
| Liberians | 0.2 /100 | #253 | Tragic 15.4% |
| Trinidadians and Tobagonians | 0.2 /100 | #254 | Tragic 15.4% |
| Ottawa | 0.2 /100 | #255 | Tragic 15.5% |
| Jamaicans | 0.2 /100 | #256 | Tragic 15.5% |
| Immigrants from Jamaica | 0.1 /100 | #257 | Tragic 15.6% |
| Shoshone | 0.1 /100 | #258 | Tragic 15.6% |
| Cape Verdeans | 0.1 /100 | #259 | Tragic 15.6% |
Immigrants from Burma/Myanmar Female Poverty Correlation Summary
| Measurement | Immigrants from Burma/Myanmar Data | Female Poverty Data |
| Minimum | 0.038% | 6.5% |
| Maximum | 17.4% | 36.2% |
| Range | 17.4% | 29.7% |
| Mean | 3.5% | 17.0% |
| Median | 2.7% | 15.8% |
| Interquartile 25% (IQ1) | 1.3% | 13.2% |
| Interquartile 75% (IQ3) | 4.3% | 19.2% |
| Interquartile Range (IQR) | 3.0% | 6.1% |
| Standard Deviation (Sample) | 3.3% | 6.4% |
| Standard Deviation (Population) | 3.3% | 6.4% |
Correlation Details
| Immigrants from Burma/Myanmar Percentile | Sample Size | Female Poverty |
[ 0.0% - 0.5% ] 0.038% | 109,818,160 | 15.2% |
[ 0.0% - 0.5% ] 0.12% | 28,017,407 | 13.4% |
[ 0.0% - 0.5% ] 0.22% | 10,629,601 | 13.7% |
[ 0.0% - 0.5% ] 0.30% | 4,414,227 | 13.9% |
[ 0.0% - 0.5% ] 0.38% | 3,395,444 | 12.0% |
[ 0.0% - 0.5% ] 0.48% | 2,403,819 | 16.3% |
[ 0.5% - 1.0% ] 0.58% | 2,459,066 | 16.5% |
[ 0.5% - 1.0% ] 0.65% | 1,513,851 | 12.8% |
[ 0.5% - 1.0% ] 0.73% | 1,356,110 | 12.1% |
[ 0.5% - 1.0% ] 0.84% | 1,123,551 | 17.1% |
[ 0.5% - 1.0% ] 0.92% | 636,007 | 14.9% |
[ 1.0% - 1.5% ] 1.00% | 592,676 | 14.7% |
[ 1.0% - 1.5% ] 1.08% | 1,357,765 | 15.6% |
[ 1.0% - 1.5% ] 1.17% | 419,756 | 13.8% |
[ 1.0% - 1.5% ] 1.26% | 438,016 | 16.1% |
[ 1.0% - 1.5% ] 1.34% | 223,860 | 17.2% |
[ 1.0% - 1.5% ] 1.43% | 406,228 | 16.2% |
[ 1.5% - 2.0% ] 1.51% | 310,391 | 18.0% |
[ 1.5% - 2.0% ] 1.63% | 392,187 | 16.5% |
[ 1.5% - 2.0% ] 1.69% | 182,155 | 15.4% |
[ 1.5% - 2.0% ] 1.79% | 185,148 | 13.2% |
[ 1.5% - 2.0% ] 1.86% | 432,147 | 19.2% |
[ 1.5% - 2.0% ] 1.97% | 19,626 | 6.5% |
[ 2.0% - 2.5% ] 2.06% | 256,522 | 8.6% |
[ 2.0% - 2.5% ] 2.13% | 35,419 | 28.8% |
[ 2.0% - 2.5% ] 2.22% | 55,094 | 14.2% |
[ 2.0% - 2.5% ] 2.29% | 12,866 | 21.7% |
[ 2.0% - 2.5% ] 2.37% | 51,767 | 15.7% |
[ 2.0% - 2.5% ] 2.48% | 133,569 | 19.0% |
[ 2.5% - 3.0% ] 2.55% | 126,252 | 20.8% |
[ 2.5% - 3.0% ] 2.63% | 48,939 | 19.4% |
[ 2.5% - 3.0% ] 2.74% | 85,513 | 13.5% |
[ 2.5% - 3.0% ] 2.81% | 34,537 | 16.9% |
[ 3.0% - 3.5% ] 3.03% | 24,684 | 28.0% |
[ 3.0% - 3.5% ] 3.10% | 94,089 | 25.2% |
[ 3.0% - 3.5% ] 3.19% | 24,971 | 10.8% |
[ 3.0% - 3.5% ] 3.27% | 33,912 | 11.7% |
[ 3.0% - 3.5% ] 3.34% | 15,556 | 15.6% |
[ 3.0% - 3.5% ] 3.47% | 58,574 | 15.9% |
[ 3.5% - 4.0% ] 3.53% | 12,010 | 9.7% |
[ 3.5% - 4.0% ] 3.65% | 3,126 | 16.7% |
[ 3.5% - 4.0% ] 3.70% | 23,980 | 28.1% |
[ 3.5% - 4.0% ] 3.81% | 57,662 | 22.4% |
[ 3.5% - 4.0% ] 3.88% | 15,899 | 11.0% |
[ 4.0% - 4.5% ] 4.12% | 25,699 | 36.2% |
[ 4.0% - 4.5% ] 4.21% | 23,879 | 9.0% |
[ 4.0% - 4.5% ] 4.31% | 81,015 | 25.0% |
[ 4.0% - 4.5% ] 4.36% | 2,039 | 6.7% |
[ 4.0% - 4.5% ] 4.48% | 2,029 | 15.5% |
[ 4.5% - 5.0% ] 4.69% | 14,553 | 30.1% |
[ 4.5% - 5.0% ] 4.78% | 2,219 | 11.3% |
[ 5.0% - 5.5% ] 5.11% | 5,268 | 29.3% |
[ 5.0% - 5.5% ] 5.33% | 37,834 | 17.6% |
[ 6.0% - 6.5% ] 6.45% | 19,501 | 27.0% |
[ 6.5% - 7.0% ] 6.88% | 19,613 | 31.7% |
[ 7.5% - 8.0% ] 7.81% | 39,082 | 7.2% |
[ 7.5% - 8.0% ] 7.92% | 56,794 | 17.3% |
[ 8.5% - 9.0% ] 8.70% | 1,035 | 9.8% |
[ 11.0% - 11.5% ] 11.17% | 403 | 20.7% |
[ 12.0% - 12.5% ] 12.20% | 738 | 14.1% |
[ 12.5% - 13.0% ] 12.78% | 266 | 17.1% |
[ 17.0% - 17.5% ] 17.43% | 2,088 | 11.6% |