Immigrants from Burma/Myanmar Median Household Income
COMPARE
Immigrants from Burma/Myanmar
Select to Compare
Median Household Income
Immigrants from Burma/Myanmar Median Household Income
$78,682
HOUSEHOLD INCOME
1.6/ 100
METRIC RATING
247th/ 347
METRIC RANK
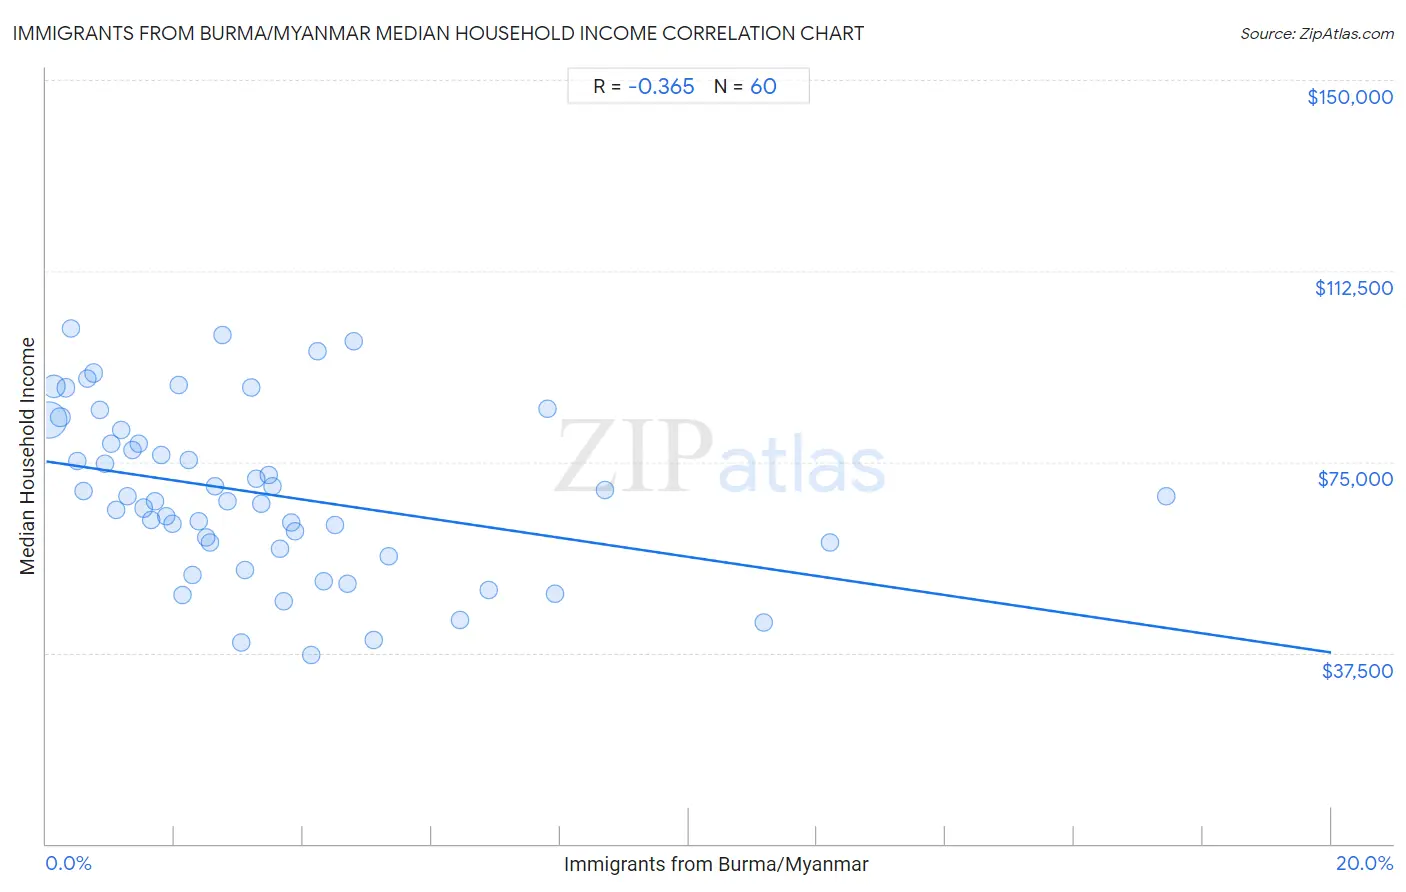
Immigrants from Burma/Myanmar Median Household Income Correlation Chart
The statistical analysis conducted on geographies consisting of 172,235,466 people shows a mild negative correlation between the proportion of Immigrants from Burma/Myanmar and median household income in the United States with a correlation coefficient (R) of -0.365 and weighted average of $78,682. On average, for every 1% (one percent) increase in Immigrants from Burma/Myanmar within a typical geography, there is a decrease of $1,877 in median household income.
It is essential to understand that the correlation between the percentage of Immigrants from Burma/Myanmar and median household income does not imply a direct cause-and-effect relationship. It remains uncertain whether the presence of Immigrants from Burma/Myanmar influences an upward or downward trend in the level of median household income within an area, or if Immigrants from Burma/Myanmar simply ended up residing in those areas with higher or lower levels of median household income due to other factors.
Demographics Similar to Immigrants from Burma/Myanmar by Median Household Income
In terms of median household income, the demographic groups most similar to Immigrants from Burma/Myanmar are Central American ($78,803, a difference of 0.15%), Sudanese ($78,529, a difference of 0.19%), Inupiat ($78,841, a difference of 0.20%), West Indian ($78,455, a difference of 0.29%), and Marshallese ($78,930, a difference of 0.32%).
| Demographics | Rating | Rank | Median Household Income |
| Immigrants from Western Africa | 2.7 /100 | #240 | Tragic $79,490 |
| Nonimmigrants | 2.6 /100 | #241 | Tragic $79,429 |
| Immigrants from Sudan | 2.1 /100 | #242 | Tragic $79,103 |
| Immigrants from Barbados | 1.9 /100 | #243 | Tragic $78,989 |
| Marshallese | 1.9 /100 | #244 | Tragic $78,930 |
| Inupiat | 1.8 /100 | #245 | Tragic $78,841 |
| Central Americans | 1.7 /100 | #246 | Tragic $78,803 |
| Immigrants from Burma/Myanmar | 1.6 /100 | #247 | Tragic $78,682 |
| Sudanese | 1.5 /100 | #248 | Tragic $78,529 |
| West Indians | 1.4 /100 | #249 | Tragic $78,455 |
| Immigrants from Laos | 1.3 /100 | #250 | Tragic $78,327 |
| Mexican American Indians | 1.2 /100 | #251 | Tragic $78,166 |
| Immigrants from West Indies | 1.0 /100 | #252 | Tragic $77,956 |
| Immigrants from St. Vincent and the Grenadines | 0.9 /100 | #253 | Tragic $77,690 |
| Sub-Saharan Africans | 0.8 /100 | #254 | Tragic $77,631 |
Immigrants from Burma/Myanmar Median Household Income Correlation Summary
| Measurement | Immigrants from Burma/Myanmar Data | Median Household Income Data |
| Minimum | 0.038% | $36,966 |
| Maximum | 17.4% | $101,230 |
| Range | 17.4% | $64,264 |
| Mean | 3.3% | $68,823 |
| Median | 2.6% | $67,779 |
| Interquartile 25% (IQ1) | 1.3% | $58,487 |
| Interquartile 75% (IQ3) | 4.2% | $79,866 |
| Interquartile Range (IQR) | 2.9% | $21,379 |
| Standard Deviation (Sample) | 3.2% | $16,228 |
| Standard Deviation (Population) | 3.1% | $16,092 |
Correlation Details
| Immigrants from Burma/Myanmar Percentile | Sample Size | Median Household Income |
[ 0.0% - 0.5% ] 0.038% | 109,811,681 | $83,159 |
[ 0.0% - 0.5% ] 0.12% | 28,003,948 | $89,755 |
[ 0.0% - 0.5% ] 0.22% | 10,618,269 | $83,788 |
[ 0.0% - 0.5% ] 0.30% | 4,417,125 | $89,625 |
[ 0.0% - 0.5% ] 0.38% | 3,395,444 | $101,230 |
[ 0.0% - 0.5% ] 0.48% | 2,403,819 | $75,217 |
[ 0.5% - 1.0% ] 0.58% | 2,459,066 | $69,294 |
[ 0.5% - 1.0% ] 0.65% | 1,513,851 | $91,337 |
[ 0.5% - 1.0% ] 0.73% | 1,356,368 | $92,451 |
[ 0.5% - 1.0% ] 0.84% | 1,123,551 | $85,230 |
[ 0.5% - 1.0% ] 0.92% | 636,007 | $74,740 |
[ 1.0% - 1.5% ] 1.00% | 592,676 | $78,468 |
[ 1.0% - 1.5% ] 1.08% | 1,357,765 | $65,627 |
[ 1.0% - 1.5% ] 1.17% | 419,756 | $81,264 |
[ 1.0% - 1.5% ] 1.26% | 438,016 | $68,206 |
[ 1.0% - 1.5% ] 1.34% | 223,860 | $77,310 |
[ 1.0% - 1.5% ] 1.43% | 406,228 | $78,460 |
[ 1.5% - 2.0% ] 1.51% | 310,391 | $65,921 |
[ 1.5% - 2.0% ] 1.63% | 391,878 | $63,689 |
[ 1.5% - 2.0% ] 1.69% | 182,155 | $67,294 |
[ 1.5% - 2.0% ] 1.79% | 185,148 | $76,397 |
[ 1.5% - 2.0% ] 1.86% | 432,147 | $64,343 |
[ 1.5% - 2.0% ] 1.97% | 19,626 | $62,898 |
[ 2.0% - 2.5% ] 2.06% | 256,522 | $90,004 |
[ 2.0% - 2.5% ] 2.13% | 35,419 | $48,779 |
[ 2.0% - 2.5% ] 2.22% | 55,094 | $75,305 |
[ 2.0% - 2.5% ] 2.29% | 12,866 | $52,806 |
[ 2.0% - 2.5% ] 2.37% | 51,767 | $63,273 |
[ 2.0% - 2.5% ] 2.48% | 133,569 | $60,061 |
[ 2.5% - 3.0% ] 2.55% | 126,252 | $59,082 |
[ 2.5% - 3.0% ] 2.63% | 48,939 | $70,289 |
[ 2.5% - 3.0% ] 2.74% | 85,513 | $99,851 |
[ 2.5% - 3.0% ] 2.81% | 34,537 | $67,375 |
[ 3.0% - 3.5% ] 3.03% | 24,684 | $39,615 |
[ 3.0% - 3.5% ] 3.10% | 94,089 | $53,696 |
[ 3.0% - 3.5% ] 3.19% | 24,971 | $89,491 |
[ 3.0% - 3.5% ] 3.27% | 33,912 | $71,802 |
[ 3.0% - 3.5% ] 3.34% | 15,556 | $66,734 |
[ 3.0% - 3.5% ] 3.47% | 58,574 | $72,445 |
[ 3.5% - 4.0% ] 3.53% | 12,010 | $70,232 |
[ 3.5% - 4.0% ] 3.65% | 3,126 | $57,893 |
[ 3.5% - 4.0% ] 3.70% | 23,980 | $47,558 |
[ 3.5% - 4.0% ] 3.81% | 57,662 | $63,179 |
[ 3.5% - 4.0% ] 3.88% | 15,899 | $61,444 |
[ 4.0% - 4.5% ] 4.12% | 25,699 | $36,966 |
[ 4.0% - 4.5% ] 4.21% | 23,879 | $96,750 |
[ 4.0% - 4.5% ] 4.31% | 81,015 | $51,665 |
[ 4.0% - 4.5% ] 4.48% | 2,029 | $62,500 |
[ 4.5% - 5.0% ] 4.69% | 14,553 | $51,122 |
[ 4.5% - 5.0% ] 4.78% | 2,219 | $98,621 |
[ 5.0% - 5.5% ] 5.11% | 5,268 | $40,091 |
[ 5.0% - 5.5% ] 5.33% | 37,834 | $56,480 |
[ 6.0% - 6.5% ] 6.45% | 19,501 | $43,960 |
[ 6.5% - 7.0% ] 6.88% | 19,613 | $49,911 |
[ 7.5% - 8.0% ] 7.81% | 39,082 | $85,440 |
[ 7.5% - 8.0% ] 7.92% | 56,794 | $49,032 |
[ 8.5% - 9.0% ] 8.70% | 1,035 | $69,375 |
[ 11.0% - 11.5% ] 11.17% | 403 | $43,409 |
[ 12.0% - 12.5% ] 12.20% | 738 | $59,286 |
[ 17.0% - 17.5% ] 17.43% | 2,088 | $68,182 |