Immigrants from Burma/Myanmar Disability Age 5 to 17
COMPARE
Immigrants from Burma/Myanmar
Select to Compare
Disability Age 5 to 17
Immigrants from Burma/Myanmar Disability Age 5 to 17
5.6%
DISABILITY | AGE 5 TO 17
59.3/ 100
METRIC RATING
167th/ 347
METRIC RANK
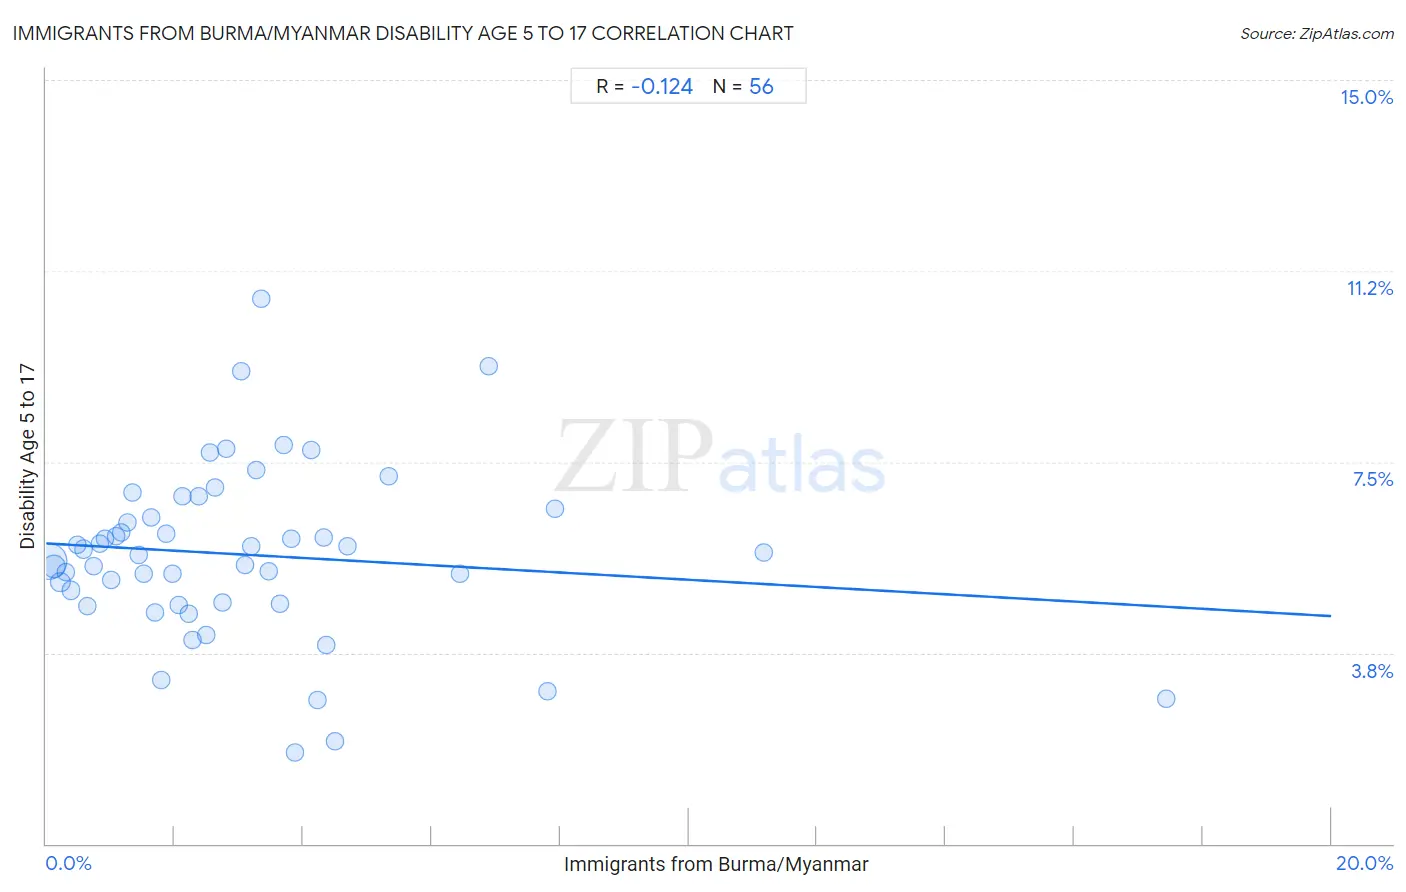
Immigrants from Burma/Myanmar Disability Age 5 to 17 Correlation Chart
The statistical analysis conducted on geographies consisting of 171,966,174 people shows a poor negative correlation between the proportion of Immigrants from Burma/Myanmar and percentage of population with a disability between the ages 5 and 17 in the United States with a correlation coefficient (R) of -0.124 and weighted average of 5.6%. On average, for every 1% (one percent) increase in Immigrants from Burma/Myanmar within a typical geography, there is a decrease of 0.071% in percentage of population with a disability between the ages 5 and 17.
It is essential to understand that the correlation between the percentage of Immigrants from Burma/Myanmar and percentage of population with a disability between the ages 5 and 17 does not imply a direct cause-and-effect relationship. It remains uncertain whether the presence of Immigrants from Burma/Myanmar influences an upward or downward trend in the level of percentage of population with a disability between the ages 5 and 17 within an area, or if Immigrants from Burma/Myanmar simply ended up residing in those areas with higher or lower levels of percentage of population with a disability between the ages 5 and 17 due to other factors.
Demographics Similar to Immigrants from Burma/Myanmar by Disability Age 5 to 17
In terms of disability age 5 to 17, the demographic groups most similar to Immigrants from Burma/Myanmar are Greek (5.6%, a difference of 0.070%), Lebanese (5.6%, a difference of 0.11%), Immigrants from Scotland (5.6%, a difference of 0.13%), Iraqi (5.6%, a difference of 0.17%), and Immigrants from Norway (5.6%, a difference of 0.18%).
| Demographics | Rating | Rank | Disability Age 5 to 17 |
| South Africans | 73.3 /100 | #160 | Good 5.5% |
| Immigrants from Saudi Arabia | 69.1 /100 | #161 | Good 5.5% |
| Zimbabweans | 67.2 /100 | #162 | Good 5.5% |
| Immigrants from Southern Europe | 64.0 /100 | #163 | Good 5.6% |
| Immigrants from Scotland | 61.9 /100 | #164 | Good 5.6% |
| Lebanese | 61.4 /100 | #165 | Good 5.6% |
| Greeks | 60.6 /100 | #166 | Good 5.6% |
| Immigrants from Burma/Myanmar | 59.3 /100 | #167 | Average 5.6% |
| Iraqis | 56.0 /100 | #168 | Average 5.6% |
| Immigrants from Norway | 55.7 /100 | #169 | Average 5.6% |
| Serbians | 54.0 /100 | #170 | Average 5.6% |
| Immigrants from Iraq | 53.9 /100 | #171 | Average 5.6% |
| Ukrainians | 51.5 /100 | #172 | Average 5.6% |
| Uruguayans | 51.0 /100 | #173 | Average 5.6% |
| Costa Ricans | 50.0 /100 | #174 | Average 5.6% |
Immigrants from Burma/Myanmar Disability Age 5 to 17 Correlation Summary
| Measurement | Immigrants from Burma/Myanmar Data | Disability Age 5 to 17 Data |
| Minimum | 0.038% | 1.8% |
| Maximum | 17.4% | 10.7% |
| Range | 17.4% | 8.9% |
| Mean | 3.1% | 5.7% |
| Median | 2.4% | 5.7% |
| Interquartile 25% (IQ1) | 1.2% | 4.7% |
| Interquartile 75% (IQ3) | 3.8% | 6.5% |
| Interquartile Range (IQR) | 2.6% | 1.8% |
| Standard Deviation (Sample) | 2.9% | 1.7% |
| Standard Deviation (Population) | 2.9% | 1.7% |
Correlation Details
| Immigrants from Burma/Myanmar Percentile | Sample Size | Disability Age 5 to 17 |
[ 0.0% - 0.5% ] 0.038% | 109,754,605 | 5.5% |
[ 0.0% - 0.5% ] 0.12% | 27,971,148 | 5.5% |
[ 0.0% - 0.5% ] 0.22% | 10,580,715 | 5.1% |
[ 0.0% - 0.5% ] 0.30% | 4,380,021 | 5.3% |
[ 0.0% - 0.5% ] 0.38% | 3,373,392 | 5.0% |
[ 0.0% - 0.5% ] 0.48% | 2,417,943 | 5.9% |
[ 0.5% - 1.0% ] 0.58% | 2,457,568 | 5.8% |
[ 0.5% - 1.0% ] 0.65% | 1,509,778 | 4.7% |
[ 0.5% - 1.0% ] 0.73% | 1,348,078 | 5.4% |
[ 0.5% - 1.0% ] 0.84% | 1,118,936 | 5.9% |
[ 0.5% - 1.0% ] 0.92% | 633,182 | 6.0% |
[ 1.0% - 1.5% ] 1.00% | 588,391 | 5.2% |
[ 1.0% - 1.5% ] 1.08% | 1,351,998 | 6.0% |
[ 1.0% - 1.5% ] 1.17% | 423,092 | 6.1% |
[ 1.0% - 1.5% ] 1.26% | 438,016 | 6.3% |
[ 1.0% - 1.5% ] 1.34% | 223,860 | 6.9% |
[ 1.0% - 1.5% ] 1.43% | 395,437 | 5.7% |
[ 1.5% - 2.0% ] 1.51% | 310,391 | 5.3% |
[ 1.5% - 2.0% ] 1.63% | 364,237 | 6.4% |
[ 1.5% - 2.0% ] 1.69% | 182,155 | 4.5% |
[ 1.5% - 2.0% ] 1.79% | 181,526 | 3.2% |
[ 1.5% - 2.0% ] 1.86% | 432,147 | 6.1% |
[ 1.5% - 2.0% ] 1.97% | 19,626 | 5.3% |
[ 2.0% - 2.5% ] 2.06% | 256,522 | 4.7% |
[ 2.0% - 2.5% ] 2.13% | 35,419 | 6.8% |
[ 2.0% - 2.5% ] 2.22% | 55,094 | 4.5% |
[ 2.0% - 2.5% ] 2.29% | 12,778 | 4.0% |
[ 2.0% - 2.5% ] 2.37% | 52,234 | 6.8% |
[ 2.0% - 2.5% ] 2.48% | 131,759 | 4.1% |
[ 2.5% - 3.0% ] 2.55% | 126,252 | 7.7% |
[ 2.5% - 3.0% ] 2.63% | 48,939 | 7.0% |
[ 2.5% - 3.0% ] 2.74% | 85,513 | 4.7% |
[ 2.5% - 3.0% ] 2.81% | 32,978 | 7.8% |
[ 3.0% - 3.5% ] 3.03% | 24,684 | 9.3% |
[ 3.0% - 3.5% ] 3.10% | 94,089 | 5.5% |
[ 3.0% - 3.5% ] 3.19% | 24,504 | 5.8% |
[ 3.0% - 3.5% ] 3.27% | 31,976 | 7.3% |
[ 3.0% - 3.5% ] 3.35% | 13,421 | 10.7% |
[ 3.0% - 3.5% ] 3.47% | 58,574 | 5.4% |
[ 3.5% - 4.0% ] 3.65% | 3,126 | 4.7% |
[ 3.5% - 4.0% ] 3.70% | 23,980 | 7.8% |
[ 3.5% - 4.0% ] 3.81% | 57,662 | 6.0% |
[ 3.5% - 4.0% ] 3.88% | 15,899 | 1.8% |
[ 4.0% - 4.5% ] 4.12% | 25,699 | 7.7% |
[ 4.0% - 4.5% ] 4.21% | 23,879 | 2.8% |
[ 4.0% - 4.5% ] 4.31% | 81,015 | 6.0% |
[ 4.0% - 4.5% ] 4.36% | 2,039 | 3.9% |
[ 4.0% - 4.5% ] 4.48% | 2,029 | 2.0% |
[ 4.5% - 5.0% ] 4.69% | 14,553 | 5.8% |
[ 5.0% - 5.5% ] 5.33% | 37,834 | 7.2% |
[ 6.0% - 6.5% ] 6.45% | 19,501 | 5.3% |
[ 6.5% - 7.0% ] 6.88% | 19,613 | 9.4% |
[ 7.5% - 8.0% ] 7.81% | 39,082 | 3.0% |
[ 7.5% - 8.0% ] 7.92% | 56,794 | 6.6% |
[ 11.0% - 11.5% ] 11.17% | 403 | 5.7% |
[ 17.0% - 17.5% ] 17.43% | 2,088 | 2.8% |