Immigrants from Burma/Myanmar Single Female Poverty
COMPARE
Immigrants from Burma/Myanmar
Select to Compare
Single Female Poverty
Immigrants from Burma/Myanmar Single Female Poverty
22.6%
POVERTY | SINGLE FEMALES
0.8/ 100
METRIC RATING
254th/ 347
METRIC RANK
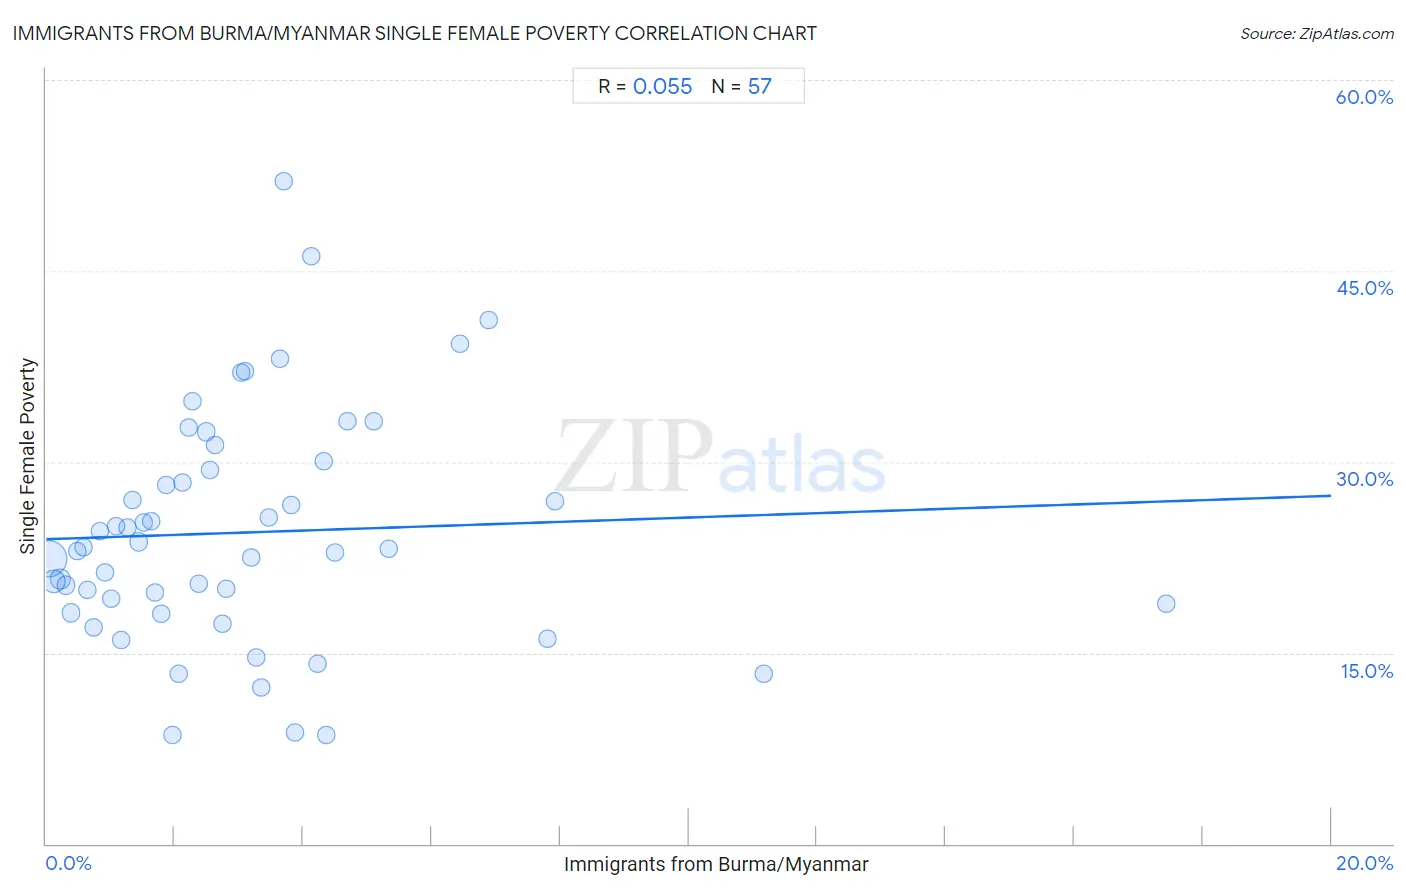
Immigrants from Burma/Myanmar Single Female Poverty Correlation Chart
The statistical analysis conducted on geographies consisting of 171,274,747 people shows a slight positive correlation between the proportion of Immigrants from Burma/Myanmar and poverty level among single females in the United States with a correlation coefficient (R) of 0.055 and weighted average of 22.6%. On average, for every 1% (one percent) increase in Immigrants from Burma/Myanmar within a typical geography, there is an increase of 0.17% in poverty level among single females.
It is essential to understand that the correlation between the percentage of Immigrants from Burma/Myanmar and poverty level among single females does not imply a direct cause-and-effect relationship. It remains uncertain whether the presence of Immigrants from Burma/Myanmar influences an upward or downward trend in the level of poverty level among single females within an area, or if Immigrants from Burma/Myanmar simply ended up residing in those areas with higher or lower levels of poverty level among single females due to other factors.
Demographics Similar to Immigrants from Burma/Myanmar by Single Female Poverty
In terms of single female poverty, the demographic groups most similar to Immigrants from Burma/Myanmar are Immigrants from Sudan (22.6%, a difference of 0.0%), Immigrants from Liberia (22.5%, a difference of 0.10%), Immigrants from Belize (22.6%, a difference of 0.15%), Delaware (22.5%, a difference of 0.19%), and Sudanese (22.6%, a difference of 0.29%).
| Demographics | Rating | Rank | Single Female Poverty |
| Immigrants from El Salvador | 1.4 /100 | #247 | Tragic 22.4% |
| Belizeans | 1.4 /100 | #248 | Tragic 22.4% |
| Immigrants from Caribbean | 1.3 /100 | #249 | Tragic 22.4% |
| Immigrants from Bahamas | 1.2 /100 | #250 | Tragic 22.5% |
| Immigrants from West Indies | 1.0 /100 | #251 | Tragic 22.5% |
| Delaware | 1.0 /100 | #252 | Tragic 22.5% |
| Immigrants from Liberia | 0.9 /100 | #253 | Tragic 22.5% |
| Immigrants from Burma/Myanmar | 0.8 /100 | #254 | Tragic 22.6% |
| Immigrants from Sudan | 0.8 /100 | #255 | Tragic 22.6% |
| Immigrants from Belize | 0.8 /100 | #256 | Tragic 22.6% |
| Sudanese | 0.7 /100 | #257 | Tragic 22.6% |
| Bahamians | 0.6 /100 | #258 | Tragic 22.7% |
| Whites/Caucasians | 0.6 /100 | #259 | Tragic 22.7% |
| Celtics | 0.5 /100 | #260 | Tragic 22.7% |
| Immigrants from Cabo Verde | 0.4 /100 | #261 | Tragic 22.8% |
Immigrants from Burma/Myanmar Single Female Poverty Correlation Summary
| Measurement | Immigrants from Burma/Myanmar Data | Single Female Poverty Data |
| Minimum | 0.038% | 8.5% |
| Maximum | 17.4% | 52.0% |
| Range | 17.4% | 43.5% |
| Mean | 3.1% | 24.5% |
| Median | 2.5% | 23.1% |
| Interquartile 25% (IQ1) | 1.2% | 18.5% |
| Interquartile 75% (IQ3) | 4.0% | 29.7% |
| Interquartile Range (IQR) | 2.8% | 11.2% |
| Standard Deviation (Sample) | 2.9% | 9.1% |
| Standard Deviation (Population) | 2.9% | 9.1% |
Correlation Details
| Immigrants from Burma/Myanmar Percentile | Sample Size | Single Female Poverty |
[ 0.0% - 0.5% ] 0.038% | 109,599,089 | 22.4% |
[ 0.0% - 0.5% ] 0.12% | 27,694,128 | 20.6% |
[ 0.0% - 0.5% ] 0.22% | 10,500,912 | 20.8% |
[ 0.0% - 0.5% ] 0.30% | 4,324,964 | 20.3% |
[ 0.0% - 0.5% ] 0.38% | 3,285,690 | 18.2% |
[ 0.0% - 0.5% ] 0.48% | 2,381,895 | 23.0% |
[ 0.5% - 1.0% ] 0.58% | 2,450,241 | 23.3% |
[ 0.5% - 1.0% ] 0.65% | 1,500,224 | 19.9% |
[ 0.5% - 1.0% ] 0.73% | 1,356,110 | 17.0% |
[ 0.5% - 1.0% ] 0.84% | 1,118,936 | 24.5% |
[ 0.5% - 1.0% ] 0.92% | 632,964 | 21.3% |
[ 1.0% - 1.5% ] 1.00% | 592,676 | 19.3% |
[ 1.0% - 1.5% ] 1.08% | 1,354,015 | 25.0% |
[ 1.0% - 1.5% ] 1.17% | 419,756 | 16.0% |
[ 1.0% - 1.5% ] 1.26% | 437,282 | 24.9% |
[ 1.0% - 1.5% ] 1.34% | 223,860 | 27.0% |
[ 1.0% - 1.5% ] 1.43% | 394,578 | 23.7% |
[ 1.5% - 2.0% ] 1.51% | 307,176 | 25.2% |
[ 1.5% - 2.0% ] 1.63% | 385,199 | 25.4% |
[ 1.5% - 2.0% ] 1.69% | 178,707 | 19.7% |
[ 1.5% - 2.0% ] 1.79% | 175,927 | 18.1% |
[ 1.5% - 2.0% ] 1.86% | 430,770 | 28.2% |
[ 1.5% - 2.0% ] 1.97% | 19,626 | 8.5% |
[ 2.0% - 2.5% ] 2.06% | 256,522 | 13.4% |
[ 2.0% - 2.5% ] 2.13% | 35,419 | 28.4% |
[ 2.0% - 2.5% ] 2.22% | 55,094 | 32.7% |
[ 2.0% - 2.5% ] 2.29% | 12,778 | 34.7% |
[ 2.0% - 2.5% ] 2.37% | 51,767 | 20.5% |
[ 2.0% - 2.5% ] 2.48% | 132,627 | 32.4% |
[ 2.5% - 3.0% ] 2.55% | 122,537 | 29.3% |
[ 2.5% - 3.0% ] 2.63% | 48,939 | 31.3% |
[ 2.5% - 3.0% ] 2.74% | 85,513 | 17.2% |
[ 2.5% - 3.0% ] 2.81% | 31,634 | 20.0% |
[ 3.0% - 3.5% ] 3.03% | 24,684 | 37.0% |
[ 3.0% - 3.5% ] 3.10% | 94,089 | 37.2% |
[ 3.0% - 3.5% ] 3.19% | 24,971 | 22.5% |
[ 3.0% - 3.5% ] 3.27% | 31,976 | 14.6% |
[ 3.0% - 3.5% ] 3.35% | 13,421 | 12.3% |
[ 3.0% - 3.5% ] 3.47% | 57,587 | 25.7% |
[ 3.5% - 4.0% ] 3.65% | 3,126 | 38.1% |
[ 3.5% - 4.0% ] 3.70% | 23,980 | 52.0% |
[ 3.5% - 4.0% ] 3.81% | 57,662 | 26.6% |
[ 3.5% - 4.0% ] 3.88% | 15,899 | 8.7% |
[ 4.0% - 4.5% ] 4.12% | 25,699 | 46.2% |
[ 4.0% - 4.5% ] 4.21% | 23,879 | 14.1% |
[ 4.0% - 4.5% ] 4.31% | 81,015 | 30.0% |
[ 4.0% - 4.5% ] 4.36% | 2,039 | 8.6% |
[ 4.0% - 4.5% ] 4.48% | 2,029 | 22.9% |
[ 4.5% - 5.0% ] 4.69% | 14,553 | 33.2% |
[ 5.0% - 5.5% ] 5.11% | 5,268 | 33.2% |
[ 5.0% - 5.5% ] 5.33% | 37,834 | 23.1% |
[ 6.0% - 6.5% ] 6.45% | 19,501 | 39.3% |
[ 6.5% - 7.0% ] 6.88% | 19,613 | 41.2% |
[ 7.5% - 8.0% ] 7.81% | 39,082 | 16.1% |
[ 7.5% - 8.0% ] 7.92% | 56,794 | 26.9% |
[ 11.0% - 11.5% ] 11.17% | 403 | 13.3% |
[ 17.0% - 17.5% ] 17.43% | 2,088 | 18.8% |