Immigrants from Burma/Myanmar Disability Age Over 75
COMPARE
Immigrants from Burma/Myanmar
Select to Compare
Disability Age Over 75
Immigrants from Burma/Myanmar Disability Age Over 75
47.9%
DISABILITY | AGE OVER 75
11.7/ 100
METRIC RATING
212th/ 347
METRIC RANK
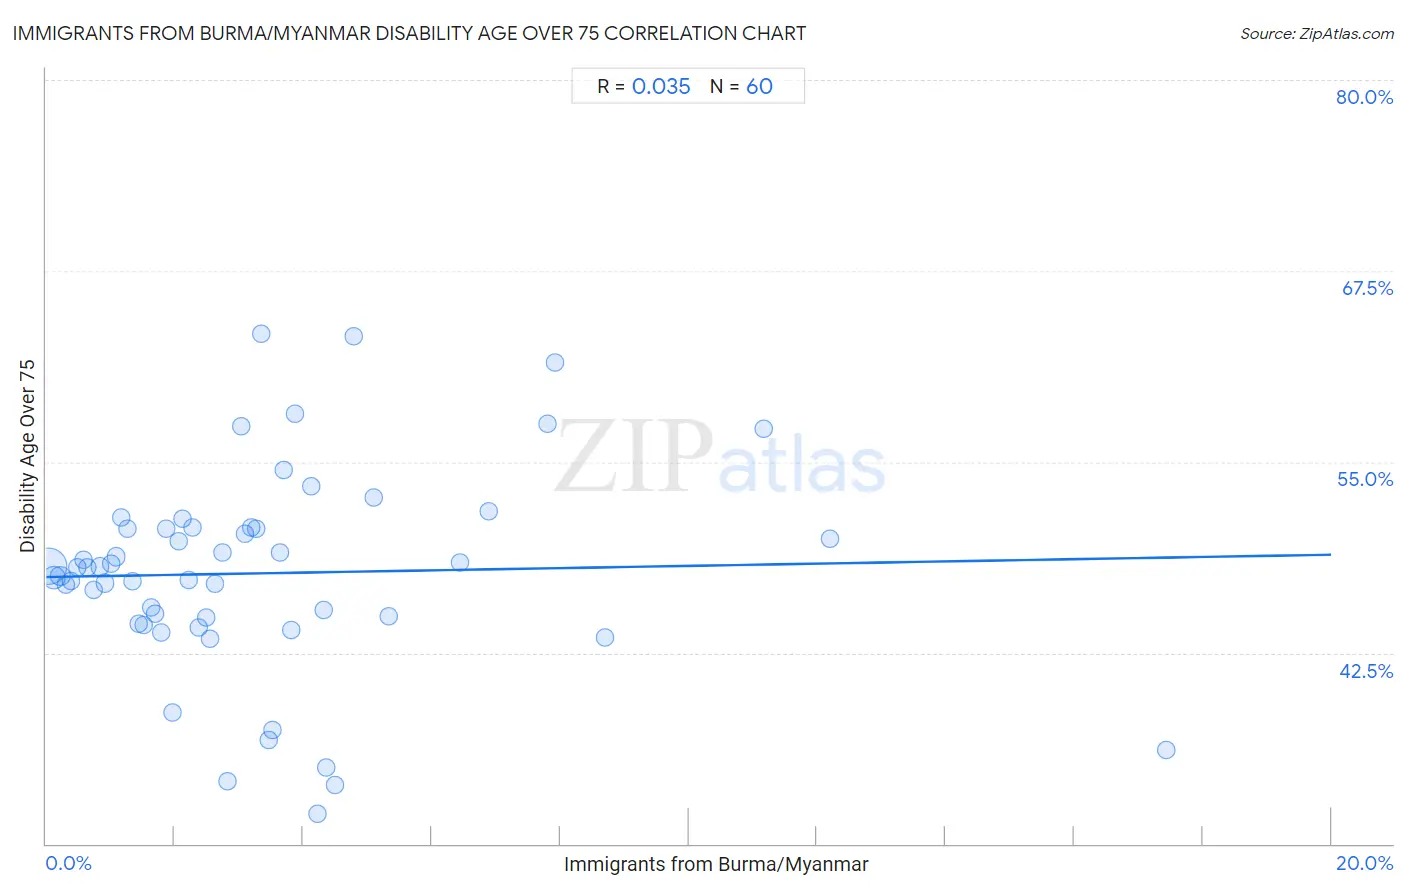
Immigrants from Burma/Myanmar Disability Age Over 75 Correlation Chart
The statistical analysis conducted on geographies consisting of 172,144,400 people shows no correlation between the proportion of Immigrants from Burma/Myanmar and percentage of population with a disability over the age of 75 in the United States with a correlation coefficient (R) of 0.035 and weighted average of 47.9%. On average, for every 1% (one percent) increase in Immigrants from Burma/Myanmar within a typical geography, there is an increase of 0.073% in percentage of population with a disability over the age of 75.
It is essential to understand that the correlation between the percentage of Immigrants from Burma/Myanmar and percentage of population with a disability over the age of 75 does not imply a direct cause-and-effect relationship. It remains uncertain whether the presence of Immigrants from Burma/Myanmar influences an upward or downward trend in the level of percentage of population with a disability over the age of 75 within an area, or if Immigrants from Burma/Myanmar simply ended up residing in those areas with higher or lower levels of percentage of population with a disability over the age of 75 due to other factors.
Demographics Similar to Immigrants from Burma/Myanmar by Disability Age Over 75
In terms of disability age over 75, the demographic groups most similar to Immigrants from Burma/Myanmar are Panamanian (47.9%, a difference of 0.0%), Vietnamese (47.9%, a difference of 0.010%), Laotian (47.9%, a difference of 0.010%), Immigrants from Barbados (47.9%, a difference of 0.060%), and Senegalese (47.9%, a difference of 0.060%).
| Demographics | Rating | Rank | Disability Age Over 75 |
| Immigrants from Ghana | 19.1 /100 | #205 | Poor 47.7% |
| Jamaicans | 19.0 /100 | #206 | Poor 47.7% |
| Immigrants from Syria | 17.4 /100 | #207 | Poor 47.8% |
| Immigrants from Senegal | 16.9 /100 | #208 | Poor 47.8% |
| Immigrants from Indonesia | 14.2 /100 | #209 | Poor 47.8% |
| Vietnamese | 11.9 /100 | #210 | Poor 47.9% |
| Panamanians | 11.8 /100 | #211 | Poor 47.9% |
| Immigrants from Burma/Myanmar | 11.7 /100 | #212 | Poor 47.9% |
| Laotians | 11.5 /100 | #213 | Poor 47.9% |
| Immigrants from Barbados | 10.7 /100 | #214 | Poor 47.9% |
| Senegalese | 10.7 /100 | #215 | Poor 47.9% |
| Immigrants from Panama | 10.2 /100 | #216 | Poor 47.9% |
| Immigrants from Grenada | 9.4 /100 | #217 | Tragic 47.9% |
| Immigrants from Western Africa | 8.3 /100 | #218 | Tragic 48.0% |
| Immigrants from Western Asia | 7.5 /100 | #219 | Tragic 48.0% |
Immigrants from Burma/Myanmar Disability Age Over 75 Correlation Summary
| Measurement | Immigrants from Burma/Myanmar Data | Disability Age Over 75 Data |
| Minimum | 0.038% | 32.0% |
| Maximum | 17.4% | 63.4% |
| Range | 17.4% | 31.4% |
| Mean | 3.3% | 47.7% |
| Median | 2.6% | 48.1% |
| Interquartile 25% (IQ1) | 1.3% | 44.6% |
| Interquartile 75% (IQ3) | 4.2% | 50.7% |
| Interquartile Range (IQR) | 2.9% | 6.1% |
| Standard Deviation (Sample) | 3.2% | 6.7% |
| Standard Deviation (Population) | 3.1% | 6.6% |
Correlation Details
| Immigrants from Burma/Myanmar Percentile | Sample Size | Disability Age Over 75 |
[ 0.0% - 0.5% ] 0.038% | 109,803,296 | 48.1% |
[ 0.0% - 0.5% ] 0.12% | 27,958,407 | 47.4% |
[ 0.0% - 0.5% ] 0.22% | 10,623,059 | 47.5% |
[ 0.0% - 0.5% ] 0.30% | 4,398,251 | 47.0% |
[ 0.0% - 0.5% ] 0.38% | 3,390,312 | 47.2% |
[ 0.0% - 0.5% ] 0.48% | 2,400,181 | 48.1% |
[ 0.5% - 1.0% ] 0.58% | 2,459,066 | 48.6% |
[ 0.5% - 1.0% ] 0.65% | 1,511,997 | 48.1% |
[ 0.5% - 1.0% ] 0.73% | 1,356,368 | 46.6% |
[ 0.5% - 1.0% ] 0.84% | 1,123,551 | 48.1% |
[ 0.5% - 1.0% ] 0.92% | 636,007 | 47.1% |
[ 1.0% - 1.5% ] 1.00% | 592,676 | 48.3% |
[ 1.0% - 1.5% ] 1.08% | 1,357,765 | 48.8% |
[ 1.0% - 1.5% ] 1.17% | 419,756 | 51.4% |
[ 1.0% - 1.5% ] 1.26% | 438,016 | 50.6% |
[ 1.0% - 1.5% ] 1.34% | 223,860 | 47.2% |
[ 1.0% - 1.5% ] 1.43% | 406,089 | 44.4% |
[ 1.5% - 2.0% ] 1.51% | 310,391 | 44.3% |
[ 1.5% - 2.0% ] 1.63% | 392,187 | 45.4% |
[ 1.5% - 2.0% ] 1.69% | 182,155 | 45.1% |
[ 1.5% - 2.0% ] 1.79% | 185,148 | 43.8% |
[ 1.5% - 2.0% ] 1.86% | 432,147 | 50.7% |
[ 1.5% - 2.0% ] 1.97% | 19,626 | 38.6% |
[ 2.0% - 2.5% ] 2.06% | 256,522 | 49.8% |
[ 2.0% - 2.5% ] 2.13% | 35,419 | 51.3% |
[ 2.0% - 2.5% ] 2.22% | 55,094 | 47.3% |
[ 2.0% - 2.5% ] 2.29% | 12,778 | 50.7% |
[ 2.0% - 2.5% ] 2.37% | 51,767 | 44.1% |
[ 2.0% - 2.5% ] 2.48% | 133,569 | 44.8% |
[ 2.5% - 3.0% ] 2.55% | 126,252 | 43.4% |
[ 2.5% - 3.0% ] 2.63% | 48,939 | 47.0% |
[ 2.5% - 3.0% ] 2.74% | 85,513 | 49.1% |
[ 2.5% - 3.0% ] 2.81% | 34,537 | 34.1% |
[ 3.0% - 3.5% ] 3.03% | 24,684 | 57.3% |
[ 3.0% - 3.5% ] 3.10% | 94,089 | 50.3% |
[ 3.0% - 3.5% ] 3.19% | 24,971 | 50.7% |
[ 3.0% - 3.5% ] 3.27% | 33,912 | 50.6% |
[ 3.0% - 3.5% ] 3.34% | 15,556 | 63.4% |
[ 3.0% - 3.5% ] 3.47% | 58,574 | 36.8% |
[ 3.5% - 4.0% ] 3.53% | 12,010 | 37.5% |
[ 3.5% - 4.0% ] 3.65% | 3,126 | 49.0% |
[ 3.5% - 4.0% ] 3.70% | 23,980 | 54.5% |
[ 3.5% - 4.0% ] 3.81% | 57,662 | 44.0% |
[ 3.5% - 4.0% ] 3.88% | 15,899 | 58.1% |
[ 4.0% - 4.5% ] 4.12% | 25,699 | 53.4% |
[ 4.0% - 4.5% ] 4.21% | 23,879 | 32.0% |
[ 4.0% - 4.5% ] 4.31% | 81,015 | 45.3% |
[ 4.0% - 4.5% ] 4.36% | 2,039 | 35.0% |
[ 4.0% - 4.5% ] 4.48% | 2,029 | 33.8% |
[ 4.5% - 5.0% ] 4.78% | 2,219 | 63.2% |
[ 5.0% - 5.5% ] 5.11% | 5,268 | 52.7% |
[ 5.0% - 5.5% ] 5.33% | 37,834 | 44.9% |
[ 6.0% - 6.5% ] 6.45% | 19,501 | 48.4% |
[ 6.5% - 7.0% ] 6.88% | 19,613 | 51.7% |
[ 7.5% - 8.0% ] 7.81% | 39,082 | 57.5% |
[ 7.5% - 8.0% ] 7.92% | 56,794 | 61.5% |
[ 8.5% - 9.0% ] 8.70% | 1,035 | 43.5% |
[ 11.0% - 11.5% ] 11.17% | 403 | 57.1% |
[ 12.0% - 12.5% ] 12.20% | 738 | 50.0% |
[ 17.0% - 17.5% ] 17.43% | 2,088 | 36.1% |