Immigrants from Burma/Myanmar Single Male Poverty

COMPARE

Immigrants from Burma/Myanmar
Race
Ancestry
AfghanAfricanAlaska NativeAlaskan AthabascanAlbanianAleutAlsatianAmericanApacheArabArapahoArgentineanArmenianAssyrian/Chaldean/SyriacAustralianAustrianBahamianBangladeshiBarbadianBasqueBelgianBelizeanBermudanBhutaneseBlackfeetBolivianBrazilianBritishBritish West IndianBulgarianBurmeseCajunCambodianCanadianCape VerdeanCarpatho RusynCelticCentral AmericanCentral American IndianCherokeeCheyenneChickasawChileanChineseChippewaChoctawColombianColvilleComancheCosta RicanCreeCreekCroatianCrowCubanCypriotCzechCzechoslovakianDanishDelawareDominicanDutchDutch West IndianEastern EuropeanEcuadorianEgyptianEnglishEstonianEthiopianEuropeanFijianFilipinoFinnishFrenchFrench American IndianFrench CanadianGermanGerman RussianGhanaianGreekGuamanian/ChamorroGuatemalanGuyaneseHaitianHmongHonduranHopiHoumaHungarianIcelanderIndian (Asian)IndonesianInupiatIranianIraqiIrishIroquoisIsraeliItalianJamaicanJapaneseJordanianKenyanKiowaKoreanLaotianLatvianLebaneseLiberianLithuanianLumbeeLuxembourgerMacedonianMalaysianMalteseMarshalleseMenomineeMexicanMexican American IndianMongolianMoroccanNative HawaiianNavajoNepaleseNew ZealanderNicaraguanNigerianNorthern EuropeanNorwegianOkinawanOsageOttawaPaiutePakistaniPalestinianPanamanianParaguayanPennsylvania GermanPeruvianPimaPolishPortuguesePotawatomiPuebloPuerto RicanPuget Sound SalishRomanianRussianSalvadoranSamoanScandinavianScotch-IrishScottishSeminoleSenegaleseSerbianShoshoneSierra LeoneanSiouxSlavicSlovakSloveneSomaliSouth AfricanSouth AmericanSouth American IndianSoviet UnionSpaniardSpanishSpanish AmericanSpanish American IndianSri LankanSubsaharan AfricanSudaneseSwedishSwissSyrianTaiwaneseThaiTlingit-HaidaTohono O'OdhamTonganTrinidadian and TobagonianTsimshianTurkishU.S. Virgin IslanderUgandanUkrainianUruguayanUteVenezuelanVietnameseWelshWest IndianYakamaYaquiYugoslavianYumanYup'ikZimbabwean
Immigration
NonimmigrantsImmigrantsAfghanistanAfricaAlbaniaArgentinaArmeniaAsiaAustraliaAustriaBahamasBangladeshBarbadosBelarusBelgiumBelizeBoliviaBosnia and HerzegovinaBrazilBulgariaBurma/MyanmarCabo VerdeCambodiaCameroonCanadaCaribbeanCentral AmericaChileChinaColombiaCongoCosta RicaCroatiaCubaCzechoslovakiaDenmarkDominicaDominican RepublicEastern AfricaEastern AsiaEastern EuropeEcuadorEgyptEl SalvadorEnglandEritreaEthiopiaEuropeFijiFranceGermanyGhanaGreeceGrenadaGuatemalaGuyanaHaitiHondurasHong KongHungaryIndiaIndonesiaIranIraqIrelandIsraelItalyJamaicaJapanJordanKazakhstanKenyaKoreaKuwaitLaosLatin AmericaLatviaLebanonLiberiaLithuaniaMalaysiaMexicoMicronesiaMiddle AfricaMoldovaMoroccoNepalNetherlandsNicaraguaNigeriaNorth AmericaNorth MacedoniaNorthern AfricaNorthern EuropeNorwayOceaniaPakistanPanamaPeruPhilippinesPolandPortugalRomaniaRussiaSaudi ArabiaScotlandSenegalSerbiaSierra LeoneSingaporeSomaliaSouth AfricaSouth AmericaSouth Central AsiaSouth Eastern AsiaSouthern EuropeSpainSri LankaSt. Vincent and the GrenadinesSudanSwedenSwitzerlandSyriaTaiwanThailandTrinidad and TobagoTurkeyUgandaUkraineUruguayUzbekistanVenezuelaVietnamWest IndiesWestern AfricaWestern AsiaWestern EuropeYemenZaireZimbabweAzores
Select to Compare
Race
Ancestry
AfghanAfricanAlaska NativeAlaskan AthabascanAlbanianAleutAlsatianAmericanApacheArabArapahoArgentineanArmenianAssyrian/Chaldean/SyriacAustralianAustrianBahamianBangladeshiBarbadianBasqueBelgianBelizeanBermudanBhutaneseBlackfeetBolivianBrazilianBritishBritish West IndianBulgarianBurmeseCajunCambodianCanadianCape VerdeanCarpatho RusynCelticCentral AmericanCentral American IndianCherokeeCheyenneChickasawChileanChineseChippewaChoctawColombianColvilleComancheCosta RicanCreeCreekCroatianCrowCubanCypriotCzechCzechoslovakianDanishDelawareDominicanDutchDutch West IndianEastern EuropeanEcuadorianEgyptianEnglishEstonianEthiopianEuropeanFijianFilipinoFinnishFrenchFrench American IndianFrench CanadianGermanGerman RussianGhanaianGreekGuamanian/ChamorroGuatemalanGuyaneseHaitianHmongHonduranHopiHoumaHungarianIcelanderIndian (Asian)IndonesianInupiatIranianIraqiIrishIroquoisIsraeliItalianJamaicanJapaneseJordanianKenyanKiowaKoreanLaotianLatvianLebaneseLiberianLithuanianLumbeeLuxembourgerMacedonianMalaysianMalteseMarshalleseMenomineeMexicanMexican American IndianMongolianMoroccanNative HawaiianNavajoNepaleseNew ZealanderNicaraguanNigerianNorthern EuropeanNorwegianOkinawanOsageOttawaPaiutePakistaniPalestinianPanamanianParaguayanPennsylvania GermanPeruvianPimaPolishPortuguesePotawatomiPuebloPuerto RicanPuget Sound SalishRomanianRussianSalvadoranSamoanScandinavianScotch-IrishScottishSeminoleSenegaleseSerbianShoshoneSierra LeoneanSiouxSlavicSlovakSloveneSomaliSouth AfricanSouth AmericanSouth American IndianSoviet UnionSpaniardSpanishSpanish AmericanSpanish American IndianSri LankanSubsaharan AfricanSudaneseSwedishSwissSyrianTaiwaneseThaiTlingit-HaidaTohono O'OdhamTonganTrinidadian and TobagonianTsimshianTurkishU.S. Virgin IslanderUgandanUkrainianUruguayanUteVenezuelanVietnameseWelshWest IndianYakamaYaquiYugoslavianYumanYup'ikZimbabwean
Immigration
NonimmigrantsImmigrantsAfghanistanAfricaAlbaniaArgentinaArmeniaAsiaAustraliaAustriaBahamasBangladeshBarbadosBelarusBelgiumBelizeBoliviaBosnia and HerzegovinaBrazilBulgariaCabo VerdeCambodiaCameroonCanadaCaribbeanCentral AmericaChileChinaColombiaCongoCosta RicaCroatiaCubaCzechoslovakiaDenmarkDominicaDominican RepublicEastern AfricaEastern AsiaEastern EuropeEcuadorEgyptEl SalvadorEnglandEritreaEthiopiaEuropeFijiFranceGermanyGhanaGreeceGrenadaGuatemalaGuyanaHaitiHondurasHong KongHungaryIndiaIndonesiaIranIraqIrelandIsraelItalyJamaicaJapanJordanKazakhstanKenyaKoreaKuwaitLaosLatin AmericaLatviaLebanonLiberiaLithuaniaMalaysiaMexicoMicronesiaMiddle AfricaMoldovaMoroccoNepalNetherlandsNicaraguaNigeriaNorth AmericaNorth MacedoniaNorthern AfricaNorthern EuropeNorwayOceaniaPakistanPanamaPeruPhilippinesPolandPortugalRomaniaRussiaSaudi ArabiaScotlandSenegalSerbiaSierra LeoneSingaporeSomaliaSouth AfricaSouth AmericaSouth Central AsiaSouth Eastern AsiaSouthern EuropeSpainSri LankaSt. Vincent and the GrenadinesSudanSwedenSwitzerlandSyriaTaiwanThailandTrinidad and TobagoTurkeyUgandaUkraineUruguayUzbekistanVenezuelaVietnamWest IndiesWestern AfricaWestern AsiaWestern EuropeYemenZaireZimbabweAzores
Single Male Poverty
Income
Poverty
Unemployment
Labor Participation
Family Structure
Vehicle Availability
Education Level
Disability

Immigrants from Burma/Myanmar Single Male Poverty
Poor

13.1%
POVERTY | SINGLE MALES
12.6/ 100
METRIC RATING
219th/ 347
METRIC RANK

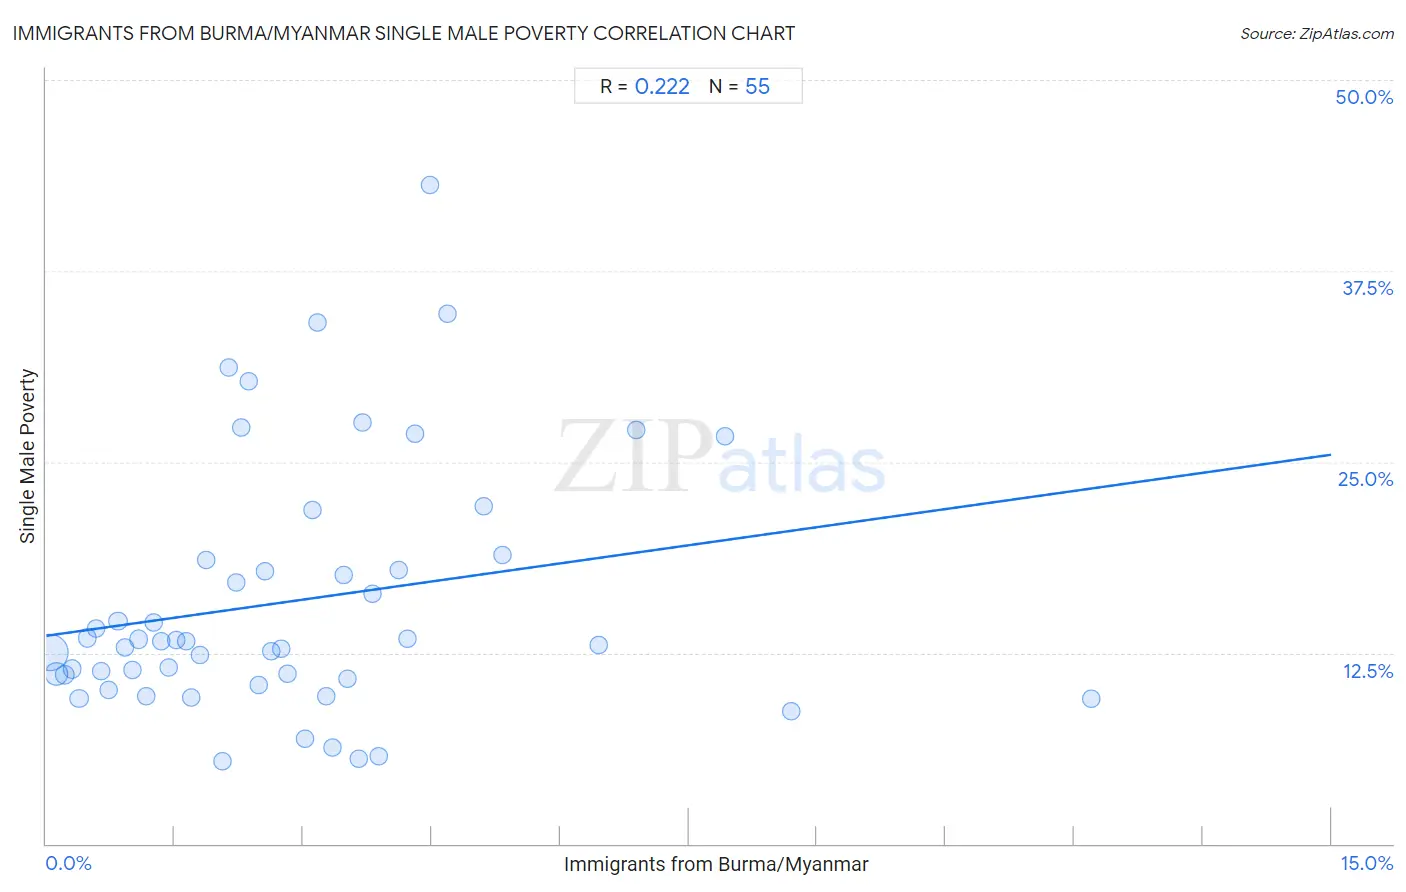
Immigrants from Burma/Myanmar Single Male Poverty Correlation Chart

The statistical analysis conducted on geographies consisting of 162,611,210 people shows a weak positive correlation between the proportion of Immigrants from Burma/Myanmar and poverty level among single males in the United States with a correlation coefficient (R) of 0.222 and weighted average of 13.1%. On average, for every 1% (one percent) increase in Immigrants from Burma/Myanmar within a typical geography, there is an increase of 0.79% in poverty level among single males.
Immigrants from Burma/Myanmar Single Male Poverty
It is essential to understand that the correlation between the percentage of Immigrants from Burma/Myanmar and poverty level among single males does not imply a direct cause-and-effect relationship. It remains uncertain whether the presence of Immigrants from Burma/Myanmar influences an upward or downward trend in the level of poverty level among single males within an area, or if Immigrants from Burma/Myanmar simply ended up residing in those areas with higher or lower levels of poverty level among single males due to other factors.

Demographics Similar to Immigrants from Burma/Myanmar by Single Male Poverty

In terms of single male poverty, the demographic groups most similar to Immigrants from Burma/Myanmar are Scandinavian (13.1%, a difference of 0.030%), Bermudan (13.1%, a difference of 0.050%), Austrian (13.1%, a difference of 0.15%), Central American (13.2%, a difference of 0.22%), and Japanese (13.1%, a difference of 0.24%).
DemographicsRating | RankSingle Male Poverty
Senegalese
16.4
/100
|
#212
Poor
13.1%
Italians
15.9
/100
|
#213
Poor
13.1%
Zimbabweans
14.9
/100
|
#214
Poor
13.1%
Japanese
14.8
/100
|
#215
Poor
13.1%
Austrians
13.9
/100
|
#216
Poor
13.1%
Bermudans
13.0
/100
|
#217
Poor
13.1%
Scandinavians
12.9
/100
|
#218
Poor
13.1%
Immigrants from Burma/Myanmar
12.6
/100
|
#219
Poor
13.1%
Central Americans
10.9
/100
|
#220
Poor
13.2%
New Zealanders
10.7
/100
|
#221
Poor
13.2%
Immigrants from Western Europe
10.0
/100
|
#222
Poor
13.2%
Immigrants from the Azores
9.3
/100
|
#223
Tragic
13.2%
Somalis
9.1
/100
|
#224
Tragic
13.2%
Immigrants from Denmark
8.7
/100
|
#225
Tragic
13.2%
Jamaicans
7.7
/100
|
#226
Tragic
13.2%

Immigrants from Burma/Myanmar Single Male Poverty Correlation Summary

MeasurementImmigrants from Burma/Myanmar DataSingle Male Poverty Data
Minimum0.038%5.4%
Maximum12.2%43.1%
Range12.2%37.7%
Mean2.9%15.9%
Median2.5%13.3%
Interquartile 25% (IQ1)1.2%10.8%
Interquartile 75% (IQ3)3.8%18.5%
Interquartile Range (IQR)2.6%7.8%
Standard Deviation (Sample)2.3%8.3%
Standard Deviation (Population)2.3%8.2%

Correlation Details

Immigrants from Burma/Myanmar PercentileSample SizeSingle Male Poverty
[
0.0%
-
0.5%
]
0.038%
105,268,03812.5%
[
0.0%
-
0.5%
]
0.12%
25,793,12311.1%
[
0.0%
-
0.5%
]
0.22%
9,895,69411.1%
[
0.0%
-
0.5%
]
0.30%
3,874,93611.5%
[
0.0%
-
0.5%
]
0.38%
2,972,9149.5%
[
0.0%
-
0.5%
]
0.48%
2,203,97113.5%
[
0.5%
-
1.0%
]
0.58%
2,332,93714.1%
[
0.5%
-
1.0%
]
0.65%
1,370,64511.3%
[
0.5%
-
1.0%
]
0.73%
1,214,21910.1%
[
0.5%
-
1.0%
]
0.84%
1,085,88714.6%
[
0.5%
-
1.0%
]
0.92%
561,68412.8%
[
1.0%
-
1.5%
]
1.00%
573,75711.3%
[
1.0%
-
1.5%
]
1.08%
1,324,13813.4%
[
1.0%
-
1.5%
]
1.17%
406,0009.7%
[
1.0%
-
1.5%
]
1.26%
395,24914.5%
[
1.0%
-
1.5%
]
1.34%
209,19013.3%
[
1.0%
-
1.5%
]
1.43%
390,53011.6%
[
1.5%
-
2.0%
]
1.52%
270,96213.4%
[
1.5%
-
2.0%
]
1.63%
385,19913.3%
[
1.5%
-
2.0%
]
1.70%
149,5249.6%
[
1.5%
-
2.0%
]
1.79%
141,55412.4%
[
1.5%
-
2.0%
]
1.86%
429,96818.5%
[
2.0%
-
2.5%
]
2.05%
212,9885.4%
[
2.0%
-
2.5%
]
2.13%
35,41931.2%
[
2.0%
-
2.5%
]
2.22%
46,75317.1%
[
2.0%
-
2.5%
]
2.28%
8,80527.3%
[
2.0%
-
2.5%
]
2.37%
9,25230.3%
[
2.0%
-
2.5%
]
2.48%
130,81710.4%
[
2.5%
-
3.0%
]
2.55%
126,25217.9%
[
2.5%
-
3.0%
]
2.63%
48,93912.6%
[
2.5%
-
3.0%
]
2.74%
85,51312.8%
[
2.5%
-
3.0%
]
2.81%
31,67911.2%
[
3.0%
-
3.5%
]
3.03%
24,6846.8%
[
3.0%
-
3.5%
]
3.10%
94,08921.8%
[
3.0%
-
3.5%
]
3.16%
3,16034.1%
[
3.0%
-
3.5%
]
3.27%
33,9129.7%
[
3.0%
-
3.5%
]
3.34%
15,5566.3%
[
3.0%
-
3.5%
]
3.47%
58,57417.6%
[
3.5%
-
4.0%
]
3.52%
6,07410.8%
[
3.5%
-
4.0%
]
3.65%
3,1265.6%
[
3.5%
-
4.0%
]
3.70%
23,98027.6%
[
3.5%
-
4.0%
]
3.81%
57,66216.4%
[
3.5%
-
4.0%
]
3.88%
15,8995.7%
[
4.0%
-
4.5%
]
4.12%
25,69918.0%
[
4.0%
-
4.5%
]
4.21%
23,87913.4%
[
4.0%
-
4.5%
]
4.31%
81,01526.8%
[
4.0%
-
4.5%
]
4.48%
2,02943.1%
[
4.5%
-
5.0%
]
4.69%
14,55334.7%
[
5.0%
-
5.5%
]
5.11%
5,26822.1%
[
5.0%
-
5.5%
]
5.33%
37,83418.9%
[
6.0%
-
6.5%
]
6.45%
19,50113.1%
[
6.5%
-
7.0%
]
6.88%
19,61327.1%
[
7.5%
-
8.0%
]
7.92%
56,79426.7%
[
8.5%
-
9.0%
]
8.70%
1,0358.7%
[
12.0%
-
12.5%
]
12.20%
7389.5%