Immigrants from Burma/Myanmar Receiving Food Stamps
COMPARE
Immigrants from Burma/Myanmar
Select to Compare
Receiving Food Stamps
Immigrants from Burma/Myanmar Receiving Food Stamps
12.9%
PUBLIC INCOME | FOOD STAMPS
6.0/ 100
METRIC RATING
217th/ 347
METRIC RANK
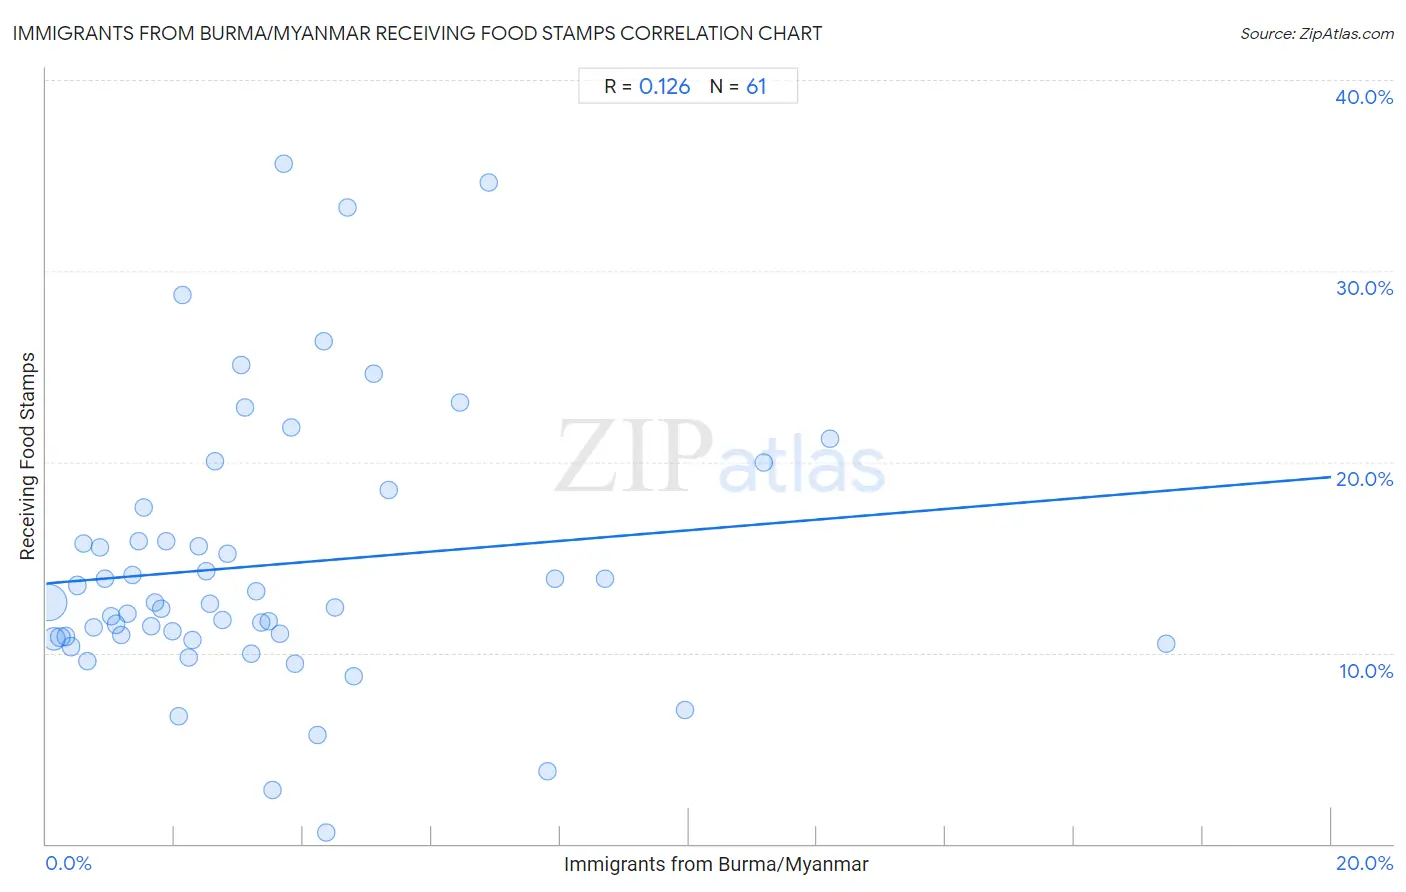
Immigrants from Burma/Myanmar Receiving Food Stamps Correlation Chart
The statistical analysis conducted on geographies consisting of 172,104,421 people shows a poor positive correlation between the proportion of Immigrants from Burma/Myanmar and percentage of population receiving government assistance and/or food stamps in the United States with a correlation coefficient (R) of 0.126 and weighted average of 12.9%. On average, for every 1% (one percent) increase in Immigrants from Burma/Myanmar within a typical geography, there is an increase of 0.28% in percentage of population receiving government assistance and/or food stamps.
It is essential to understand that the correlation between the percentage of Immigrants from Burma/Myanmar and percentage of population receiving government assistance and/or food stamps does not imply a direct cause-and-effect relationship. It remains uncertain whether the presence of Immigrants from Burma/Myanmar influences an upward or downward trend in the level of percentage of population receiving government assistance and/or food stamps within an area, or if Immigrants from Burma/Myanmar simply ended up residing in those areas with higher or lower levels of percentage of population receiving government assistance and/or food stamps due to other factors.
Demographics Similar to Immigrants from Burma/Myanmar by Receiving Food Stamps
In terms of receiving food stamps, the demographic groups most similar to Immigrants from Burma/Myanmar are Immigrants from South America (12.8%, a difference of 0.26%), Native Hawaiian (12.8%, a difference of 0.36%), Hawaiian (12.9%, a difference of 0.37%), Immigrants from Middle Africa (12.9%, a difference of 0.38%), and Immigrants from Colombia (12.9%, a difference of 0.41%).
| Demographics | Rating | Rank | Receiving Food Stamps |
| Immigrants from Uruguay | 12.8 /100 | #210 | Poor 12.5% |
| Colombians | 10.2 /100 | #211 | Poor 12.6% |
| Malaysians | 8.5 /100 | #212 | Tragic 12.7% |
| Moroccans | 7.6 /100 | #213 | Tragic 12.8% |
| Immigrants from Africa | 7.6 /100 | #214 | Tragic 12.8% |
| Native Hawaiians | 6.7 /100 | #215 | Tragic 12.8% |
| Immigrants from South America | 6.5 /100 | #216 | Tragic 12.8% |
| Immigrants from Burma/Myanmar | 6.0 /100 | #217 | Tragic 12.9% |
| Hawaiians | 5.4 /100 | #218 | Tragic 12.9% |
| Immigrants from Middle Africa | 5.4 /100 | #219 | Tragic 12.9% |
| Immigrants from Colombia | 5.3 /100 | #220 | Tragic 12.9% |
| Bermudans | 4.8 /100 | #221 | Tragic 13.0% |
| Immigrants | 4.4 /100 | #222 | Tragic 13.0% |
| Immigrants from Albania | 4.4 /100 | #223 | Tragic 13.0% |
| Immigrants from Armenia | 4.3 /100 | #224 | Tragic 13.0% |
Immigrants from Burma/Myanmar Receiving Food Stamps Correlation Summary
| Measurement | Immigrants from Burma/Myanmar Data | Receiving Food Stamps Data |
| Minimum | 0.038% | 0.60% |
| Maximum | 17.4% | 35.6% |
| Range | 17.4% | 35.0% |
| Mean | 3.5% | 14.6% |
| Median | 2.6% | 12.5% |
| Interquartile 25% (IQ1) | 1.3% | 10.8% |
| Interquartile 75% (IQ3) | 4.3% | 16.7% |
| Interquartile Range (IQR) | 3.0% | 6.0% |
| Standard Deviation (Sample) | 3.2% | 7.2% |
| Standard Deviation (Population) | 3.2% | 7.1% |
Correlation Details
| Immigrants from Burma/Myanmar Percentile | Sample Size | Receiving Food Stamps |
[ 0.0% - 0.5% ] 0.038% | 109,773,763 | 12.6% |
[ 0.0% - 0.5% ] 0.12% | 27,989,682 | 10.7% |
[ 0.0% - 0.5% ] 0.22% | 10,612,965 | 10.8% |
[ 0.0% - 0.5% ] 0.30% | 4,409,713 | 10.9% |
[ 0.0% - 0.5% ] 0.38% | 3,387,285 | 10.3% |
[ 0.0% - 0.5% ] 0.48% | 2,372,987 | 13.5% |
[ 0.5% - 1.0% ] 0.58% | 2,459,066 | 15.7% |
[ 0.5% - 1.0% ] 0.65% | 1,513,851 | 9.6% |
[ 0.5% - 1.0% ] 0.73% | 1,356,368 | 11.3% |
[ 0.5% - 1.0% ] 0.84% | 1,121,864 | 15.5% |
[ 0.5% - 1.0% ] 0.92% | 635,789 | 13.9% |
[ 1.0% - 1.5% ] 1.00% | 592,676 | 11.9% |
[ 1.0% - 1.5% ] 1.08% | 1,357,298 | 11.5% |
[ 1.0% - 1.5% ] 1.17% | 419,756 | 11.0% |
[ 1.0% - 1.5% ] 1.26% | 438,016 | 12.0% |
[ 1.0% - 1.5% ] 1.34% | 223,860 | 14.1% |
[ 1.0% - 1.5% ] 1.43% | 406,089 | 15.9% |
[ 1.5% - 2.0% ] 1.51% | 310,391 | 17.6% |
[ 1.5% - 2.0% ] 1.63% | 392,187 | 11.4% |
[ 1.5% - 2.0% ] 1.69% | 182,155 | 12.7% |
[ 1.5% - 2.0% ] 1.79% | 185,148 | 12.3% |
[ 1.5% - 2.0% ] 1.86% | 432,147 | 15.8% |
[ 1.5% - 2.0% ] 1.97% | 19,626 | 11.2% |
[ 2.0% - 2.5% ] 2.06% | 256,522 | 6.7% |
[ 2.0% - 2.5% ] 2.13% | 35,419 | 28.7% |
[ 2.0% - 2.5% ] 2.22% | 55,094 | 9.7% |
[ 2.0% - 2.5% ] 2.29% | 12,778 | 10.7% |
[ 2.0% - 2.5% ] 2.37% | 51,767 | 15.6% |
[ 2.0% - 2.5% ] 2.48% | 133,569 | 14.2% |
[ 2.5% - 3.0% ] 2.55% | 126,252 | 12.5% |
[ 2.5% - 3.0% ] 2.63% | 48,939 | 20.0% |
[ 2.5% - 3.0% ] 2.74% | 85,513 | 11.7% |
[ 2.5% - 3.0% ] 2.81% | 34,537 | 15.2% |
[ 3.0% - 3.5% ] 3.03% | 24,684 | 25.1% |
[ 3.0% - 3.5% ] 3.10% | 94,089 | 22.9% |
[ 3.0% - 3.5% ] 3.19% | 24,971 | 9.9% |
[ 3.0% - 3.5% ] 3.27% | 33,912 | 13.2% |
[ 3.0% - 3.5% ] 3.34% | 15,556 | 11.6% |
[ 3.0% - 3.5% ] 3.47% | 58,574 | 11.6% |
[ 3.5% - 4.0% ] 3.53% | 10,424 | 2.8% |
[ 3.5% - 4.0% ] 3.65% | 3,126 | 11.0% |
[ 3.5% - 4.0% ] 3.70% | 23,980 | 35.6% |
[ 3.5% - 4.0% ] 3.81% | 57,662 | 21.8% |
[ 3.5% - 4.0% ] 3.88% | 15,899 | 9.4% |
[ 4.0% - 4.5% ] 4.21% | 23,879 | 5.7% |
[ 4.0% - 4.5% ] 4.31% | 81,015 | 26.3% |
[ 4.0% - 4.5% ] 4.36% | 2,039 | 0.60% |
[ 4.0% - 4.5% ] 4.48% | 2,029 | 12.4% |
[ 4.5% - 5.0% ] 4.69% | 14,553 | 33.3% |
[ 4.5% - 5.0% ] 4.78% | 2,219 | 8.8% |
[ 5.0% - 5.5% ] 5.11% | 5,268 | 24.6% |
[ 5.0% - 5.5% ] 5.33% | 37,834 | 18.5% |
[ 6.0% - 6.5% ] 6.45% | 19,501 | 23.1% |
[ 6.5% - 7.0% ] 6.88% | 19,613 | 34.6% |
[ 7.5% - 8.0% ] 7.81% | 39,082 | 3.8% |
[ 7.5% - 8.0% ] 7.92% | 56,794 | 13.9% |
[ 8.5% - 9.0% ] 8.70% | 1,035 | 13.9% |
[ 9.5% - 10.0% ] 9.95% | 382 | 7.0% |
[ 11.0% - 11.5% ] 11.17% | 403 | 20.0% |
[ 12.0% - 12.5% ] 12.20% | 738 | 21.2% |
[ 17.0% - 17.5% ] 17.43% | 2,088 | 10.5% |