Buffalo, TX Map & Demographics
Buffalo Map
Buffalo Overview
$32,085
PER CAPITA INCOME
$72,232
AVG FAMILY INCOME
$57,813
AVG HOUSEHOLD INCOME
48.0%
WAGE / INCOME GAP [ % ]
52.0¢/ $1
WAGE / INCOME GAP [ $ ]
0.48
INEQUALITY / GINI INDEX
1,838
TOTAL POPULATION
846
MALE POPULATION
992
FEMALE POPULATION
85.28
MALES / 100 FEMALES
117.26
FEMALES / 100 MALES
36.4
MEDIAN AGE
3.1
AVG FAMILY SIZE
2.4
AVG HOUSEHOLD SIZE
809
LABOR FORCE [ PEOPLE ]
56.7%
PERCENT IN LABOR FORCE
10.9%
UNEMPLOYMENT RATE
Buffalo Zip Codes
Buffalo Area Codes
Income in Buffalo
Income Overview in Buffalo
Per Capita Income in Buffalo is $32,085, while median incomes of families and households are $72,232 and $57,813 respectively.
| Characteristic | Number | Measure |
| Per Capita Income | 1,838 | $32,085 |
| Median Family Income | 486 | $72,232 |
| Mean Family Income | 486 | $91,413 |
| Median Household Income | 755 | $57,813 |
| Mean Household Income | 755 | $79,507 |
| Income Deficit | 486 | $0 |
| Wage / Income Gap (%) | 1,838 | 47.97% |
| Wage / Income Gap ($) | 1,838 | 52.03¢ per $1 |
| Gini / Inequality Index | 1,838 | 0.48 |
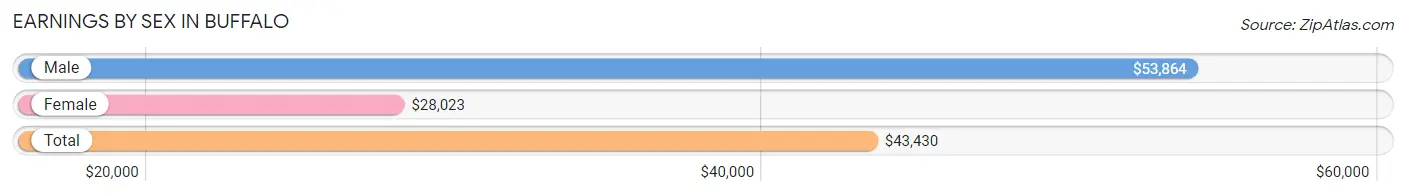
Earnings by Sex in Buffalo
Average Earnings in Buffalo are $43,430, $53,864 for men and $28,023 for women, a difference of 48.0%.
| Sex | Number | Average Earnings |
| Male | 492 (58.9%) | $53,864 |
| Female | 344 (41.1%) | $28,023 |
| Total | 836 (100.0%) | $43,430 |
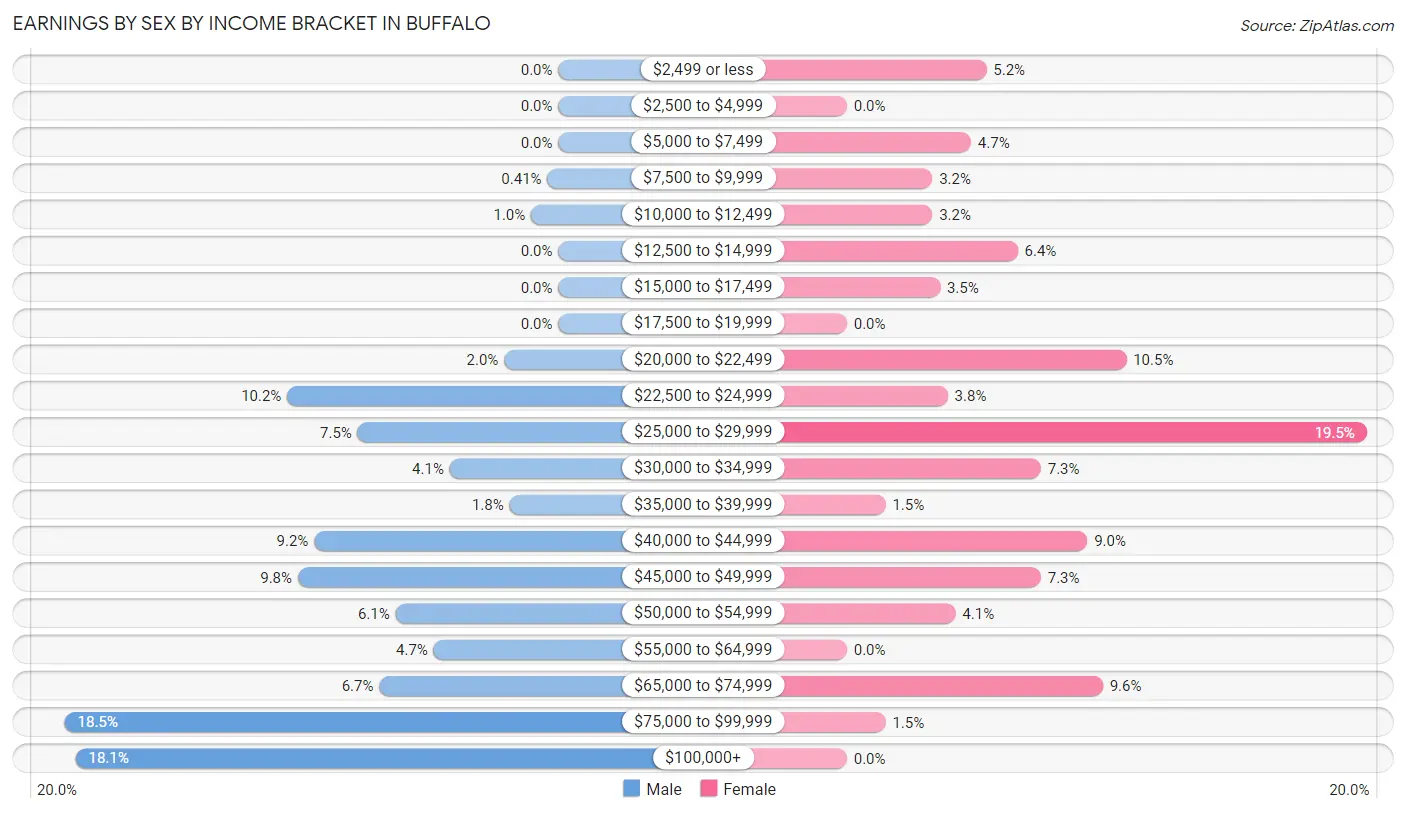
Earnings by Sex by Income Bracket in Buffalo
The most common earnings brackets in Buffalo are $75,000 to $99,999 for men (91 | 18.5%) and $25,000 to $29,999 for women (67 | 19.5%).
| Income | Male | Female |
| $2,499 or less | 0 (0.0%) | 18 (5.2%) |
| $2,500 to $4,999 | 0 (0.0%) | 0 (0.0%) |
| $5,000 to $7,499 | 0 (0.0%) | 16 (4.6%) |
| $7,500 to $9,999 | 2 (0.4%) | 11 (3.2%) |
| $10,000 to $12,499 | 5 (1.0%) | 11 (3.2%) |
| $12,500 to $14,999 | 0 (0.0%) | 22 (6.4%) |
| $15,000 to $17,499 | 0 (0.0%) | 12 (3.5%) |
| $17,500 to $19,999 | 0 (0.0%) | 0 (0.0%) |
| $20,000 to $22,499 | 10 (2.0%) | 36 (10.5%) |
| $22,500 to $24,999 | 50 (10.2%) | 13 (3.8%) |
| $25,000 to $29,999 | 37 (7.5%) | 67 (19.5%) |
| $30,000 to $34,999 | 20 (4.1%) | 25 (7.3%) |
| $35,000 to $39,999 | 9 (1.8%) | 5 (1.5%) |
| $40,000 to $44,999 | 45 (9.1%) | 31 (9.0%) |
| $45,000 to $49,999 | 48 (9.8%) | 25 (7.3%) |
| $50,000 to $54,999 | 30 (6.1%) | 14 (4.1%) |
| $55,000 to $64,999 | 23 (4.7%) | 0 (0.0%) |
| $65,000 to $74,999 | 33 (6.7%) | 33 (9.6%) |
| $75,000 to $99,999 | 91 (18.5%) | 5 (1.5%) |
| $100,000+ | 89 (18.1%) | 0 (0.0%) |
| Total | 492 (100.0%) | 344 (100.0%) |
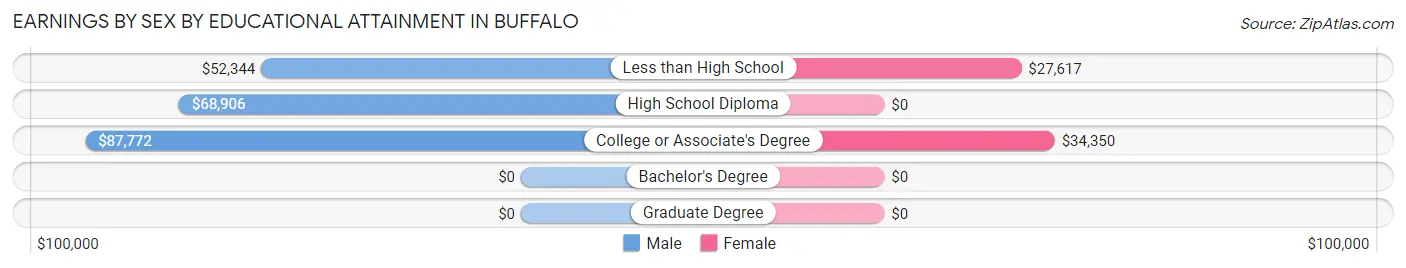
Earnings by Sex by Educational Attainment in Buffalo
Average earnings in Buffalo are $69,219 for men and $28,477 for women, a difference of 58.9%. Men with an educational attainment of college or associate's degree enjoy the highest average annual earnings of $87,772, while those with less than high school education earn the least with $52,344. Women with an educational attainment of college or associate's degree earn the most with the average annual earnings of $34,350, while those with less than high school education have the smallest earnings of $27,617.
| Educational Attainment | Male Income | Female Income |
| Less than High School | $52,344 | $27,617 |
| High School Diploma | $68,906 | $0 |
| College or Associate's Degree | $87,772 | $34,350 |
| Bachelor's Degree | - | - |
| Graduate Degree | - | - |
| Total | $69,219 | $28,477 |
Family Income in Buffalo
Family Income Brackets in Buffalo
According to the Buffalo family income data, there are 121 families falling into the $100,000 to $149,999 income range, which is the most common income bracket and makes up 24.9% of all families. Conversely, the $10,000 to $14,999 income bracket is the least frequent group with only 5 families (1.0%) belonging to this category.
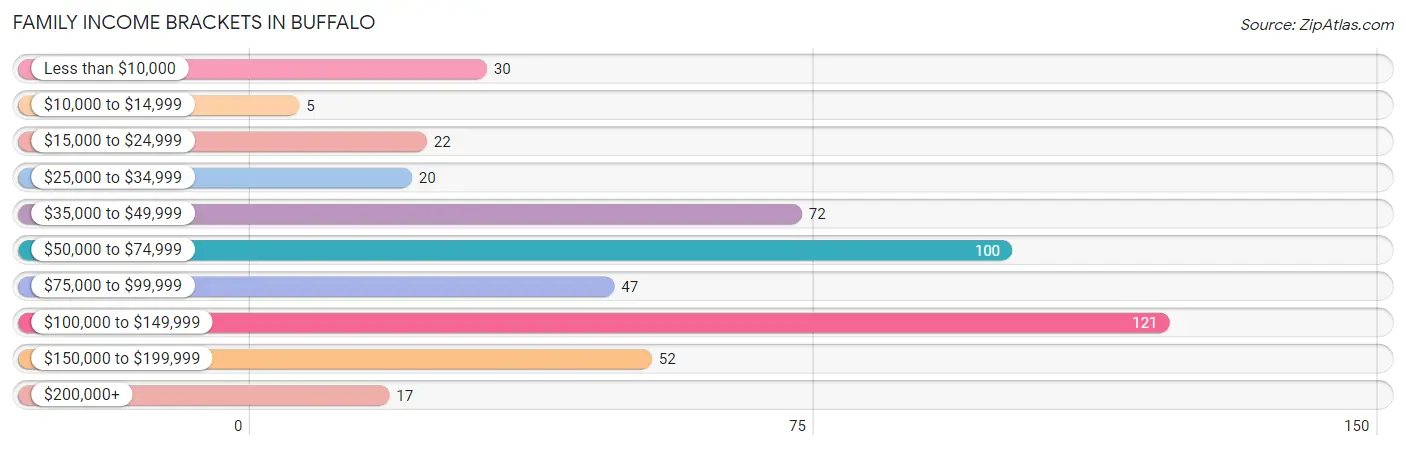
| Income Bracket | # Families | % Families |
| Less than $10,000 | 30 | 6.2% |
| $10,000 to $14,999 | 5 | 1.0% |
| $15,000 to $24,999 | 22 | 4.5% |
| $25,000 to $34,999 | 20 | 4.1% |
| $35,000 to $49,999 | 72 | 14.8% |
| $50,000 to $74,999 | 100 | 20.6% |
| $75,000 to $99,999 | 47 | 9.7% |
| $100,000 to $149,999 | 121 | 24.9% |
| $150,000 to $199,999 | 52 | 10.7% |
| $200,000+ | 17 | 3.5% |
Family Income by Famaliy Size in Buffalo
3-person families (90 | 18.5%) account for the highest median family income in Buffalo with $130,500 per family, while 3-person families (90 | 18.5%) have the highest median income of $43,500 per family member.
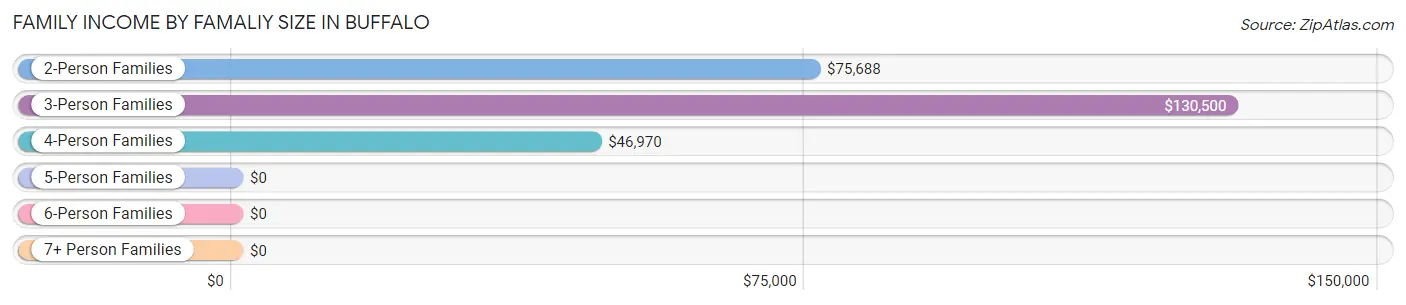
| Income Bracket | # Families | Median Income |
| 2-Person Families | 245 (50.4%) | $75,688 |
| 3-Person Families | 90 (18.5%) | $130,500 |
| 4-Person Families | 68 (14.0%) | $46,970 |
| 5-Person Families | 59 (12.1%) | $0 |
| 6-Person Families | 10 (2.1%) | $0 |
| 7+ Person Families | 14 (2.9%) | $0 |
| Total | 486 (100.0%) | $72,232 |
Family Income by Number of Earners in Buffalo
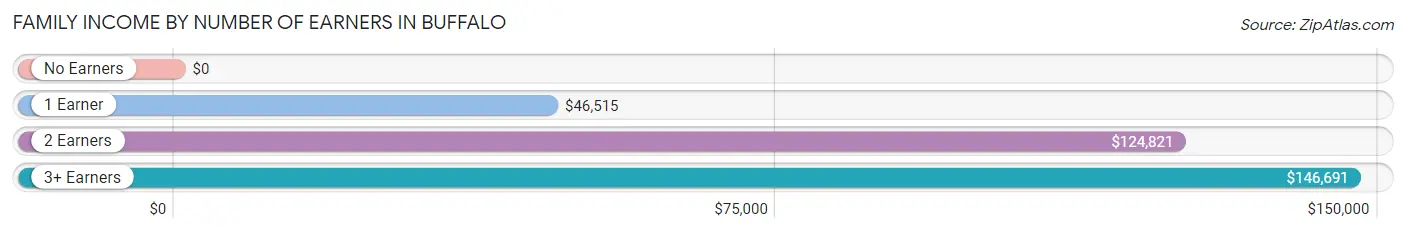
| Number of Earners | # Families | Median Income |
| No Earners | 75 (15.4%) | $0 |
| 1 Earner | 172 (35.4%) | $46,515 |
| 2 Earners | 216 (44.4%) | $124,821 |
| 3+ Earners | 23 (4.7%) | $146,691 |
| Total | 486 (100.0%) | $72,232 |
Household Income in Buffalo
Household Income Brackets in Buffalo
With 129 households falling in the category, the $35,000 to $49,999 income range is the most frequent in Buffalo, accounting for 17.1% of all households. In contrast, only 22 households (2.9%) fall into the $200,000+ income bracket, making it the least populous group.
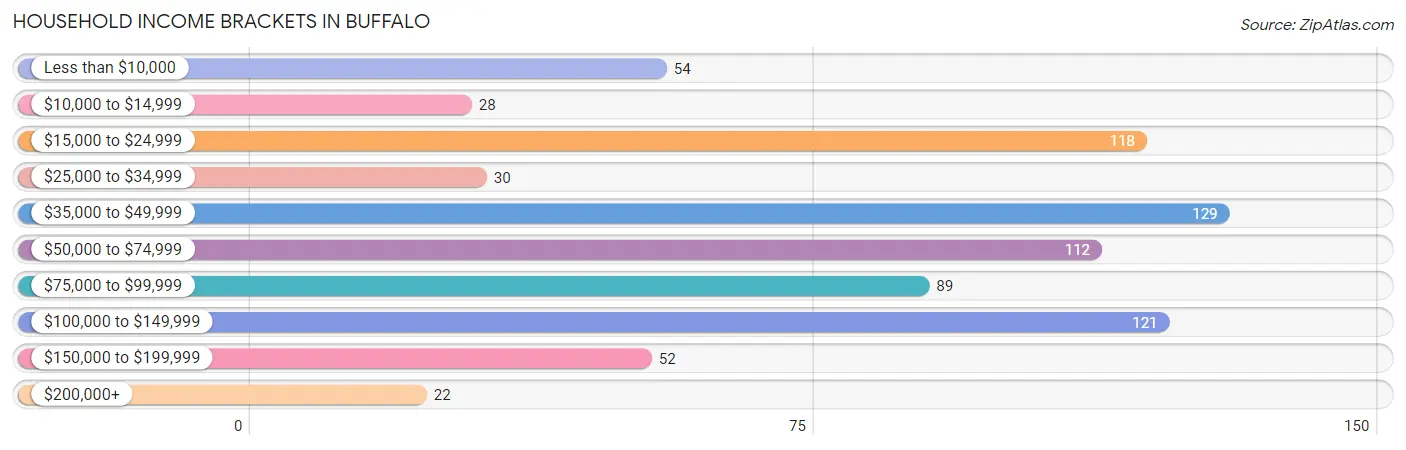
| Income Bracket | # Households | % Households |
| Less than $10,000 | 54 | 7.2% |
| $10,000 to $14,999 | 28 | 3.7% |
| $15,000 to $24,999 | 118 | 15.6% |
| $25,000 to $34,999 | 30 | 4.0% |
| $35,000 to $49,999 | 129 | 17.1% |
| $50,000 to $74,999 | 112 | 14.8% |
| $75,000 to $99,999 | 89 | 11.8% |
| $100,000 to $149,999 | 121 | 16.0% |
| $150,000 to $199,999 | 52 | 6.9% |
| $200,000+ | 22 | 2.9% |
Household Income by Householder Age in Buffalo
The median household income in Buffalo is $57,813, with the highest median household income of $81,196 found in the 45 to 64 years age bracket for the primary householder. A total of 212 households (28.1%) fall into this category. Meanwhile, the 65+ years age bracket for the primary householder has the lowest median household income of $24,834, with 229 households (30.3%) in this group.
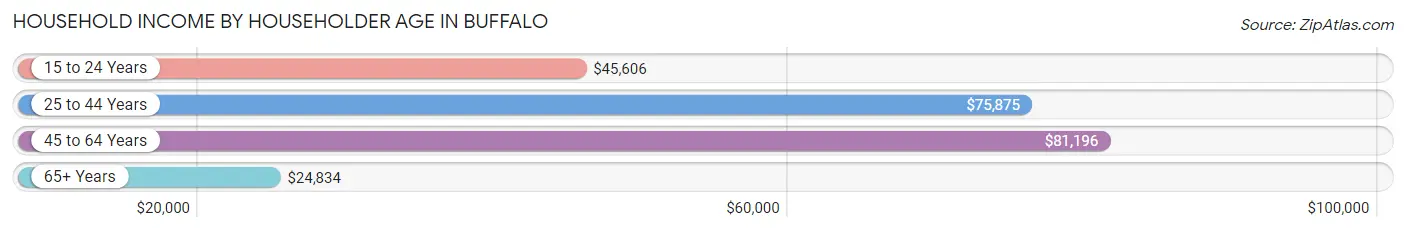
| Income Bracket | # Households | Median Income |
| 15 to 24 Years | 66 (8.7%) | $45,606 |
| 25 to 44 Years | 248 (32.9%) | $75,875 |
| 45 to 64 Years | 212 (28.1%) | $81,196 |
| 65+ Years | 229 (30.3%) | $24,834 |
| Total | 755 (100.0%) | $57,813 |
Poverty in Buffalo
Income Below Poverty by Sex and Age in Buffalo
With 13.4% poverty level for males and 16.9% for females among the residents of Buffalo, 16 and 17 year old males and 16 and 17 year old females are the most vulnerable to poverty, with 5 males (50.0%) and 21 females (55.3%) in their respective age groups living below the poverty level.
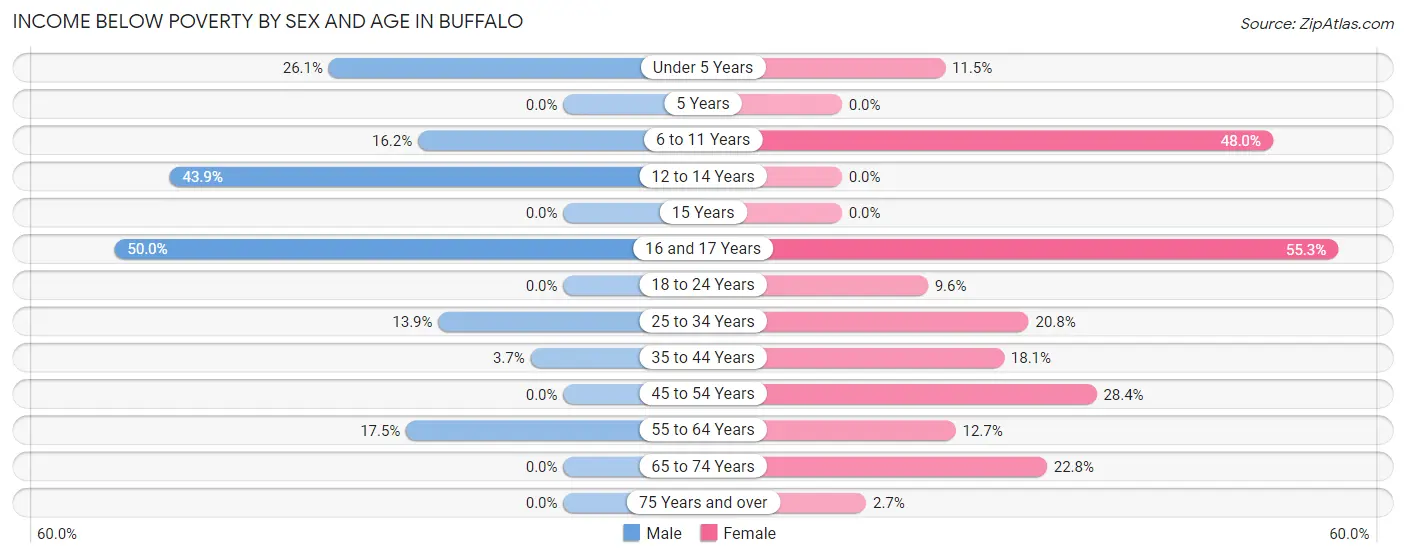
| Age Bracket | Male | Female |
| Under 5 Years | 35 (26.1%) | 10 (11.5%) |
| 5 Years | 0 (0.0%) | 0 (0.0%) |
| 6 to 11 Years | 11 (16.2%) | 12 (48.0%) |
| 12 to 14 Years | 25 (43.9%) | 0 (0.0%) |
| 15 Years | 0 (0.0%) | 0 (0.0%) |
| 16 and 17 Years | 5 (50.0%) | 21 (55.3%) |
| 18 to 24 Years | 0 (0.0%) | 11 (9.6%) |
| 25 to 34 Years | 11 (13.9%) | 26 (20.8%) |
| 35 to 44 Years | 5 (3.6%) | 24 (18.0%) |
| 45 to 54 Years | 0 (0.0%) | 19 (28.4%) |
| 55 to 64 Years | 21 (17.5%) | 19 (12.7%) |
| 65 to 74 Years | 0 (0.0%) | 21 (22.8%) |
| 75 Years and over | 0 (0.0%) | 3 (2.7%) |
| Total | 113 (13.4%) | 166 (16.9%) |
Income Above Poverty by Sex and Age in Buffalo
According to the poverty statistics in Buffalo, males aged 18 to 24 years and females aged 5 years are the age groups that are most secure financially, with 100.0% of males and 100.0% of females in these age groups living above the poverty line.
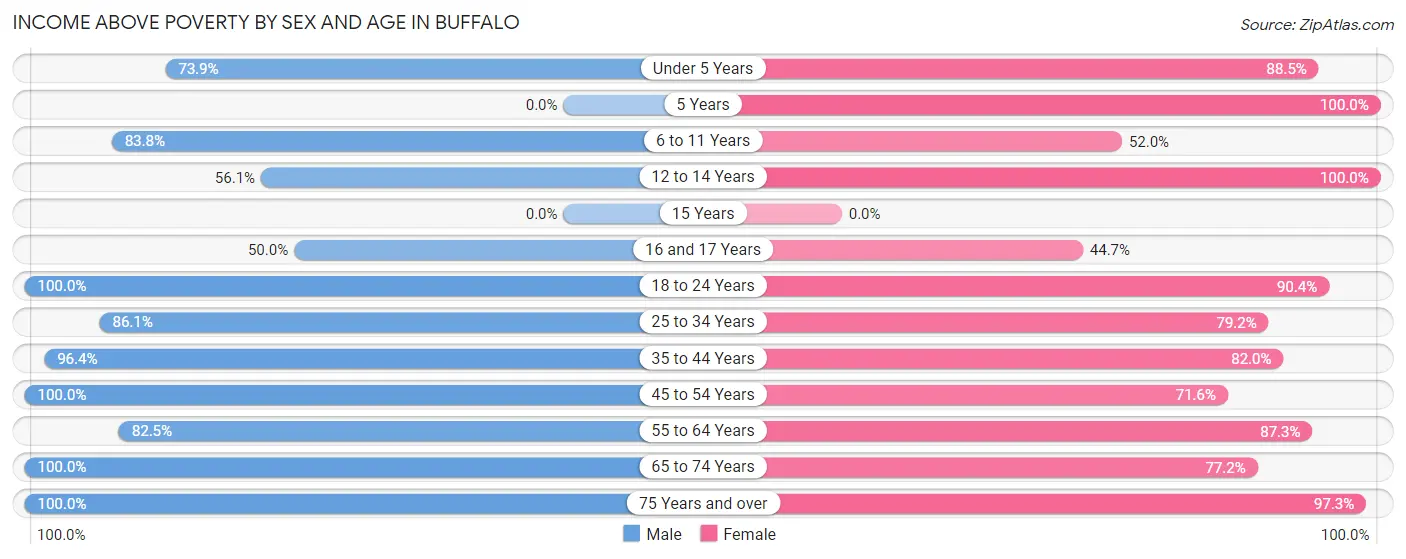
| Age Bracket | Male | Female |
| Under 5 Years | 99 (73.9%) | 77 (88.5%) |
| 5 Years | 0 (0.0%) | 3 (100.0%) |
| 6 to 11 Years | 57 (83.8%) | 13 (52.0%) |
| 12 to 14 Years | 32 (56.1%) | 38 (100.0%) |
| 15 Years | 0 (0.0%) | 0 (0.0%) |
| 16 and 17 Years | 5 (50.0%) | 17 (44.7%) |
| 18 to 24 Years | 108 (100.0%) | 104 (90.4%) |
| 25 to 34 Years | 68 (86.1%) | 99 (79.2%) |
| 35 to 44 Years | 132 (96.4%) | 109 (82.0%) |
| 45 to 54 Years | 70 (100.0%) | 48 (71.6%) |
| 55 to 64 Years | 99 (82.5%) | 131 (87.3%) |
| 65 to 74 Years | 43 (100.0%) | 71 (77.2%) |
| 75 Years and over | 20 (100.0%) | 108 (97.3%) |
| Total | 733 (86.6%) | 818 (83.1%) |
Income Below Poverty Among Married-Couple Families in Buffalo
The poverty statistics for married-couple families in Buffalo show that 3.2% or 12 of the total 377 families live below the poverty line. Families with 1 or 2 children have the highest poverty rate of 5.0%, comprising of 6 families. On the other hand, families with 3 or 4 children have the lowest poverty rate of 0.0%, which includes 0 families.
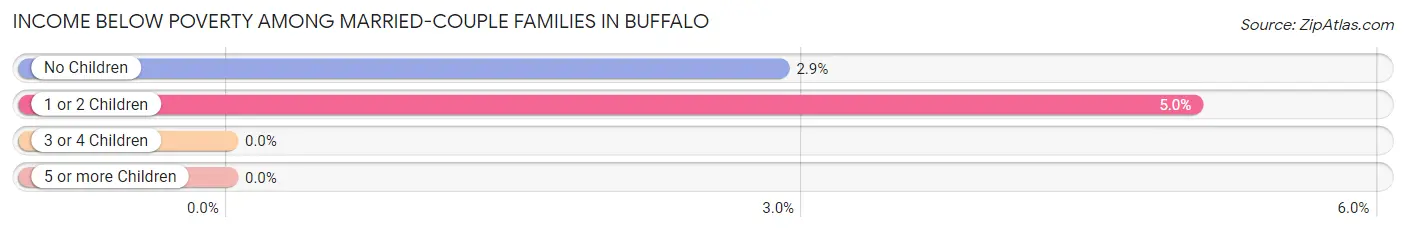
| Children | Above Poverty | Below Poverty |
| No Children | 202 (97.1%) | 6 (2.9%) |
| 1 or 2 Children | 113 (95.0%) | 6 (5.0%) |
| 3 or 4 Children | 36 (100.0%) | 0 (0.0%) |
| 5 or more Children | 14 (100.0%) | 0 (0.0%) |
| Total | 365 (96.8%) | 12 (3.2%) |
Income Below Poverty Among Single-Parent Households in Buffalo
According to the poverty data in Buffalo, 20.8% or 5 single-father households and 31.8% or 27 single-mother households are living below the poverty line. Among single-father households, those with 1 or 2 children have the highest poverty rate, with 5 households (100.0%) experiencing poverty. Likewise, among single-mother households, those with 3 or 4 children have the highest poverty rate, with 18 households (100.0%) falling below the poverty line.
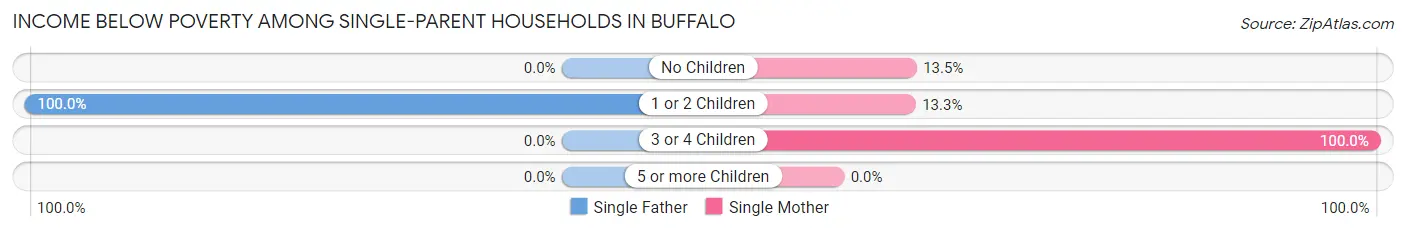
| Children | Single Father | Single Mother |
| No Children | 0 (0.0%) | 5 (13.5%) |
| 1 or 2 Children | 5 (100.0%) | 4 (13.3%) |
| 3 or 4 Children | 0 (0.0%) | 18 (100.0%) |
| 5 or more Children | 0 (0.0%) | 0 (0.0%) |
| Total | 5 (20.8%) | 27 (31.8%) |
Income Below Poverty Among Married-Couple vs Single-Parent Households in Buffalo
The poverty data for Buffalo shows that 12 of the married-couple family households (3.2%) and 32 of the single-parent households (29.4%) are living below the poverty level. Within the married-couple family households, those with 1 or 2 children have the highest poverty rate, with 6 households (5.0%) falling below the poverty line. Among the single-parent households, those with 3 or 4 children have the highest poverty rate, with 18 household (100.0%) living below poverty.
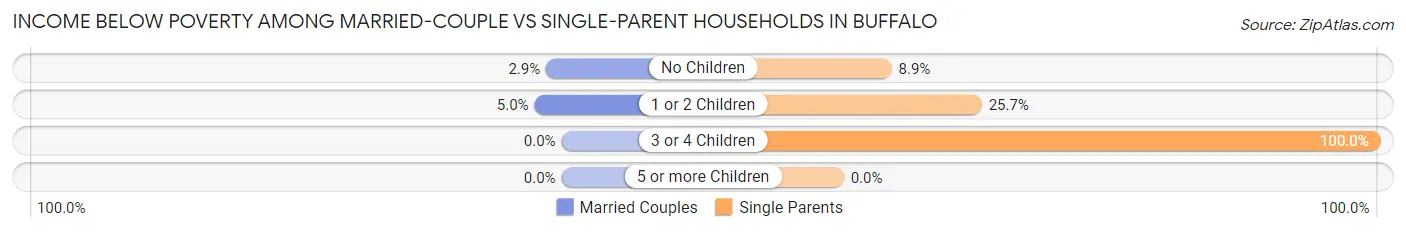
| Children | Married-Couple Families | Single-Parent Households |
| No Children | 6 (2.9%) | 5 (8.9%) |
| 1 or 2 Children | 6 (5.0%) | 9 (25.7%) |
| 3 or 4 Children | 0 (0.0%) | 18 (100.0%) |
| 5 or more Children | 0 (0.0%) | 0 (0.0%) |
| Total | 12 (3.2%) | 32 (29.4%) |
Race in Buffalo
The most populous races in Buffalo are White / Caucasian (1,415 | 77.0%), Hispanic or Latino (364 | 19.8%), and Black / African American (184 | 10.0%).
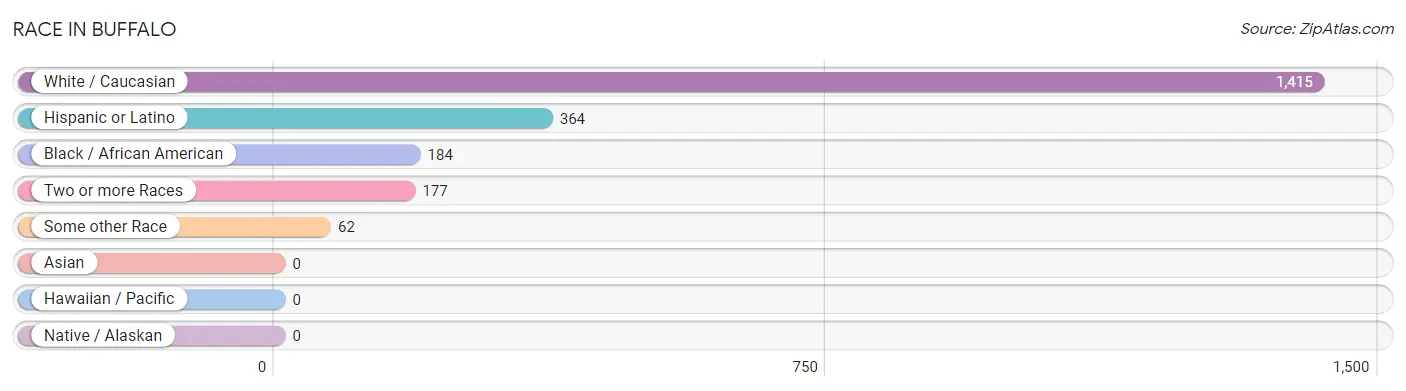
| Race | # Population | % Population |
| Asian | 0 | 0.0% |
| Black / African American | 184 | 10.0% |
| Hawaiian / Pacific | 0 | 0.0% |
| Hispanic or Latino | 364 | 19.8% |
| Native / Alaskan | 0 | 0.0% |
| White / Caucasian | 1,415 | 77.0% |
| Two or more Races | 177 | 9.6% |
| Some other Race | 62 | 3.4% |
| Total | 1,838 | 100.0% |
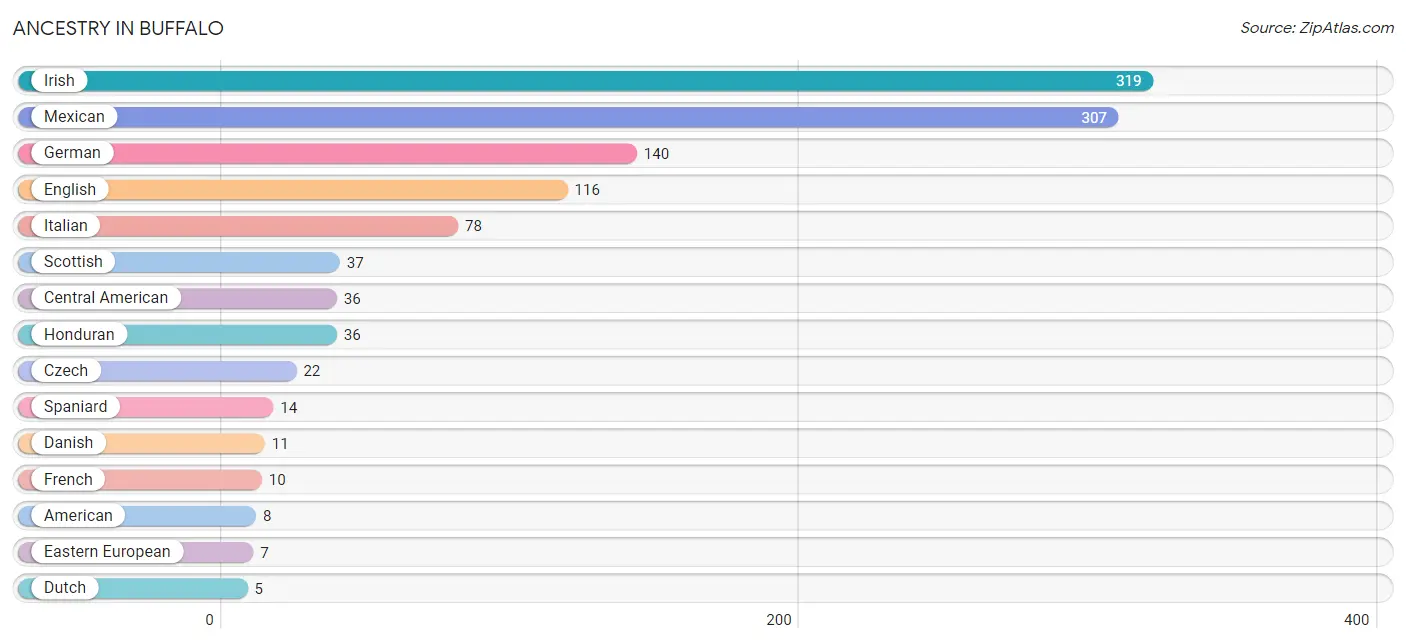
Ancestry in Buffalo
The most populous ancestries reported in Buffalo are Irish (319 | 17.4%), Mexican (307 | 16.7%), German (140 | 7.6%), English (116 | 6.3%), and Italian (78 | 4.2%), together accounting for 52.2% of all Buffalo residents.
| Ancestry | # Population | % Population |
| American | 8 | 0.4% |
| British | 4 | 0.2% |
| Central American | 36 | 2.0% |
| Cherokee | 1 | 0.1% |
| Czech | 22 | 1.2% |
| Danish | 11 | 0.6% |
| Dutch | 5 | 0.3% |
| Eastern European | 7 | 0.4% |
| English | 116 | 6.3% |
| European | 1 | 0.1% |
| French | 10 | 0.5% |
| German | 140 | 7.6% |
| Honduran | 36 | 2.0% |
| Irish | 319 | 17.4% |
| Italian | 78 | 4.2% |
| Mexican | 307 | 16.7% |
| Puerto Rican | 4 | 0.2% |
| Scotch-Irish | 5 | 0.3% |
| Scottish | 37 | 2.0% |
| South American | 3 | 0.2% |
| Spaniard | 14 | 0.8% |
| Uruguayan | 3 | 0.2% | View All 22 Rows |
Immigrants in Buffalo
The most numerous immigrant groups reported in Buffalo came from Latin America (137 | 7.4%), Central America (122 | 6.6%), Mexico (86 | 4.7%), Honduras (36 | 2.0%), and Europe (13 | 0.7%), together accounting for 21.4% of all Buffalo residents.
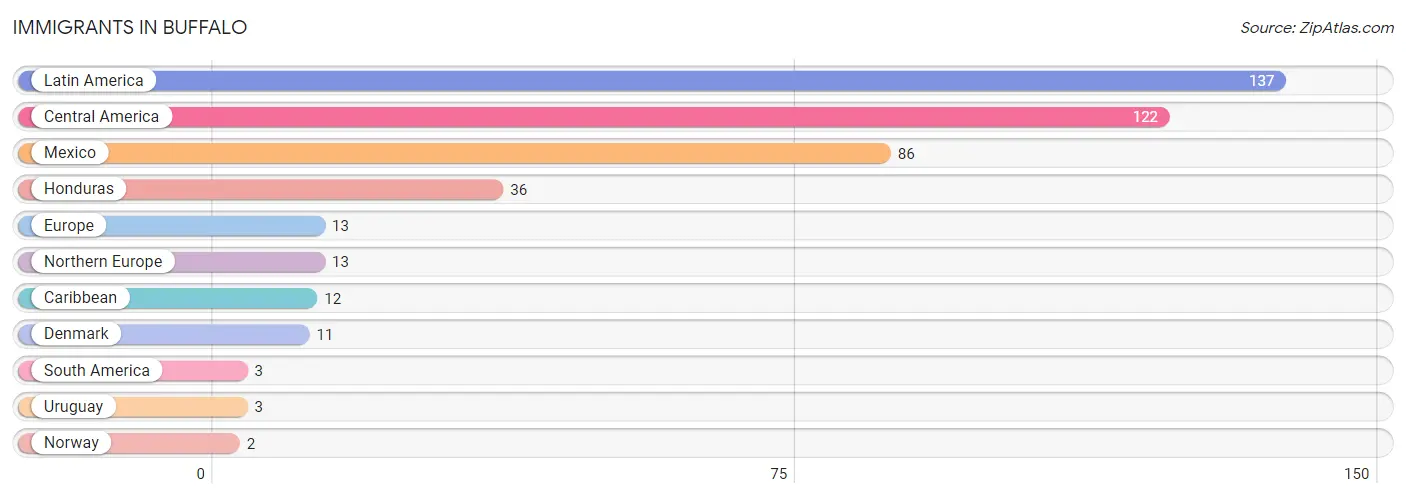
| Immigration Origin | # Population | % Population |
| Caribbean | 12 | 0.6% |
| Central America | 122 | 6.6% |
| Denmark | 11 | 0.6% |
| Europe | 13 | 0.7% |
| Honduras | 36 | 2.0% |
| Latin America | 137 | 7.4% |
| Mexico | 86 | 4.7% |
| Northern Europe | 13 | 0.7% |
| Norway | 2 | 0.1% |
| South America | 3 | 0.2% |
| Uruguay | 3 | 0.2% | View All 11 Rows |
Sex and Age in Buffalo
Sex and Age in Buffalo
The most populous age groups in Buffalo are Under 5 Years (134 | 15.8%) for men and 55 to 59 Years (109 | 11.0%) for women.
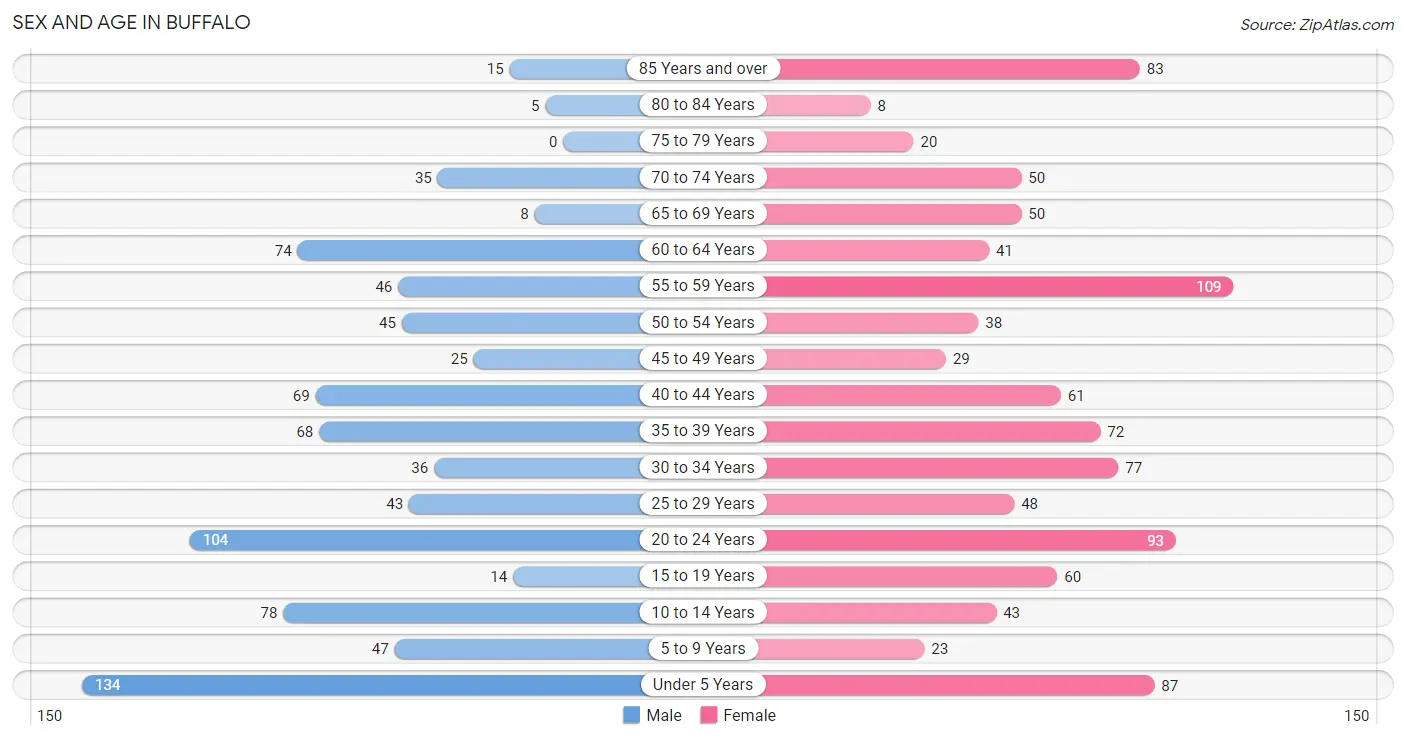
| Age Bracket | Male | Female |
| Under 5 Years | 134 (15.8%) | 87 (8.8%) |
| 5 to 9 Years | 47 (5.6%) | 23 (2.3%) |
| 10 to 14 Years | 78 (9.2%) | 43 (4.3%) |
| 15 to 19 Years | 14 (1.7%) | 60 (6.0%) |
| 20 to 24 Years | 104 (12.3%) | 93 (9.4%) |
| 25 to 29 Years | 43 (5.1%) | 48 (4.8%) |
| 30 to 34 Years | 36 (4.3%) | 77 (7.8%) |
| 35 to 39 Years | 68 (8.0%) | 72 (7.3%) |
| 40 to 44 Years | 69 (8.2%) | 61 (6.1%) |
| 45 to 49 Years | 25 (3.0%) | 29 (2.9%) |
| 50 to 54 Years | 45 (5.3%) | 38 (3.8%) |
| 55 to 59 Years | 46 (5.4%) | 109 (11.0%) |
| 60 to 64 Years | 74 (8.7%) | 41 (4.1%) |
| 65 to 69 Years | 8 (0.9%) | 50 (5.0%) |
| 70 to 74 Years | 35 (4.1%) | 50 (5.0%) |
| 75 to 79 Years | 0 (0.0%) | 20 (2.0%) |
| 80 to 84 Years | 5 (0.6%) | 8 (0.8%) |
| 85 Years and over | 15 (1.8%) | 83 (8.4%) |
| Total | 846 (100.0%) | 992 (100.0%) |
Families and Households in Buffalo
Median Family Size in Buffalo
The median family size in Buffalo is 3.06 persons per family, with single male/father families (24 | 4.9%) accounting for the largest median family size of 3.21 persons per family. On the other hand, married-couple families (377 | 77.6%) represent the smallest median family size with 3.02 persons per family.
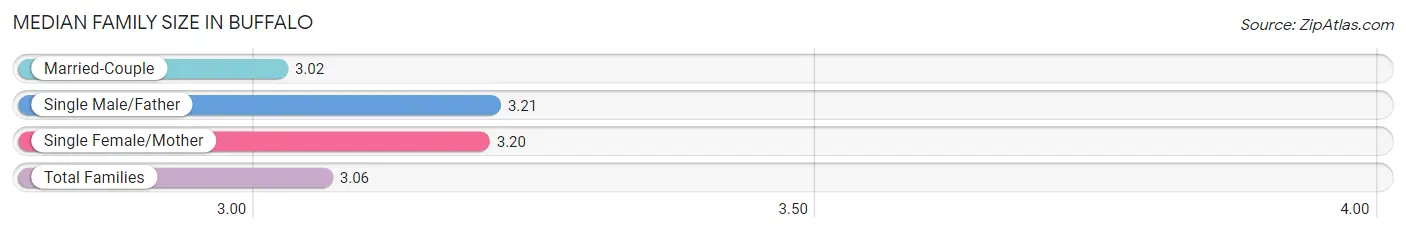
| Family Type | # Families | Family Size |
| Married-Couple | 377 (77.6%) | 3.02 |
| Single Male/Father | 24 (4.9%) | 3.21 |
| Single Female/Mother | 85 (17.5%) | 3.20 |
| Total Families | 486 (100.0%) | 3.06 |
Median Household Size in Buffalo
The median household size in Buffalo is 2.42 persons per household, with single male/father households (24 | 3.2%) accounting for the largest median household size of 3.79 persons per household. non-family households (269 | 35.6%) represent the smallest median household size with 1.20 persons per household.
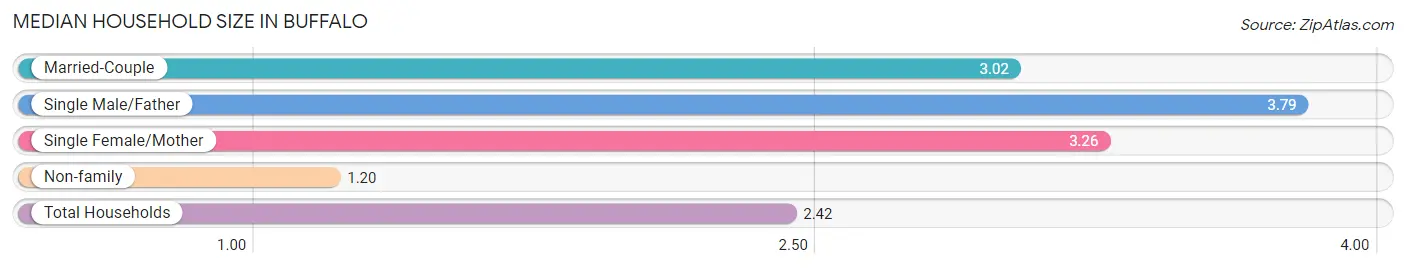
| Household Type | # Households | Household Size |
| Married-Couple | 377 (49.9%) | 3.02 |
| Single Male/Father | 24 (3.2%) | 3.79 |
| Single Female/Mother | 85 (11.3%) | 3.26 |
| Non-family | 269 (35.6%) | 1.20 |
| Total Households | 755 (100.0%) | 2.42 |
Household Size by Marriage Status in Buffalo
Out of a total of 755 households in Buffalo, 486 (64.4%) are family households, while 269 (35.6%) are nonfamily households. The most numerous type of family households are 2-person households, comprising 237, and the most common type of nonfamily households are 1-person households, comprising 227.
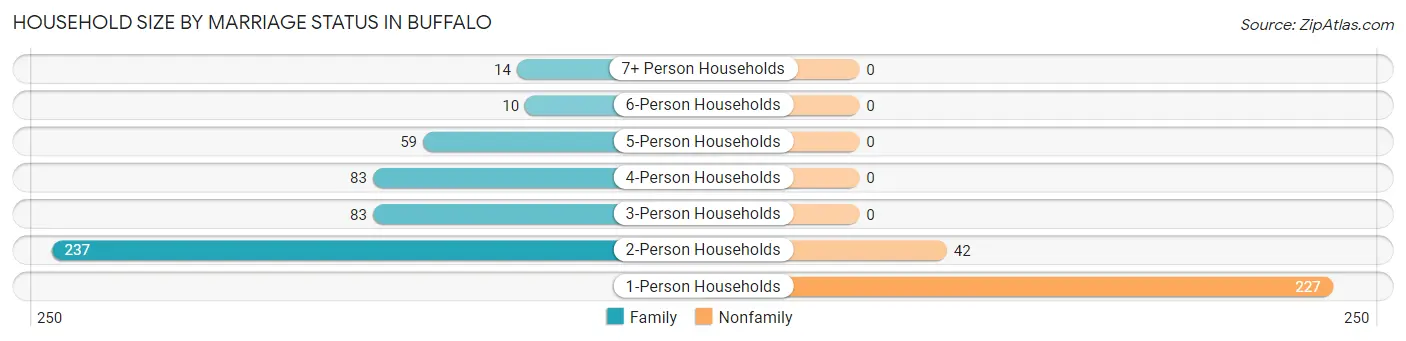
| Household Size | Family Households | Nonfamily Households |
| 1-Person Households | - | 227 (30.1%) |
| 2-Person Households | 237 (31.4%) | 42 (5.6%) |
| 3-Person Households | 83 (11.0%) | 0 (0.0%) |
| 4-Person Households | 83 (11.0%) | 0 (0.0%) |
| 5-Person Households | 59 (7.8%) | 0 (0.0%) |
| 6-Person Households | 10 (1.3%) | 0 (0.0%) |
| 7+ Person Households | 14 (1.8%) | 0 (0.0%) |
| Total | 486 (64.4%) | 269 (35.6%) |
Female Fertility in Buffalo
Fertility by Age in Buffalo
Average fertility rate in Buffalo is 79.0 births per 1,000 women. Women in the age bracket of 20 to 34 years have the highest fertility rate with 133.0 births per 1,000 women. Women in the age bracket of 20 to 34 years acount for 82.9% of all women with births.
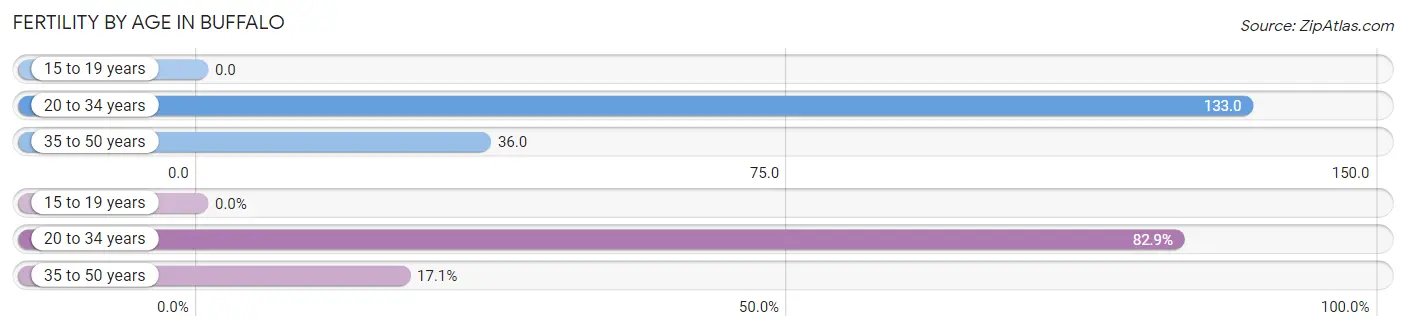
| Age Bracket | Women with Births | Births / 1,000 Women |
| 15 to 19 years | 0 (0.0%) | 0.0 |
| 20 to 34 years | 29 (82.9%) | 133.0 |
| 35 to 50 years | 6 (17.1%) | 36.0 |
| Total | 35 (100.0%) | 79.0 |
Fertility by Age by Marriage Status in Buffalo
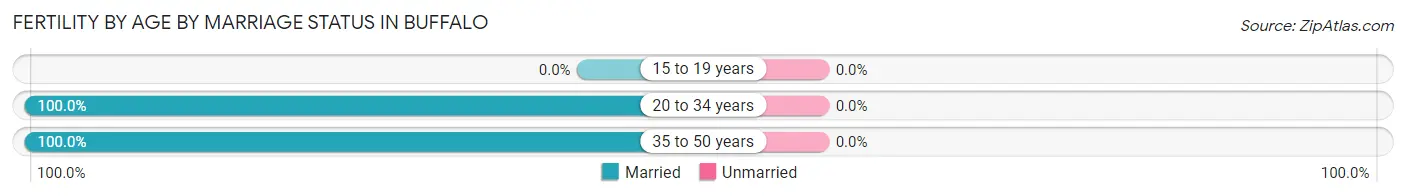
| Age Bracket | Married | Unmarried |
| 15 to 19 years | 0 (0.0%) | 0 (0.0%) |
| 20 to 34 years | 29 (100.0%) | 0 (0.0%) |
| 35 to 50 years | 6 (100.0%) | 0 (0.0%) |
| Total | 35 (100.0%) | 0 (0.0%) |
Fertility by Education in Buffalo
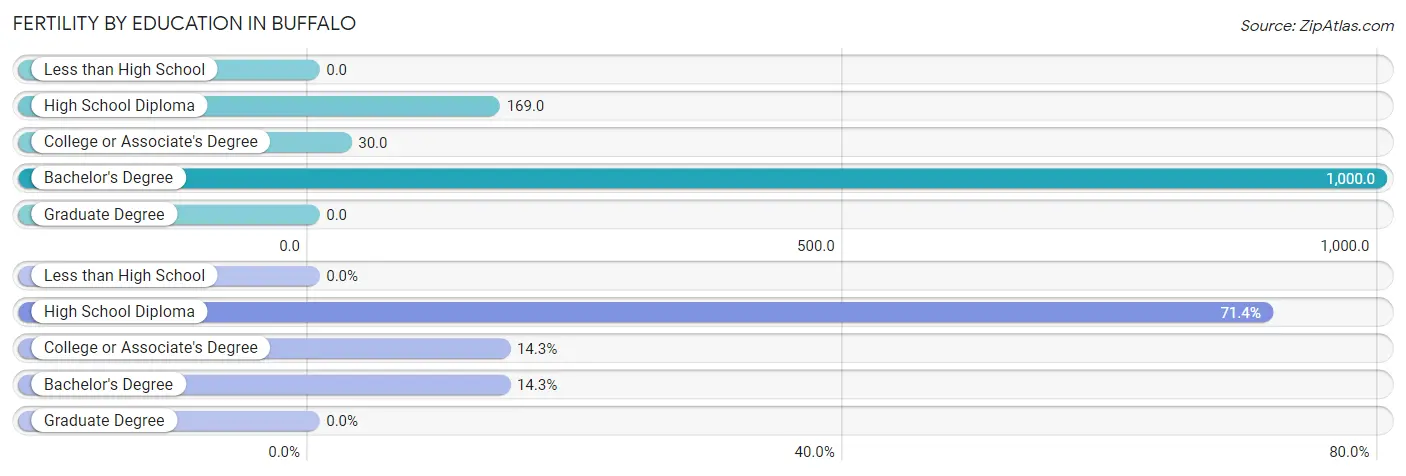
| Educational Attainment | Women with Births | Births / 1,000 Women |
| Less than High School | 0 (0.0%) | 0.0 |
| High School Diploma | 25 (71.4%) | 169.0 |
| College or Associate's Degree | 5 (14.3%) | 30.0 |
| Bachelor's Degree | 5 (14.3%) | 1,000.0 |
| Graduate Degree | 0 (0.0%) | 0.0 |
| Total | 35 (100.0%) | 79.0 |
Fertility by Education by Marriage Status in Buffalo
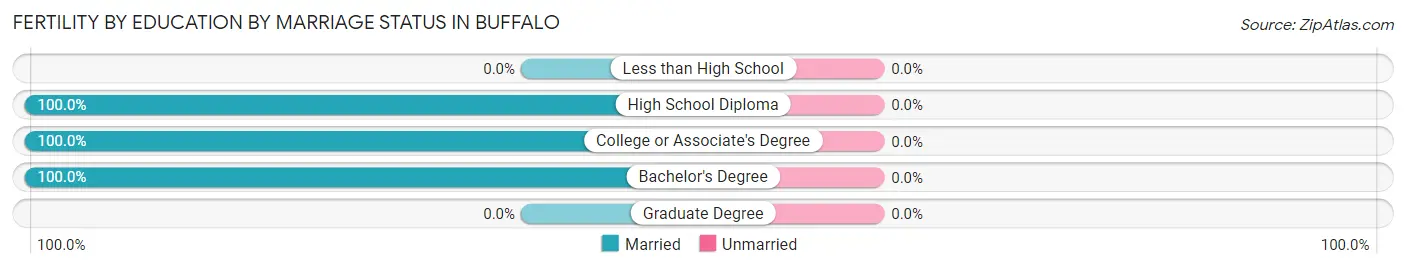
| Educational Attainment | Married | Unmarried |
| Less than High School | 0 (0.0%) | 0 (0.0%) |
| High School Diploma | 25 (100.0%) | 0 (0.0%) |
| College or Associate's Degree | 5 (100.0%) | 0 (0.0%) |
| Bachelor's Degree | 5 (100.0%) | 0 (0.0%) |
| Graduate Degree | 0 (0.0%) | 0 (0.0%) |
| Total | 35 (100.0%) | 0 (0.0%) |
Employment Characteristics in Buffalo
Employment by Class of Employer in Buffalo
Among the 715 employed individuals in Buffalo, private company employees (533 | 74.6%), state government employees (66 | 9.2%), and self-employed (not incorporated) (40 | 5.6%) make up the most common classes of employment.
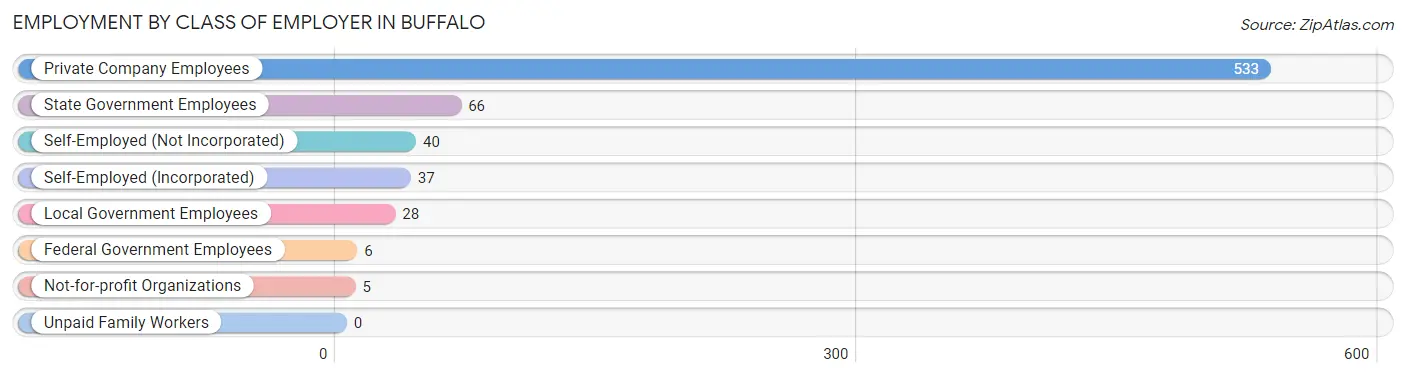
| Employer Class | # Employees | % Employees |
| Private Company Employees | 533 | 74.6% |
| Self-Employed (Incorporated) | 37 | 5.2% |
| Self-Employed (Not Incorporated) | 40 | 5.6% |
| Not-for-profit Organizations | 5 | 0.7% |
| Local Government Employees | 28 | 3.9% |
| State Government Employees | 66 | 9.2% |
| Federal Government Employees | 6 | 0.8% |
| Unpaid Family Workers | 0 | 0.0% |
| Total | 715 | 100.0% |
Employment Status by Age in Buffalo
According to the labor force statistics for Buffalo, out of the total population over 16 years of age (1,426), 56.7% or 809 individuals are in the labor force, with 10.9% or 88 of them unemployed. The age group with the highest labor force participation rate is 30 to 34 years, with 90.3% or 102 individuals in the labor force. Within the labor force, the 35 to 44 years age range has the highest percentage of unemployed individuals, with 29.8% or 68 of them being unemployed.
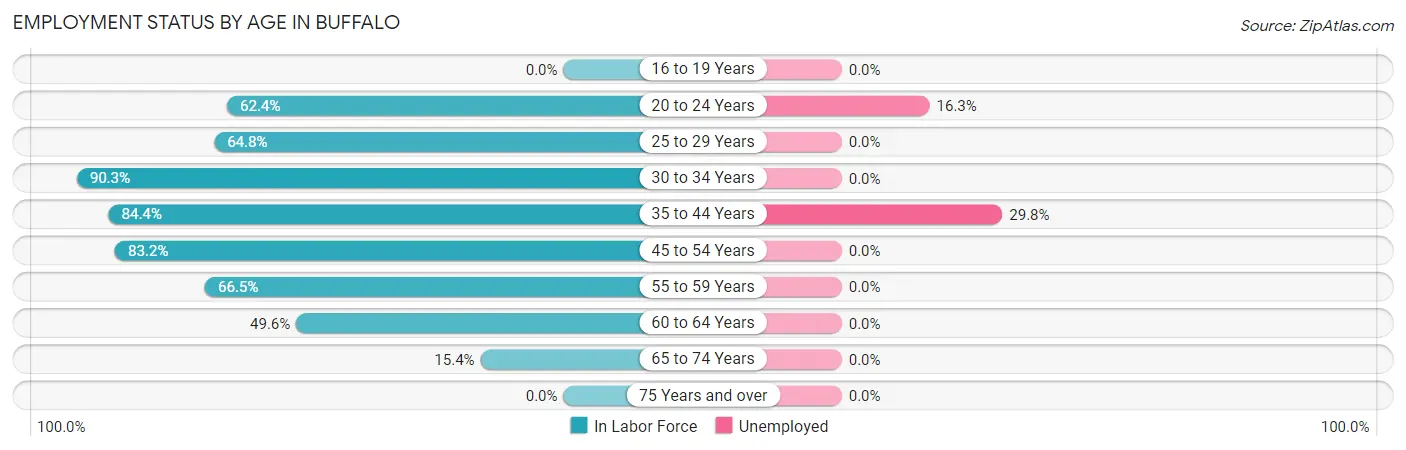
| Age Bracket | In Labor Force | Unemployed |
| 16 to 19 Years | 0 (0.0%) | 0 (0.0%) |
| 20 to 24 Years | 123 (62.4%) | 20 (16.3%) |
| 25 to 29 Years | 59 (64.8%) | 0 (0.0%) |
| 30 to 34 Years | 102 (90.3%) | 0 (0.0%) |
| 35 to 44 Years | 228 (84.4%) | 68 (29.8%) |
| 45 to 54 Years | 114 (83.2%) | 0 (0.0%) |
| 55 to 59 Years | 103 (66.5%) | 0 (0.0%) |
| 60 to 64 Years | 57 (49.6%) | 0 (0.0%) |
| 65 to 74 Years | 22 (15.4%) | 0 (0.0%) |
| 75 Years and over | 0 (0.0%) | 0 (0.0%) |
| Total | 809 (56.7%) | 88 (10.9%) |
Employment Status by Educational Attainment in Buffalo
According to labor force statistics for Buffalo, 75.3% of individuals (663) out of the total population between 25 and 64 years of age (881) are in the labor force, with 10.3% or 68 of them being unemployed. The group with the highest labor force participation rate are those with the educational attainment of college / associate degree, with 88.1% or 355 individuals in the labor force. Within the labor force, individuals with college / associate degree education have the highest percentage of unemployment, with 15.8% or 56 of them being unemployed.
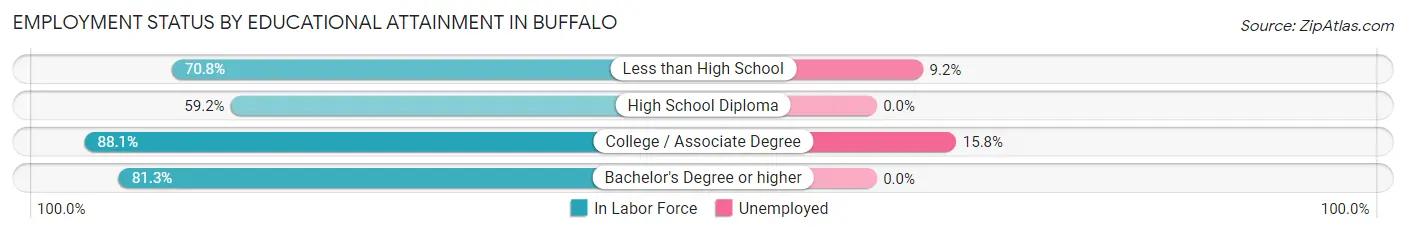
| Educational Attainment | In Labor Force | Unemployed |
| Less than High School | 131 (70.8%) | 17 (9.2%) |
| High School Diploma | 164 (59.2%) | 0 (0.0%) |
| College / Associate Degree | 355 (88.1%) | 64 (15.8%) |
| Bachelor's Degree or higher | 13 (81.3%) | 0 (0.0%) |
| Total | 663 (75.3%) | 91 (10.3%) |
Employment Occupations by Sex in Buffalo
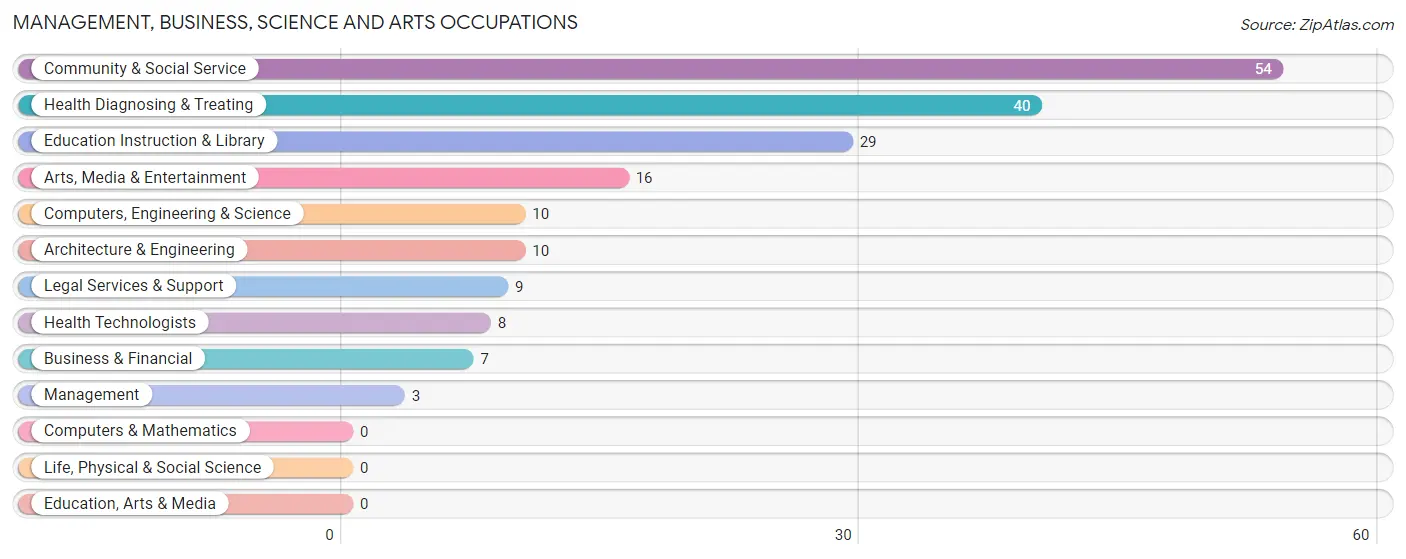
Management, Business, Science and Arts Occupations
The most common Management, Business, Science and Arts occupations in Buffalo are Community & Social Service (54 | 7.5%), Health Diagnosing & Treating (40 | 5.6%), Education Instruction & Library (29 | 4.0%), Arts, Media & Entertainment (16 | 2.2%), and Computers, Engineering & Science (10 | 1.4%).
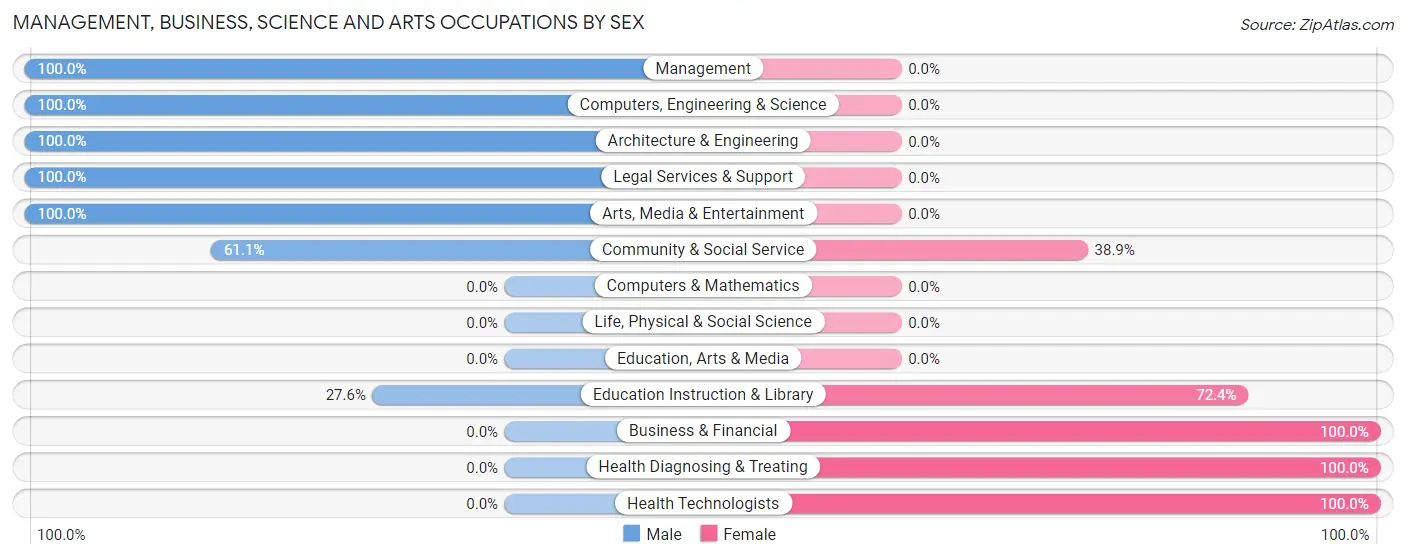
Management, Business, Science and Arts Occupations by Sex
Within the Management, Business, Science and Arts occupations in Buffalo, the most male-oriented occupations are Management (100.0%), Computers, Engineering & Science (100.0%), and Architecture & Engineering (100.0%), while the most female-oriented occupations are Business & Financial (100.0%), Health Diagnosing & Treating (100.0%), and Health Technologists (100.0%).
| Occupation | Male | Female |
| Management | 3 (100.0%) | 0 (0.0%) |
| Business & Financial | 0 (0.0%) | 7 (100.0%) |
| Computers, Engineering & Science | 10 (100.0%) | 0 (0.0%) |
| Computers & Mathematics | 0 (0.0%) | 0 (0.0%) |
| Architecture & Engineering | 10 (100.0%) | 0 (0.0%) |
| Life, Physical & Social Science | 0 (0.0%) | 0 (0.0%) |
| Community & Social Service | 33 (61.1%) | 21 (38.9%) |
| Education, Arts & Media | 0 (0.0%) | 0 (0.0%) |
| Legal Services & Support | 9 (100.0%) | 0 (0.0%) |
| Education Instruction & Library | 8 (27.6%) | 21 (72.4%) |
| Arts, Media & Entertainment | 16 (100.0%) | 0 (0.0%) |
| Health Diagnosing & Treating | 0 (0.0%) | 40 (100.0%) |
| Health Technologists | 0 (0.0%) | 8 (100.0%) |
| Total (Category) | 46 (40.4%) | 68 (59.7%) |
| Total (Overall) | 424 (58.9%) | 296 (41.1%) |
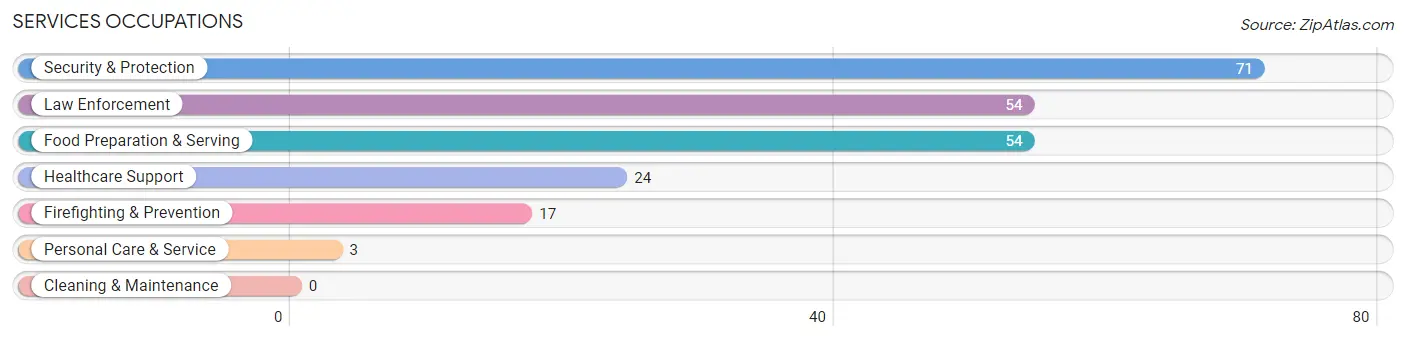
Services Occupations
The most common Services occupations in Buffalo are Security & Protection (71 | 9.9%), Law Enforcement (54 | 7.5%), Food Preparation & Serving (54 | 7.5%), Healthcare Support (24 | 3.3%), and Firefighting & Prevention (17 | 2.4%).
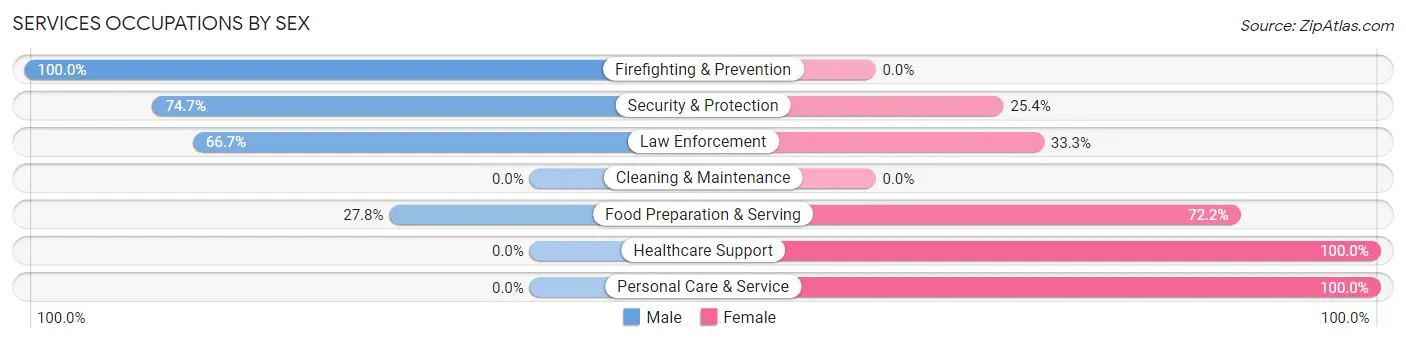
Services Occupations by Sex
Within the Services occupations in Buffalo, the most male-oriented occupations are Firefighting & Prevention (100.0%), Security & Protection (74.7%), and Law Enforcement (66.7%), while the most female-oriented occupations are Healthcare Support (100.0%), Personal Care & Service (100.0%), and Food Preparation & Serving (72.2%).
| Occupation | Male | Female |
| Healthcare Support | 0 (0.0%) | 24 (100.0%) |
| Security & Protection | 53 (74.7%) | 18 (25.4%) |
| Firefighting & Prevention | 17 (100.0%) | 0 (0.0%) |
| Law Enforcement | 36 (66.7%) | 18 (33.3%) |
| Food Preparation & Serving | 15 (27.8%) | 39 (72.2%) |
| Cleaning & Maintenance | 0 (0.0%) | 0 (0.0%) |
| Personal Care & Service | 0 (0.0%) | 3 (100.0%) |
| Total (Category) | 68 (44.7%) | 84 (55.3%) |
| Total (Overall) | 424 (58.9%) | 296 (41.1%) |
Sales and Office Occupations
The most common Sales and Office occupations in Buffalo are Office & Administration (63 | 8.7%), and Sales & Related (33 | 4.6%).

Sales and Office Occupations by Sex
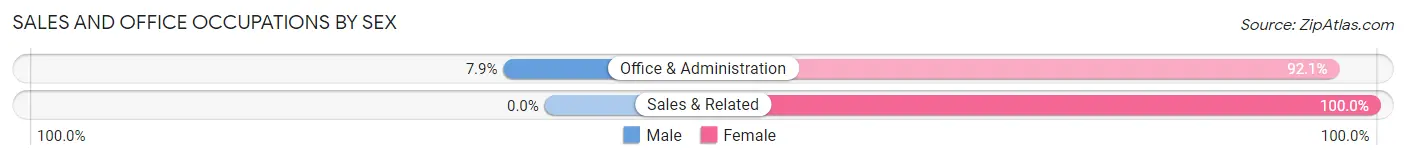
| Occupation | Male | Female |
| Sales & Related | 0 (0.0%) | 33 (100.0%) |
| Office & Administration | 5 (7.9%) | 58 (92.1%) |
| Total (Category) | 5 (5.2%) | 91 (94.8%) |
| Total (Overall) | 424 (58.9%) | 296 (41.1%) |
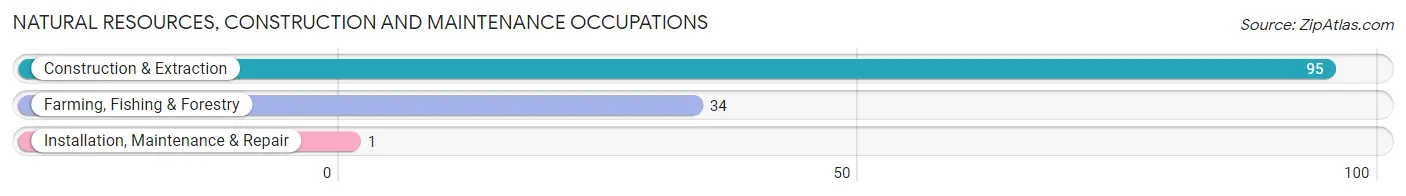
Natural Resources, Construction and Maintenance Occupations
The most common Natural Resources, Construction and Maintenance occupations in Buffalo are Construction & Extraction (95 | 13.2%), Farming, Fishing & Forestry (34 | 4.7%), and Installation, Maintenance & Repair (1 | 0.1%).
Natural Resources, Construction and Maintenance Occupations by Sex
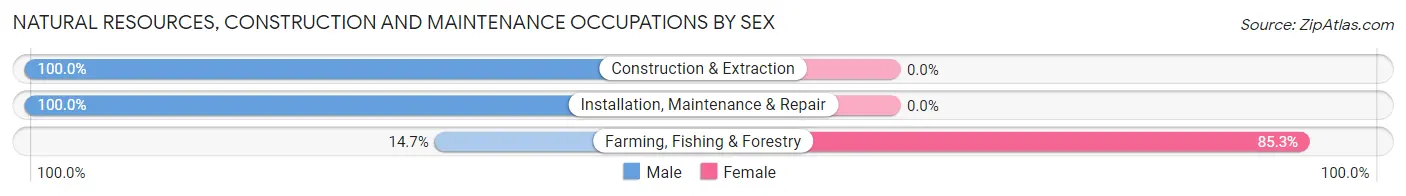
| Occupation | Male | Female |
| Farming, Fishing & Forestry | 5 (14.7%) | 29 (85.3%) |
| Construction & Extraction | 95 (100.0%) | 0 (0.0%) |
| Installation, Maintenance & Repair | 1 (100.0%) | 0 (0.0%) |
| Total (Category) | 101 (77.7%) | 29 (22.3%) |
| Total (Overall) | 424 (58.9%) | 296 (41.1%) |
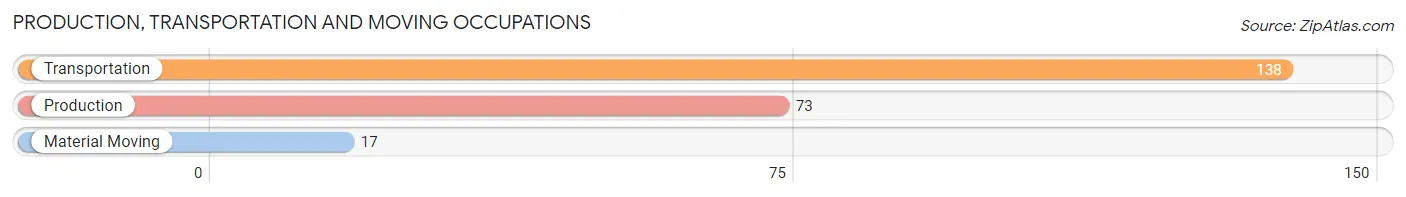
Production, Transportation and Moving Occupations
The most common Production, Transportation and Moving occupations in Buffalo are Transportation (138 | 19.2%), Production (73 | 10.1%), and Material Moving (17 | 2.4%).
Production, Transportation and Moving Occupations by Sex
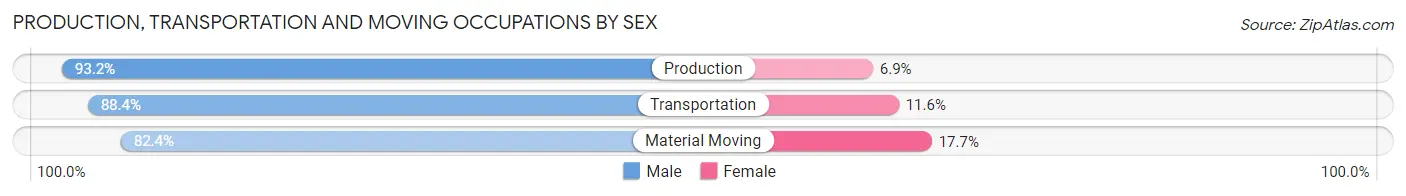
| Occupation | Male | Female |
| Production | 68 (93.1%) | 5 (6.9%) |
| Transportation | 122 (88.4%) | 16 (11.6%) |
| Material Moving | 14 (82.4%) | 3 (17.6%) |
| Total (Category) | 204 (89.5%) | 24 (10.5%) |
| Total (Overall) | 424 (58.9%) | 296 (41.1%) |
Employment Industries by Sex in Buffalo
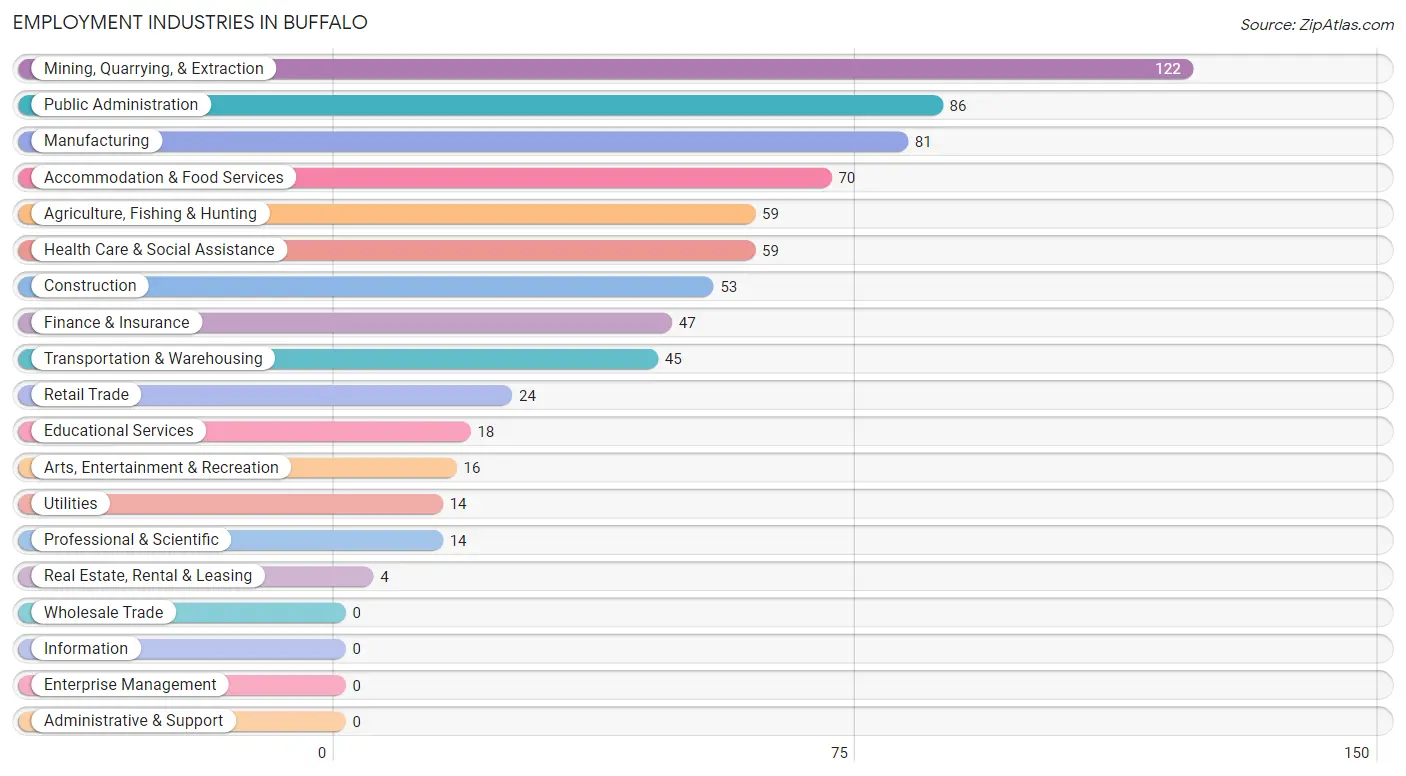
Employment Industries in Buffalo
The major employment industries in Buffalo include Mining, Quarrying, & Extraction (122 | 16.9%), Public Administration (86 | 11.9%), Manufacturing (81 | 11.3%), Accommodation & Food Services (70 | 9.7%), and Agriculture, Fishing & Hunting (59 | 8.2%).
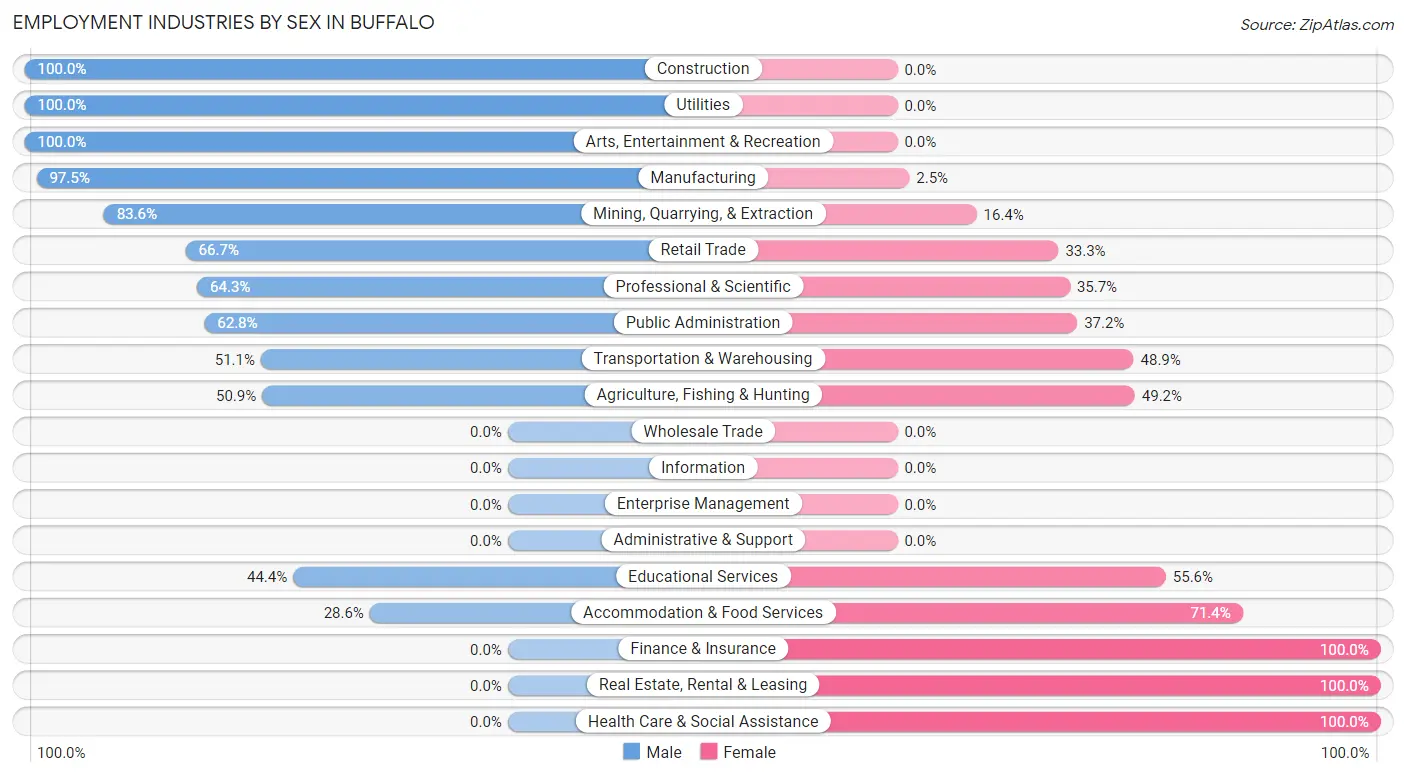
Employment Industries by Sex in Buffalo
The Buffalo industries that see more men than women are Construction (100.0%), Utilities (100.0%), and Arts, Entertainment & Recreation (100.0%), whereas the industries that tend to have a higher number of women are Finance & Insurance (100.0%), Real Estate, Rental & Leasing (100.0%), and Health Care & Social Assistance (100.0%).
| Industry | Male | Female |
| Agriculture, Fishing & Hunting | 30 (50.8%) | 29 (49.1%) |
| Mining, Quarrying, & Extraction | 102 (83.6%) | 20 (16.4%) |
| Construction | 53 (100.0%) | 0 (0.0%) |
| Manufacturing | 79 (97.5%) | 2 (2.5%) |
| Wholesale Trade | 0 (0.0%) | 0 (0.0%) |
| Retail Trade | 16 (66.7%) | 8 (33.3%) |
| Transportation & Warehousing | 23 (51.1%) | 22 (48.9%) |
| Utilities | 14 (100.0%) | 0 (0.0%) |
| Information | 0 (0.0%) | 0 (0.0%) |
| Finance & Insurance | 0 (0.0%) | 47 (100.0%) |
| Real Estate, Rental & Leasing | 0 (0.0%) | 4 (100.0%) |
| Professional & Scientific | 9 (64.3%) | 5 (35.7%) |
| Enterprise Management | 0 (0.0%) | 0 (0.0%) |
| Administrative & Support | 0 (0.0%) | 0 (0.0%) |
| Educational Services | 8 (44.4%) | 10 (55.6%) |
| Health Care & Social Assistance | 0 (0.0%) | 59 (100.0%) |
| Arts, Entertainment & Recreation | 16 (100.0%) | 0 (0.0%) |
| Accommodation & Food Services | 20 (28.6%) | 50 (71.4%) |
| Public Administration | 54 (62.8%) | 32 (37.2%) |
| Total | 424 (58.9%) | 296 (41.1%) |
Education in Buffalo
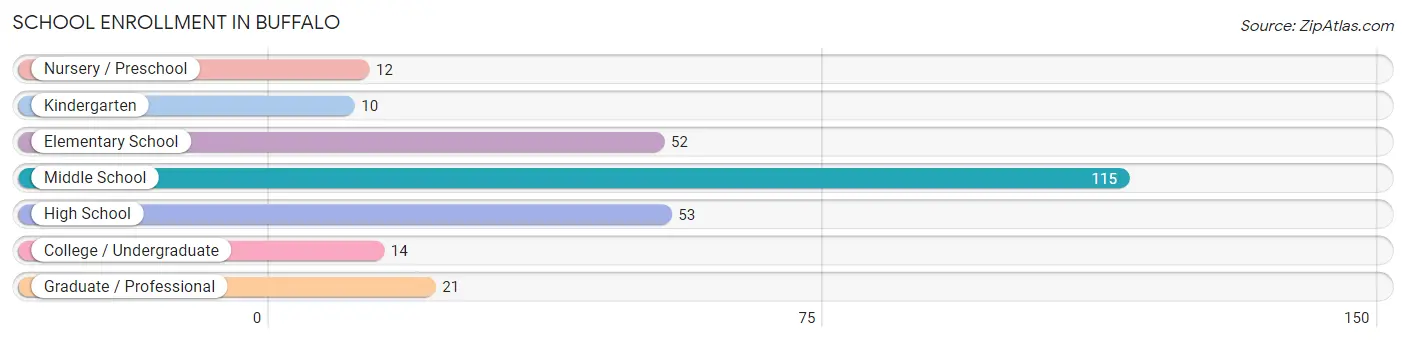
School Enrollment in Buffalo
The most common levels of schooling among the 277 students in Buffalo are middle school (115 | 41.5%), high school (53 | 19.1%), and elementary school (52 | 18.8%).
| School Level | # Students | % Students |
| Nursery / Preschool | 12 | 4.3% |
| Kindergarten | 10 | 3.6% |
| Elementary School | 52 | 18.8% |
| Middle School | 115 | 41.5% |
| High School | 53 | 19.1% |
| College / Undergraduate | 14 | 5.1% |
| Graduate / Professional | 21 | 7.6% |
| Total | 277 | 100.0% |
School Enrollment by Age by Funding Source in Buffalo
Out of a total of 277 students who are enrolled in schools in Buffalo, 5 (1.8%) attend a private institution, while the remaining 272 (98.2%) are enrolled in public schools. The age group of 15 to 17 year olds has the highest likelihood of being enrolled in private schools, with 5 (10.4% in the age bracket) enrolled. Conversely, the age group of 3 to 4 year olds has the lowest likelihood of being enrolled in a private school, with 12 (100.0% in the age bracket) attending a public institution.
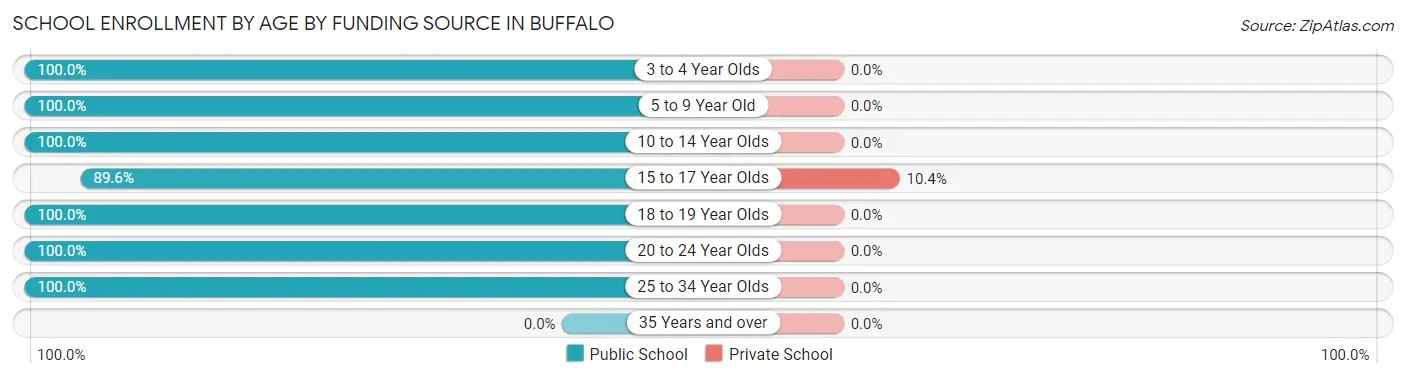
| Age Bracket | Public School | Private School |
| 3 to 4 Year Olds | 12 (100.0%) | 0 (0.0%) |
| 5 to 9 Year Old | 57 (100.0%) | 0 (0.0%) |
| 10 to 14 Year Olds | 121 (100.0%) | 0 (0.0%) |
| 15 to 17 Year Olds | 43 (89.6%) | 5 (10.4%) |
| 18 to 19 Year Olds | 4 (100.0%) | 0 (0.0%) |
| 20 to 24 Year Olds | 11 (100.0%) | 0 (0.0%) |
| 25 to 34 Year Olds | 24 (100.0%) | 0 (0.0%) |
| 35 Years and over | 0 (0.0%) | 0 (0.0%) |
| Total | 272 (98.2%) | 5 (1.8%) |
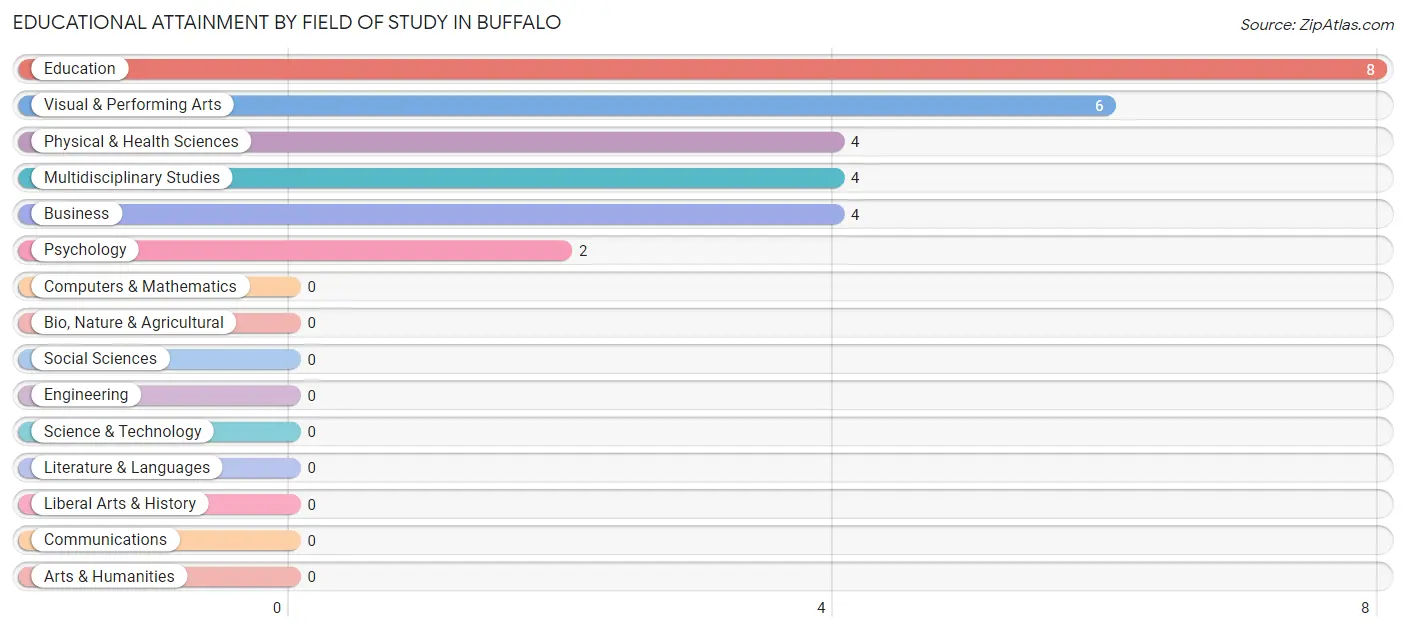
Educational Attainment by Field of Study in Buffalo
Education (8 | 28.6%), visual & performing arts (6 | 21.4%), physical & health sciences (4 | 14.3%), multidisciplinary studies (4 | 14.3%), and business (4 | 14.3%) are the most common fields of study among 28 individuals in Buffalo who have obtained a bachelor's degree or higher.
| Field of Study | # Graduates | % Graduates |
| Computers & Mathematics | 0 | 0.0% |
| Bio, Nature & Agricultural | 0 | 0.0% |
| Physical & Health Sciences | 4 | 14.3% |
| Psychology | 2 | 7.1% |
| Social Sciences | 0 | 0.0% |
| Engineering | 0 | 0.0% |
| Multidisciplinary Studies | 4 | 14.3% |
| Science & Technology | 0 | 0.0% |
| Business | 4 | 14.3% |
| Education | 8 | 28.6% |
| Literature & Languages | 0 | 0.0% |
| Liberal Arts & History | 0 | 0.0% |
| Visual & Performing Arts | 6 | 21.4% |
| Communications | 0 | 0.0% |
| Arts & Humanities | 0 | 0.0% |
| Total | 28 | 100.0% |
Transportation & Commute in Buffalo
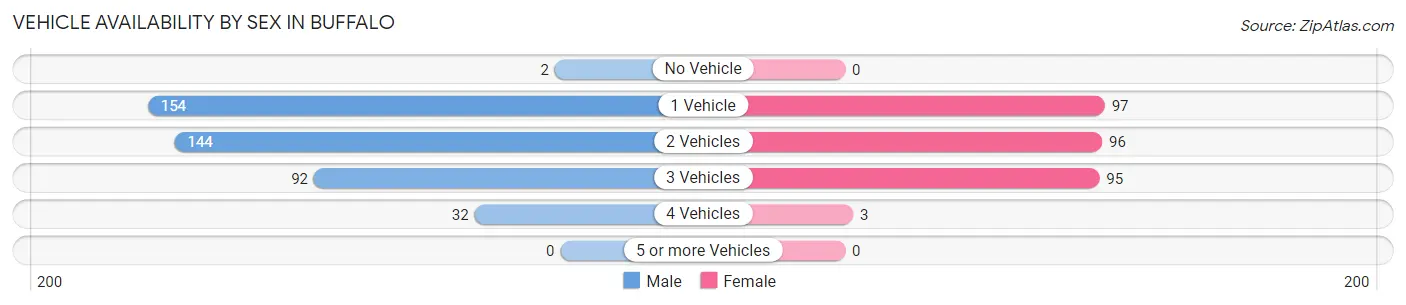
Vehicle Availability by Sex in Buffalo
The most prevalent vehicle ownership categories in Buffalo are males with 1 vehicle (154, accounting for 36.3%) and females with 1 vehicle (97, making up 52.9%).
| Vehicles Available | Male | Female |
| No Vehicle | 2 (0.5%) | 0 (0.0%) |
| 1 Vehicle | 154 (36.3%) | 97 (33.3%) |
| 2 Vehicles | 144 (34.0%) | 96 (33.0%) |
| 3 Vehicles | 92 (21.7%) | 95 (32.7%) |
| 4 Vehicles | 32 (7.5%) | 3 (1.0%) |
| 5 or more Vehicles | 0 (0.0%) | 0 (0.0%) |
| Total | 424 (100.0%) | 291 (100.0%) |
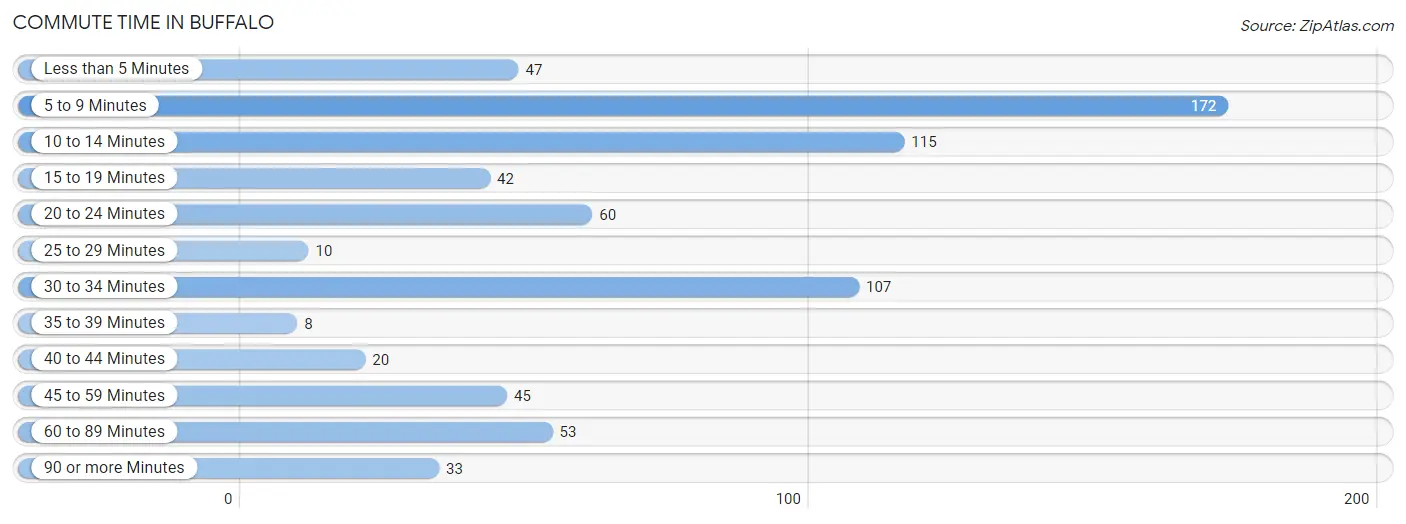
Commute Time in Buffalo
The most frequently occuring commute durations in Buffalo are 5 to 9 minutes (172 commuters, 24.2%), 10 to 14 minutes (115 commuters, 16.2%), and 30 to 34 minutes (107 commuters, 15.0%).
| Commute Time | # Commuters | % Commuters |
| Less than 5 Minutes | 47 | 6.6% |
| 5 to 9 Minutes | 172 | 24.2% |
| 10 to 14 Minutes | 115 | 16.2% |
| 15 to 19 Minutes | 42 | 5.9% |
| 20 to 24 Minutes | 60 | 8.4% |
| 25 to 29 Minutes | 10 | 1.4% |
| 30 to 34 Minutes | 107 | 15.0% |
| 35 to 39 Minutes | 8 | 1.1% |
| 40 to 44 Minutes | 20 | 2.8% |
| 45 to 59 Minutes | 45 | 6.3% |
| 60 to 89 Minutes | 53 | 7.4% |
| 90 or more Minutes | 33 | 4.6% |
Commute Time by Sex in Buffalo
The most common commute times in Buffalo are 5 to 9 minutes (92 commuters, 21.7%) for males and 5 to 9 minutes (80 commuters, 27.8%) for females.
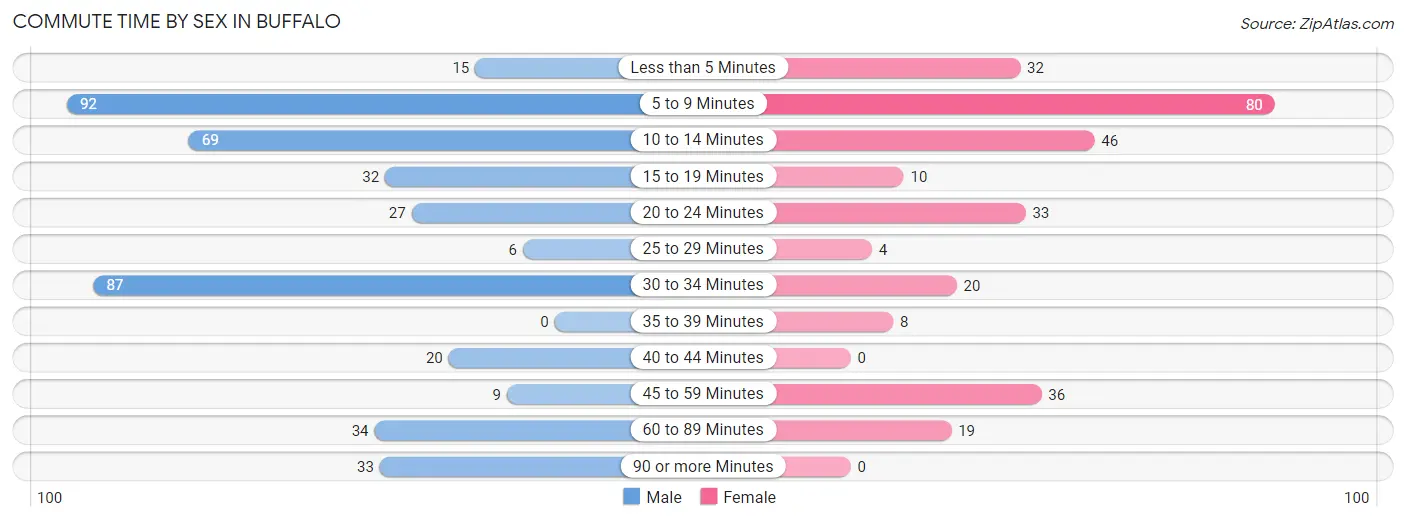
| Commute Time | Male | Female |
| Less than 5 Minutes | 15 (3.5%) | 32 (11.1%) |
| 5 to 9 Minutes | 92 (21.7%) | 80 (27.8%) |
| 10 to 14 Minutes | 69 (16.3%) | 46 (16.0%) |
| 15 to 19 Minutes | 32 (7.5%) | 10 (3.5%) |
| 20 to 24 Minutes | 27 (6.4%) | 33 (11.5%) |
| 25 to 29 Minutes | 6 (1.4%) | 4 (1.4%) |
| 30 to 34 Minutes | 87 (20.5%) | 20 (6.9%) |
| 35 to 39 Minutes | 0 (0.0%) | 8 (2.8%) |
| 40 to 44 Minutes | 20 (4.7%) | 0 (0.0%) |
| 45 to 59 Minutes | 9 (2.1%) | 36 (12.5%) |
| 60 to 89 Minutes | 34 (8.0%) | 19 (6.6%) |
| 90 or more Minutes | 33 (7.8%) | 0 (0.0%) |
Time of Departure to Work by Sex in Buffalo
The most frequent times of departure to work in Buffalo are 12:00 AM to 4:59 AM (81, 19.1%) for males and 7:30 AM to 7:59 AM (99, 34.4%) for females.
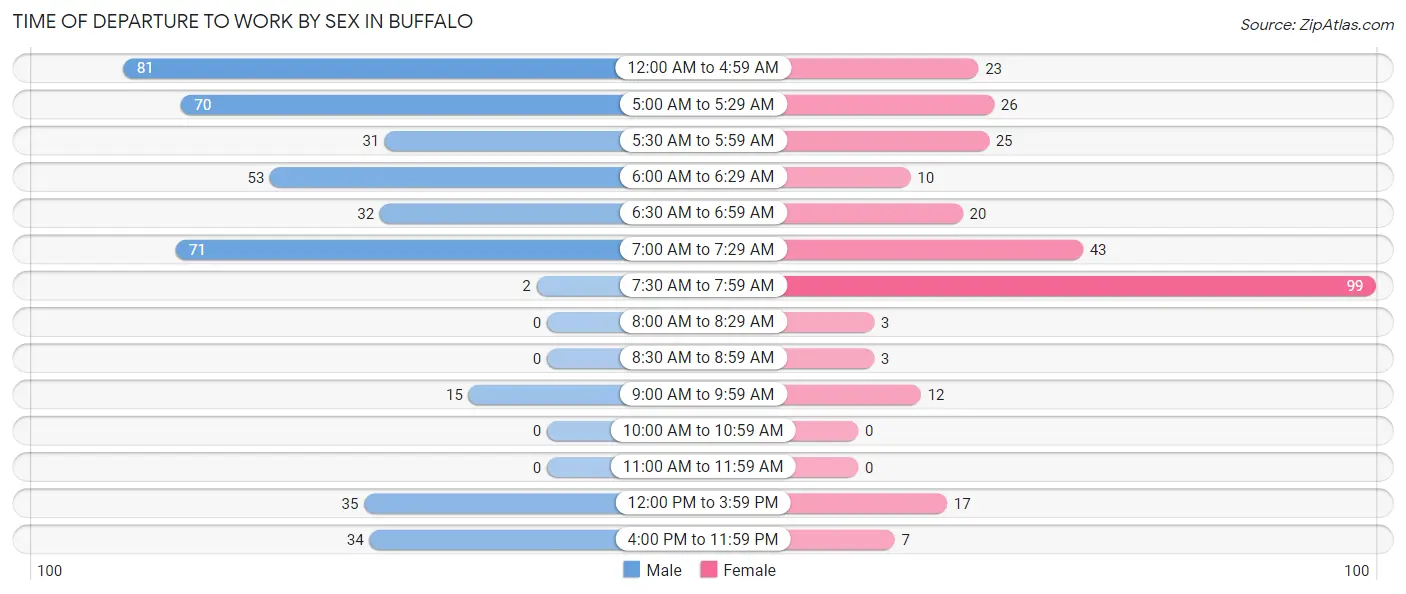
| Time of Departure | Male | Female |
| 12:00 AM to 4:59 AM | 81 (19.1%) | 23 (8.0%) |
| 5:00 AM to 5:29 AM | 70 (16.5%) | 26 (9.0%) |
| 5:30 AM to 5:59 AM | 31 (7.3%) | 25 (8.7%) |
| 6:00 AM to 6:29 AM | 53 (12.5%) | 10 (3.5%) |
| 6:30 AM to 6:59 AM | 32 (7.5%) | 20 (6.9%) |
| 7:00 AM to 7:29 AM | 71 (16.8%) | 43 (14.9%) |
| 7:30 AM to 7:59 AM | 2 (0.5%) | 99 (34.4%) |
| 8:00 AM to 8:29 AM | 0 (0.0%) | 3 (1.0%) |
| 8:30 AM to 8:59 AM | 0 (0.0%) | 3 (1.0%) |
| 9:00 AM to 9:59 AM | 15 (3.5%) | 12 (4.2%) |
| 10:00 AM to 10:59 AM | 0 (0.0%) | 0 (0.0%) |
| 11:00 AM to 11:59 AM | 0 (0.0%) | 0 (0.0%) |
| 12:00 PM to 3:59 PM | 35 (8.3%) | 17 (5.9%) |
| 4:00 PM to 11:59 PM | 34 (8.0%) | 7 (2.4%) |
| Total | 424 (100.0%) | 288 (100.0%) |
Housing Occupancy in Buffalo
Occupancy by Ownership in Buffalo
Of the total 755 dwellings in Buffalo, owner-occupied units account for 414 (54.8%), while renter-occupied units make up 341 (45.2%).
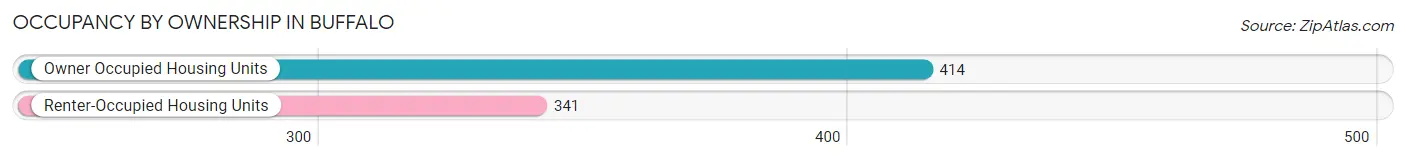
| Occupancy | # Housing Units | % Housing Units |
| Owner Occupied Housing Units | 414 | 54.8% |
| Renter-Occupied Housing Units | 341 | 45.2% |
| Total Occupied Housing Units | 755 | 100.0% |
Occupancy by Household Size in Buffalo
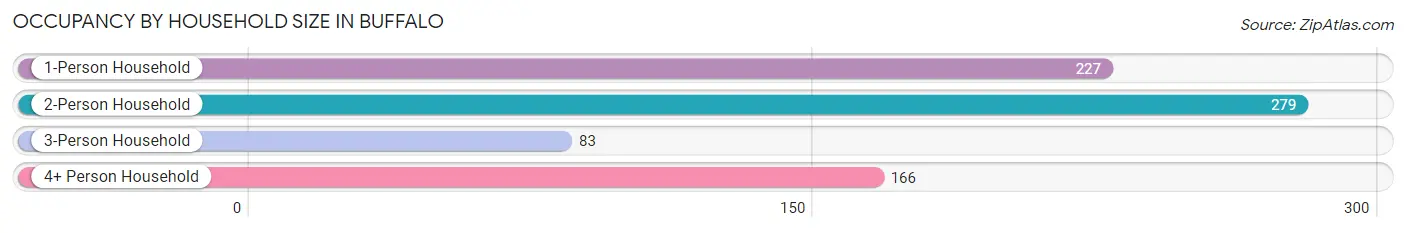
| Household Size | # Housing Units | % Housing Units |
| 1-Person Household | 227 | 30.1% |
| 2-Person Household | 279 | 36.9% |
| 3-Person Household | 83 | 11.0% |
| 4+ Person Household | 166 | 22.0% |
| Total Housing Units | 755 | 100.0% |
Occupancy by Ownership by Household Size in Buffalo
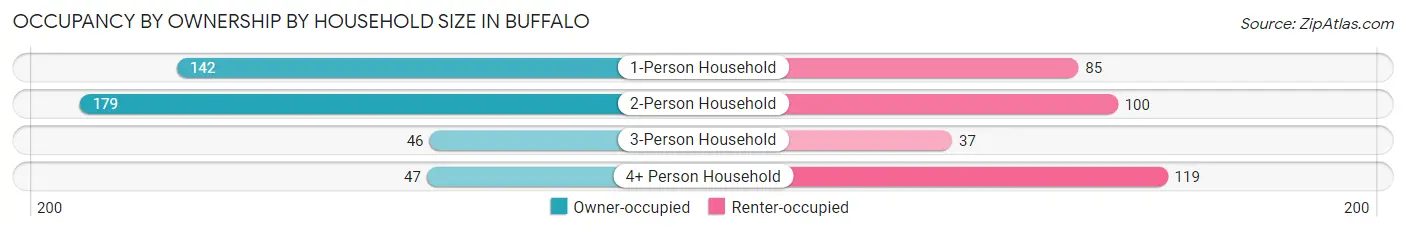
| Household Size | Owner-occupied | Renter-occupied |
| 1-Person Household | 142 (62.6%) | 85 (37.4%) |
| 2-Person Household | 179 (64.2%) | 100 (35.8%) |
| 3-Person Household | 46 (55.4%) | 37 (44.6%) |
| 4+ Person Household | 47 (28.3%) | 119 (71.7%) |
| Total Housing Units | 414 (54.8%) | 341 (45.2%) |
Occupancy by Educational Attainment in Buffalo
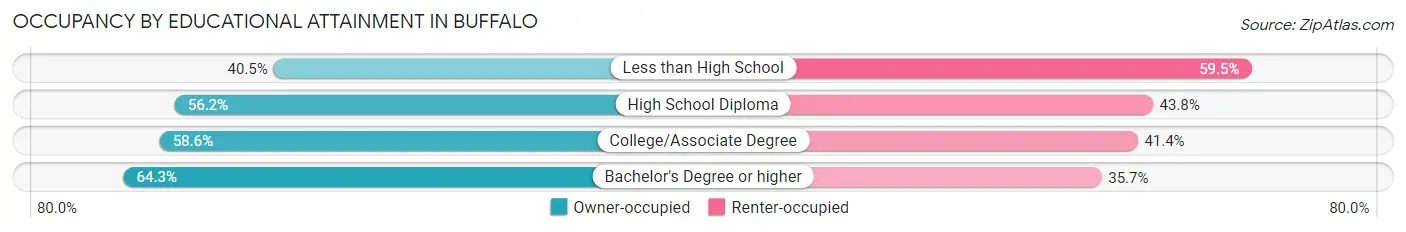
| Household Size | Owner-occupied | Renter-occupied |
| Less than High School | 47 (40.5%) | 69 (59.5%) |
| High School Diploma | 187 (56.2%) | 146 (43.8%) |
| College/Associate Degree | 171 (58.6%) | 121 (41.4%) |
| Bachelor's Degree or higher | 9 (64.3%) | 5 (35.7%) |
Occupancy by Age of Householder in Buffalo
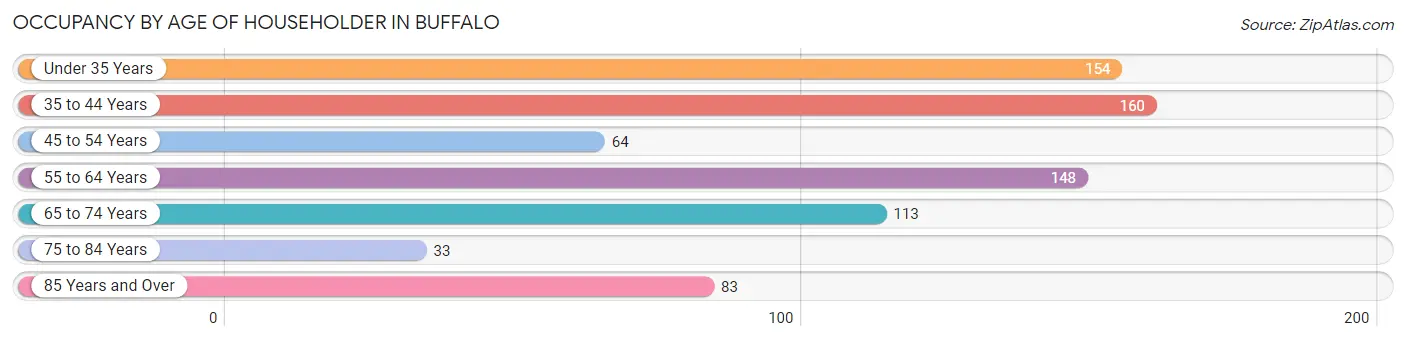
| Age Bracket | # Households | % Households |
| Under 35 Years | 154 | 20.4% |
| 35 to 44 Years | 160 | 21.2% |
| 45 to 54 Years | 64 | 8.5% |
| 55 to 64 Years | 148 | 19.6% |
| 65 to 74 Years | 113 | 15.0% |
| 75 to 84 Years | 33 | 4.4% |
| 85 Years and Over | 83 | 11.0% |
| Total | 755 | 100.0% |
Housing Finances in Buffalo
Median Income by Occupancy in Buffalo
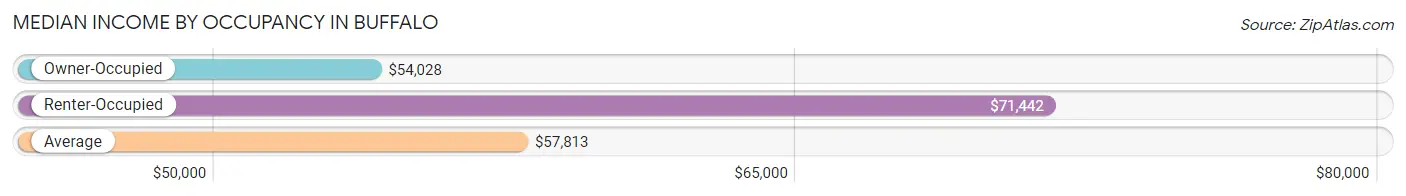
| Occupancy Type | # Households | Median Income |
| Owner-Occupied | 414 (54.8%) | $54,028 |
| Renter-Occupied | 341 (45.2%) | $71,442 |
| Average | 755 (100.0%) | $57,813 |
Occupancy by Householder Income Bracket in Buffalo
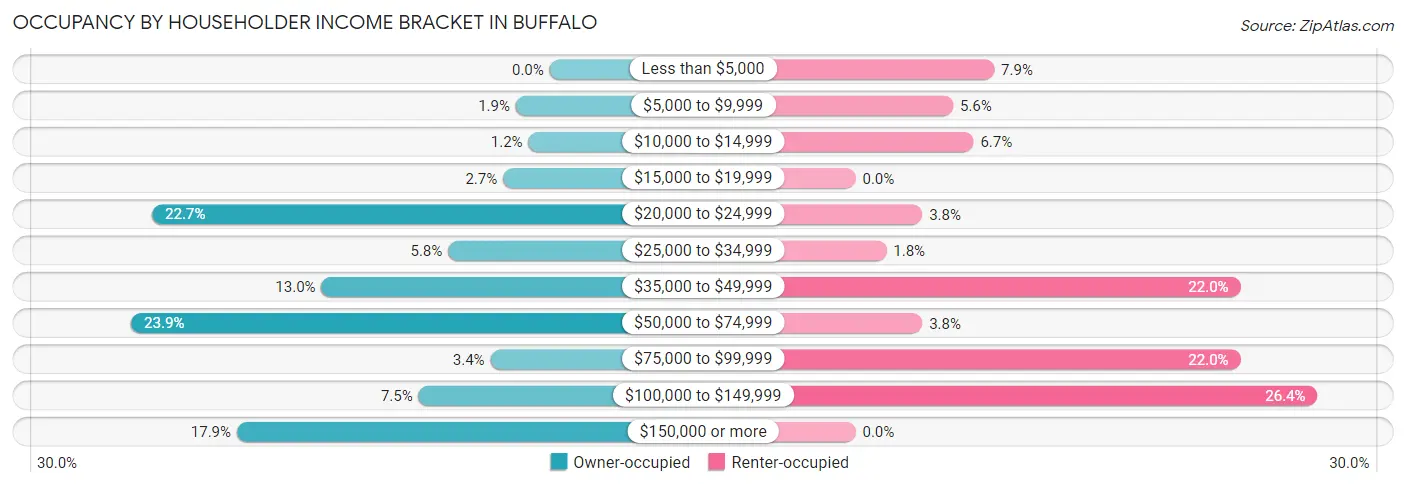
| Income Bracket | Owner-occupied | Renter-occupied |
| Less than $5,000 | 0 (0.0%) | 27 (7.9%) |
| $5,000 to $9,999 | 8 (1.9%) | 19 (5.6%) |
| $10,000 to $14,999 | 5 (1.2%) | 23 (6.7%) |
| $15,000 to $19,999 | 11 (2.7%) | 0 (0.0%) |
| $20,000 to $24,999 | 94 (22.7%) | 13 (3.8%) |
| $25,000 to $34,999 | 24 (5.8%) | 6 (1.8%) |
| $35,000 to $49,999 | 54 (13.0%) | 75 (22.0%) |
| $50,000 to $74,999 | 99 (23.9%) | 13 (3.8%) |
| $75,000 to $99,999 | 14 (3.4%) | 75 (22.0%) |
| $100,000 to $149,999 | 31 (7.5%) | 90 (26.4%) |
| $150,000 or more | 74 (17.9%) | 0 (0.0%) |
| Total | 414 (100.0%) | 341 (100.0%) |
Monthly Housing Cost Tiers in Buffalo
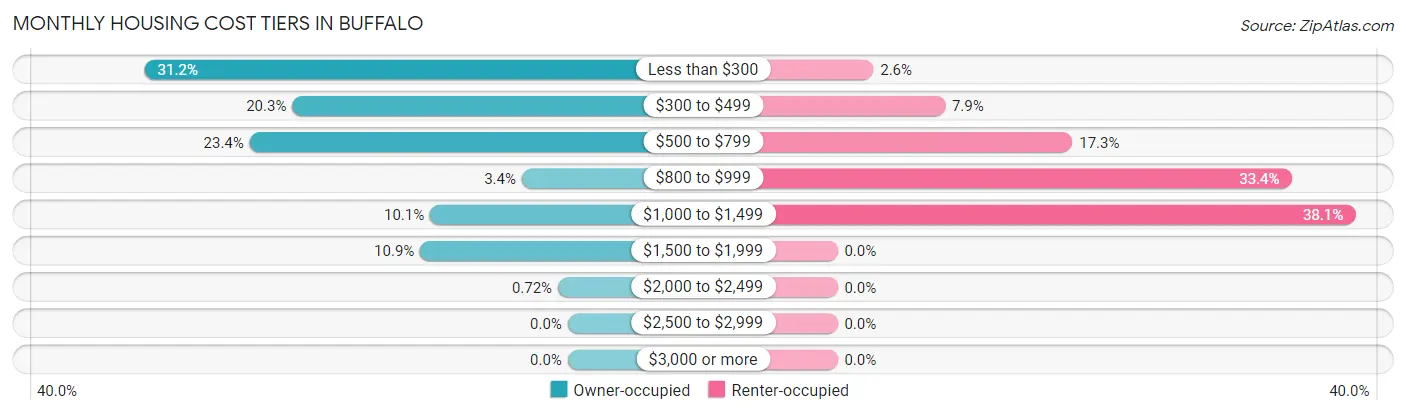
| Monthly Cost | Owner-occupied | Renter-occupied |
| Less than $300 | 129 (31.2%) | 9 (2.6%) |
| $300 to $499 | 84 (20.3%) | 27 (7.9%) |
| $500 to $799 | 97 (23.4%) | 59 (17.3%) |
| $800 to $999 | 14 (3.4%) | 114 (33.4%) |
| $1,000 to $1,499 | 42 (10.1%) | 130 (38.1%) |
| $1,500 to $1,999 | 45 (10.9%) | 0 (0.0%) |
| $2,000 to $2,499 | 3 (0.7%) | 0 (0.0%) |
| $2,500 to $2,999 | 0 (0.0%) | 0 (0.0%) |
| $3,000 or more | 0 (0.0%) | 0 (0.0%) |
| Total | 414 (100.0%) | 341 (100.0%) |
Physical Housing Characteristics in Buffalo
Housing Structures in Buffalo
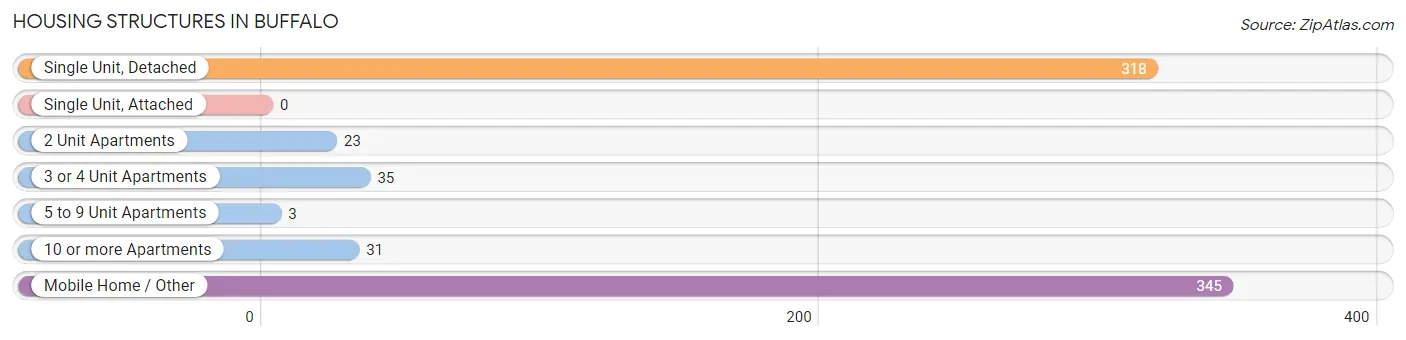
| Structure Type | # Housing Units | % Housing Units |
| Single Unit, Detached | 318 | 42.1% |
| Single Unit, Attached | 0 | 0.0% |
| 2 Unit Apartments | 23 | 3.0% |
| 3 or 4 Unit Apartments | 35 | 4.6% |
| 5 to 9 Unit Apartments | 3 | 0.4% |
| 10 or more Apartments | 31 | 4.1% |
| Mobile Home / Other | 345 | 45.7% |
| Total | 755 | 100.0% |
Housing Structures by Occupancy in Buffalo
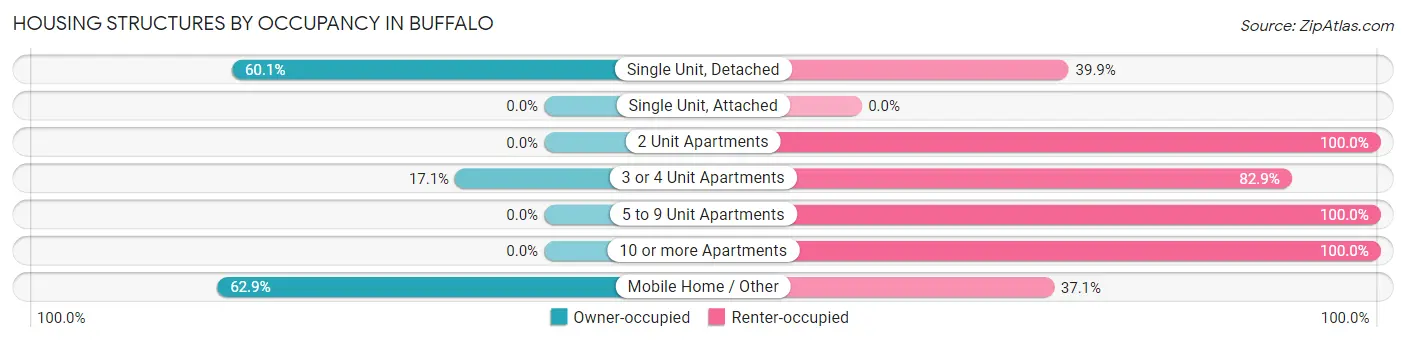
| Structure Type | Owner-occupied | Renter-occupied |
| Single Unit, Detached | 191 (60.1%) | 127 (39.9%) |
| Single Unit, Attached | 0 (0.0%) | 0 (0.0%) |
| 2 Unit Apartments | 0 (0.0%) | 23 (100.0%) |
| 3 or 4 Unit Apartments | 6 (17.1%) | 29 (82.9%) |
| 5 to 9 Unit Apartments | 0 (0.0%) | 3 (100.0%) |
| 10 or more Apartments | 0 (0.0%) | 31 (100.0%) |
| Mobile Home / Other | 217 (62.9%) | 128 (37.1%) |
| Total | 414 (54.8%) | 341 (45.2%) |
Housing Structures by Number of Rooms in Buffalo
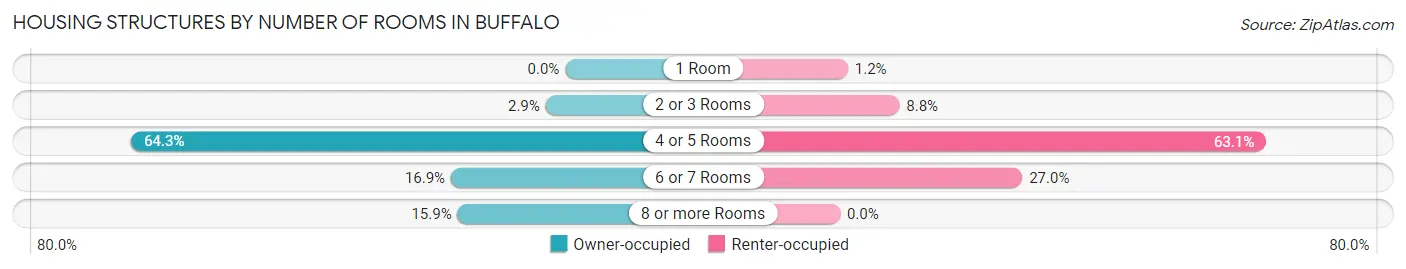
| Number of Rooms | Owner-occupied | Renter-occupied |
| 1 Room | 0 (0.0%) | 4 (1.2%) |
| 2 or 3 Rooms | 12 (2.9%) | 30 (8.8%) |
| 4 or 5 Rooms | 266 (64.2%) | 215 (63.0%) |
| 6 or 7 Rooms | 70 (16.9%) | 92 (27.0%) |
| 8 or more Rooms | 66 (15.9%) | 0 (0.0%) |
| Total | 414 (100.0%) | 341 (100.0%) |
Housing Structure by Heating Type in Buffalo
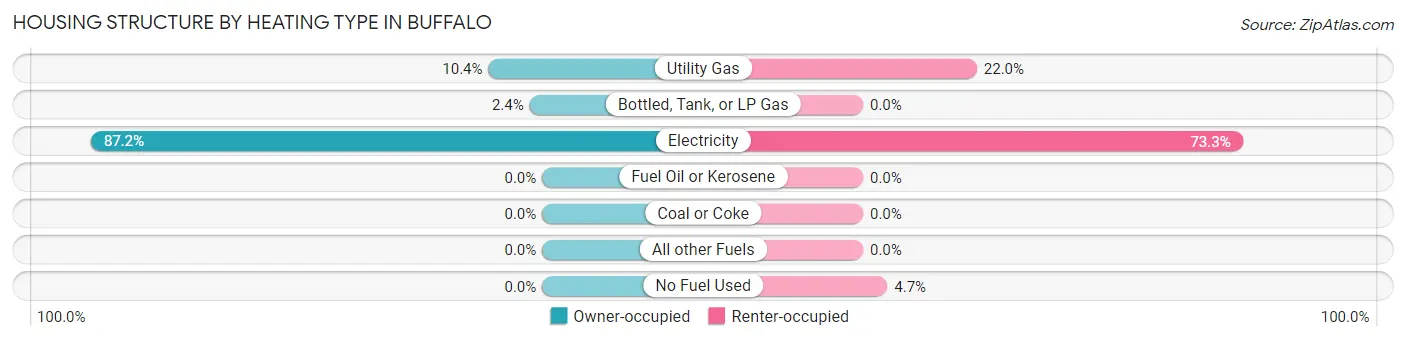
| Heating Type | Owner-occupied | Renter-occupied |
| Utility Gas | 43 (10.4%) | 75 (22.0%) |
| Bottled, Tank, or LP Gas | 10 (2.4%) | 0 (0.0%) |
| Electricity | 361 (87.2%) | 250 (73.3%) |
| Fuel Oil or Kerosene | 0 (0.0%) | 0 (0.0%) |
| Coal or Coke | 0 (0.0%) | 0 (0.0%) |
| All other Fuels | 0 (0.0%) | 0 (0.0%) |
| No Fuel Used | 0 (0.0%) | 16 (4.7%) |
| Total | 414 (100.0%) | 341 (100.0%) |
Household Vehicle Usage in Buffalo
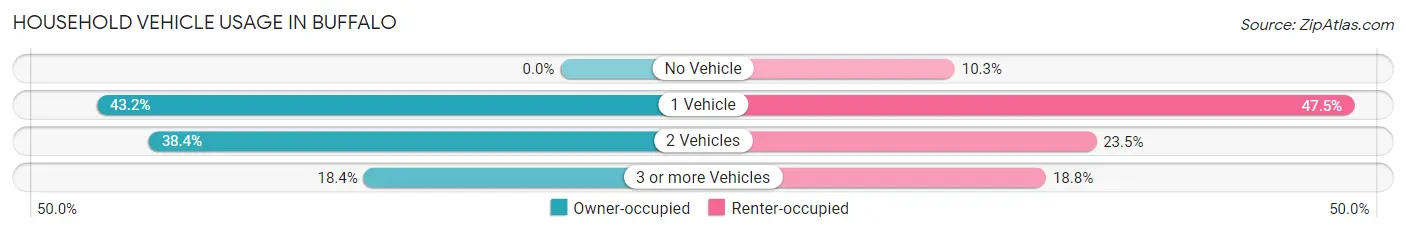
| Vehicles per Household | Owner-occupied | Renter-occupied |
| No Vehicle | 0 (0.0%) | 35 (10.3%) |
| 1 Vehicle | 179 (43.2%) | 162 (47.5%) |
| 2 Vehicles | 159 (38.4%) | 80 (23.5%) |
| 3 or more Vehicles | 76 (18.4%) | 64 (18.8%) |
| Total | 414 (100.0%) | 341 (100.0%) |
Real Estate & Mortgages in Buffalo
Real Estate and Mortgage Overview in Buffalo
| Characteristic | Without Mortgage | With Mortgage |
| Housing Units | 300 | 114 |
| Median Property Value | $57,600 | $154,000 |
| Median Household Income | $40,859 | $62 |
| Monthly Housing Costs | $386 | $0 |
| Real Estate Taxes | - | - |
Property Value by Mortgage Status in Buffalo
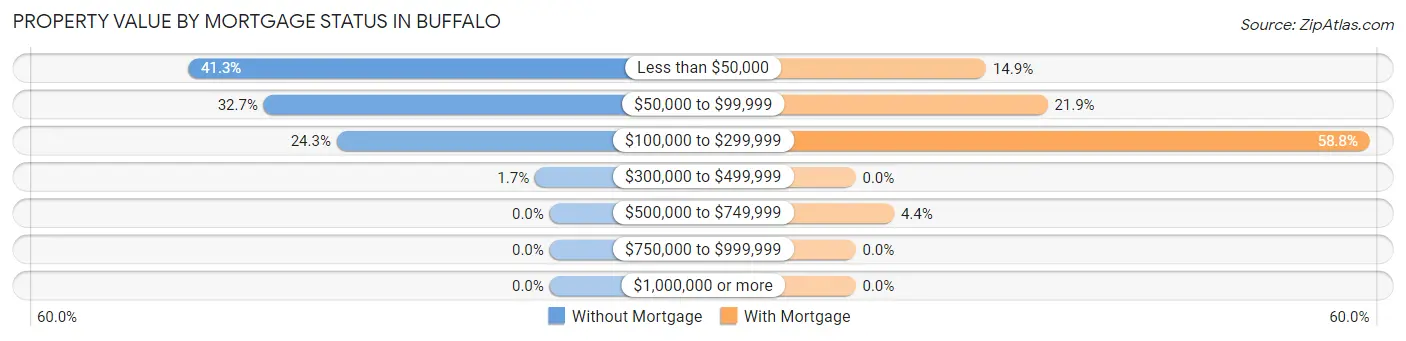
| Property Value | Without Mortgage | With Mortgage |
| Less than $50,000 | 124 (41.3%) | 17 (14.9%) |
| $50,000 to $99,999 | 98 (32.7%) | 25 (21.9%) |
| $100,000 to $299,999 | 73 (24.3%) | 67 (58.8%) |
| $300,000 to $499,999 | 5 (1.7%) | 0 (0.0%) |
| $500,000 to $749,999 | 0 (0.0%) | 5 (4.4%) |
| $750,000 to $999,999 | 0 (0.0%) | 0 (0.0%) |
| $1,000,000 or more | 0 (0.0%) | 0 (0.0%) |
| Total | 300 (100.0%) | 114 (100.0%) |
Household Income by Mortgage Status in Buffalo
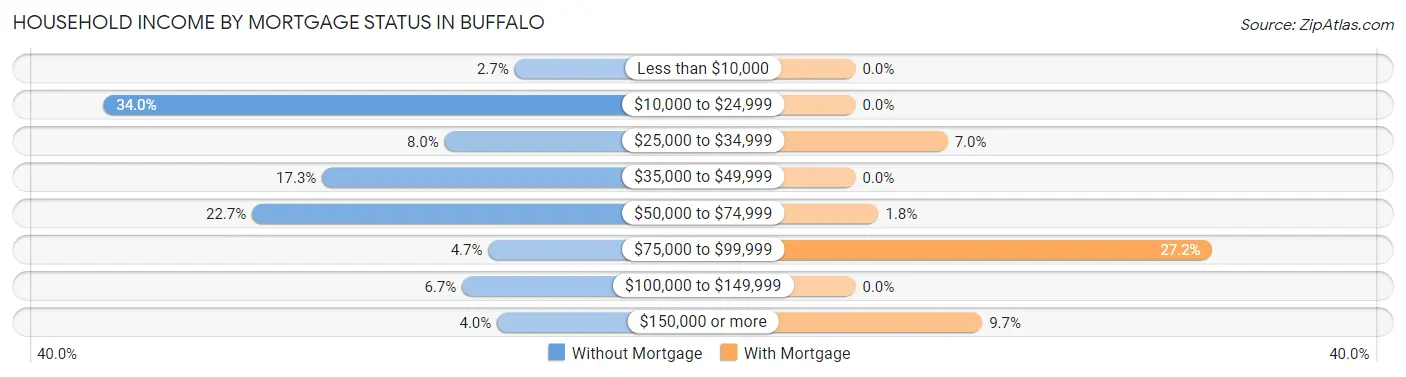
| Household Income | Without Mortgage | With Mortgage |
| Less than $10,000 | 8 (2.7%) | 0 (0.0%) |
| $10,000 to $24,999 | 102 (34.0%) | 0 (0.0%) |
| $25,000 to $34,999 | 24 (8.0%) | 8 (7.0%) |
| $35,000 to $49,999 | 52 (17.3%) | 0 (0.0%) |
| $50,000 to $74,999 | 68 (22.7%) | 2 (1.8%) |
| $75,000 to $99,999 | 14 (4.7%) | 31 (27.2%) |
| $100,000 to $149,999 | 20 (6.7%) | 0 (0.0%) |
| $150,000 or more | 12 (4.0%) | 11 (9.7%) |
| Total | 300 (100.0%) | 114 (100.0%) |
Property Value to Household Income Ratio in Buffalo
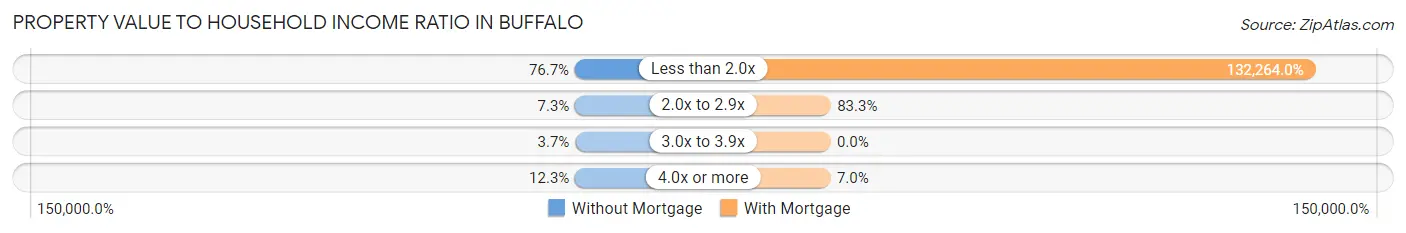
| Value-to-Income Ratio | Without Mortgage | With Mortgage |
| Less than 2.0x | 230 (76.7%) | 150,781 (132,264.0%) |
| 2.0x to 2.9x | 22 (7.3%) | 95 (83.3%) |
| 3.0x to 3.9x | 11 (3.7%) | 0 (0.0%) |
| 4.0x or more | 37 (12.3%) | 8 (7.0%) |
| Total | 300 (100.0%) | 114 (100.0%) |
Real Estate Taxes by Mortgage Status in Buffalo
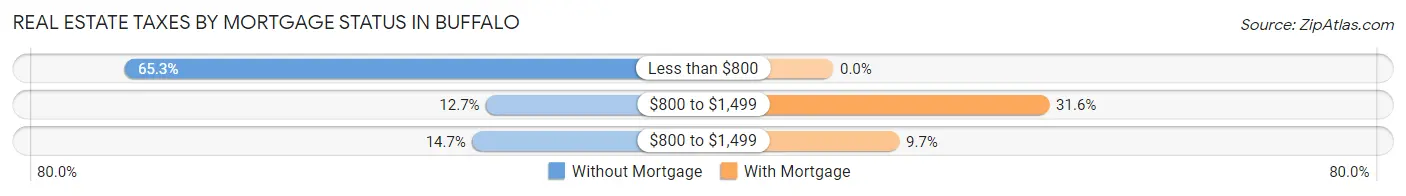
| Property Taxes | Without Mortgage | With Mortgage |
| Less than $800 | 196 (65.3%) | 0 (0.0%) |
| $800 to $1,499 | 38 (12.7%) | 36 (31.6%) |
| $800 to $1,499 | 44 (14.7%) | 11 (9.7%) |
| Total | 300 (100.0%) | 114 (100.0%) |
Health & Disability in Buffalo
Health Insurance Coverage by Age in Buffalo
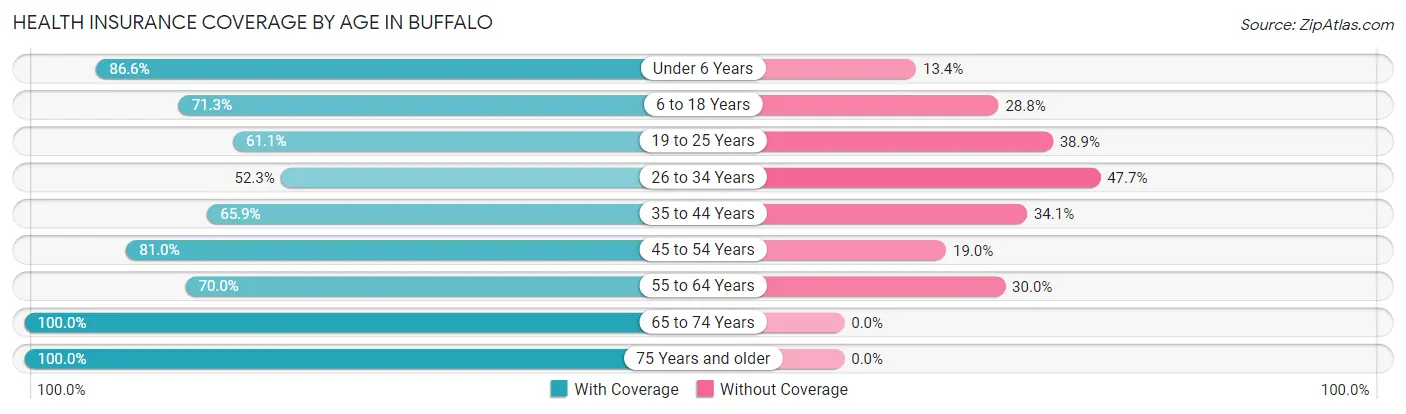
| Age Bracket | With Coverage | Without Coverage |
| Under 6 Years | 194 (86.6%) | 30 (13.4%) |
| 6 to 18 Years | 171 (71.3%) | 69 (28.7%) |
| 19 to 25 Years | 151 (61.1%) | 96 (38.9%) |
| 26 to 34 Years | 92 (52.3%) | 84 (47.7%) |
| 35 to 44 Years | 178 (65.9%) | 92 (34.1%) |
| 45 to 54 Years | 111 (81.0%) | 26 (19.0%) |
| 55 to 64 Years | 189 (70.0%) | 81 (30.0%) |
| 65 to 74 Years | 135 (100.0%) | 0 (0.0%) |
| 75 Years and older | 131 (100.0%) | 0 (0.0%) |
| Total | 1,352 (73.9%) | 478 (26.1%) |
Health Insurance Coverage by Citizenship Status in Buffalo
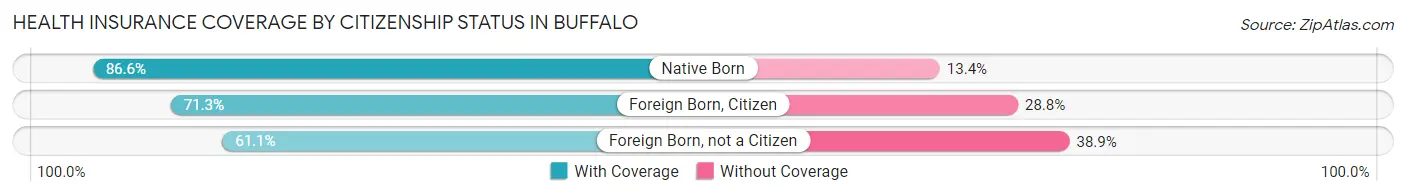
| Citizenship Status | With Coverage | Without Coverage |
| Native Born | 194 (86.6%) | 30 (13.4%) |
| Foreign Born, Citizen | 171 (71.3%) | 69 (28.7%) |
| Foreign Born, not a Citizen | 151 (61.1%) | 96 (38.9%) |
Health Insurance Coverage by Household Income in Buffalo
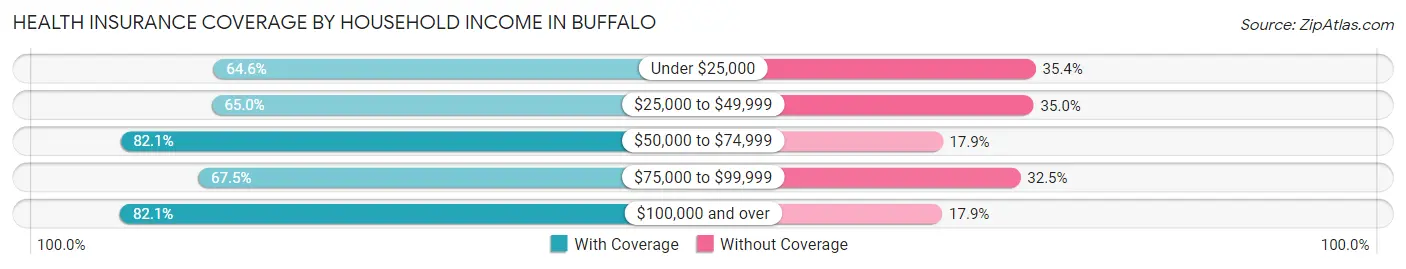
| Household Income | With Coverage | Without Coverage |
| Under $25,000 | 232 (64.6%) | 127 (35.4%) |
| $25,000 to $49,999 | 219 (65.0%) | 118 (35.0%) |
| $50,000 to $74,999 | 261 (82.1%) | 57 (17.9%) |
| $75,000 to $99,999 | 139 (67.5%) | 67 (32.5%) |
| $100,000 and over | 501 (82.1%) | 109 (17.9%) |
Public vs Private Health Insurance Coverage by Age in Buffalo
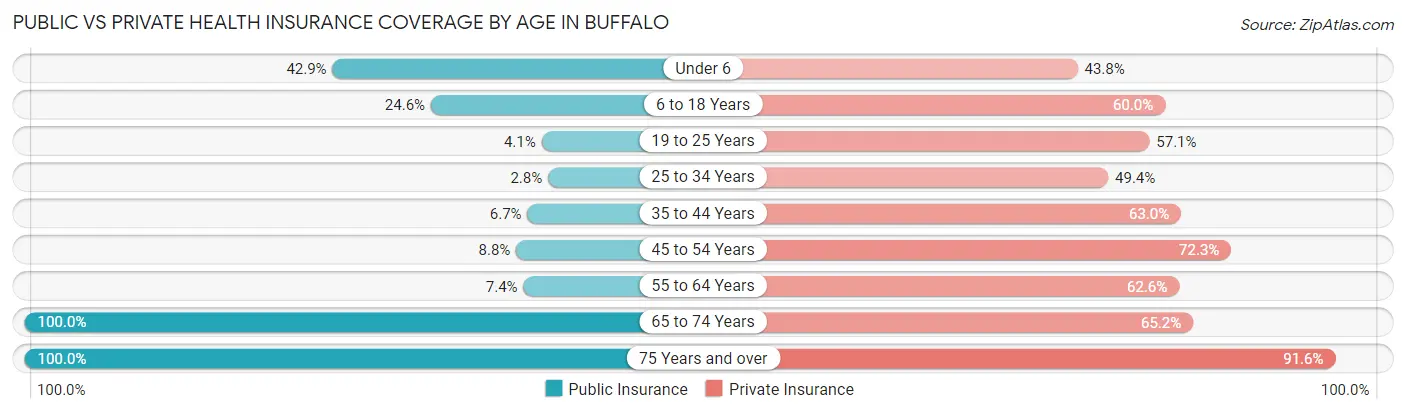
| Age Bracket | Public Insurance | Private Insurance |
| Under 6 | 96 (42.9%) | 98 (43.8%) |
| 6 to 18 Years | 59 (24.6%) | 144 (60.0%) |
| 19 to 25 Years | 10 (4.1%) | 141 (57.1%) |
| 25 to 34 Years | 5 (2.8%) | 87 (49.4%) |
| 35 to 44 Years | 18 (6.7%) | 170 (63.0%) |
| 45 to 54 Years | 12 (8.8%) | 99 (72.3%) |
| 55 to 64 Years | 20 (7.4%) | 169 (62.6%) |
| 65 to 74 Years | 135 (100.0%) | 88 (65.2%) |
| 75 Years and over | 131 (100.0%) | 120 (91.6%) |
| Total | 486 (26.6%) | 1,116 (61.0%) |
Disability Status by Sex by Age in Buffalo
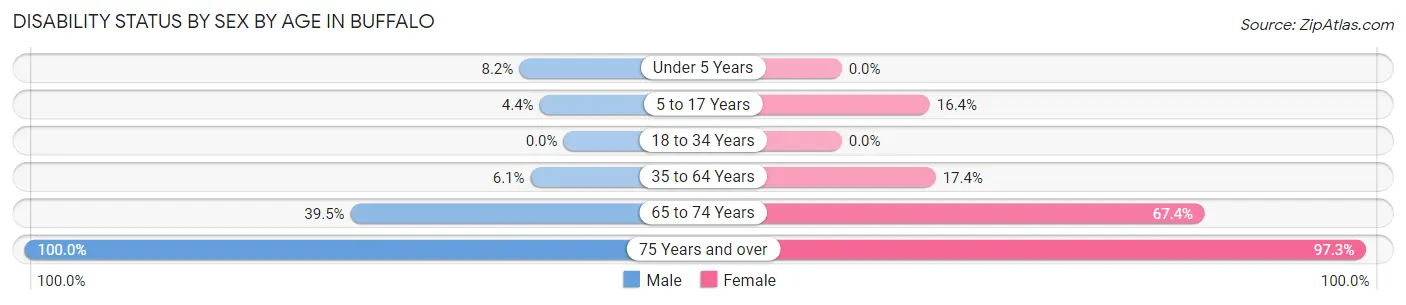
| Age Bracket | Male | Female |
| Under 5 Years | 11 (8.2%) | 0 (0.0%) |
| 5 to 17 Years | 6 (4.4%) | 17 (16.4%) |
| 18 to 34 Years | 0 (0.0%) | 0 (0.0%) |
| 35 to 64 Years | 20 (6.1%) | 61 (17.4%) |
| 65 to 74 Years | 17 (39.5%) | 62 (67.4%) |
| 75 Years and over | 20 (100.0%) | 108 (97.3%) |
Disability Class by Sex by Age in Buffalo
Disability Class: Hearing Difficulty
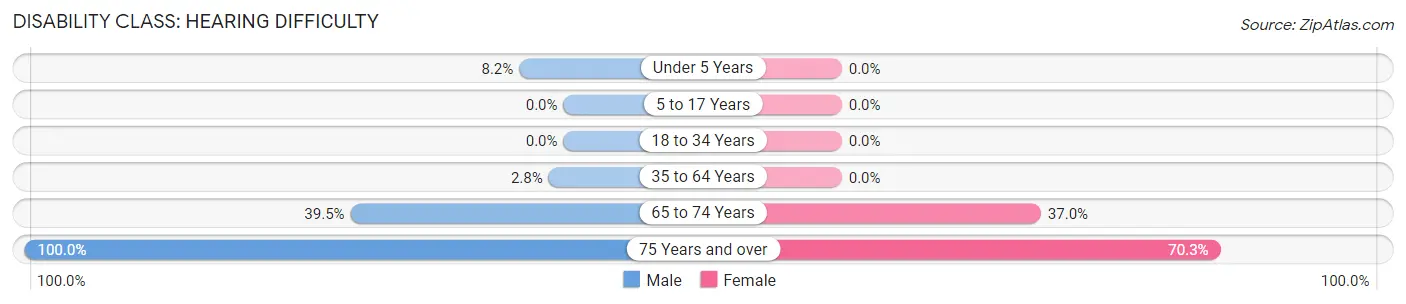
| Age Bracket | Male | Female |
| Under 5 Years | 11 (8.2%) | 0 (0.0%) |
| 5 to 17 Years | 0 (0.0%) | 0 (0.0%) |
| 18 to 34 Years | 0 (0.0%) | 0 (0.0%) |
| 35 to 64 Years | 9 (2.8%) | 0 (0.0%) |
| 65 to 74 Years | 17 (39.5%) | 34 (37.0%) |
| 75 Years and over | 20 (100.0%) | 78 (70.3%) |
Disability Class: Vision Difficulty
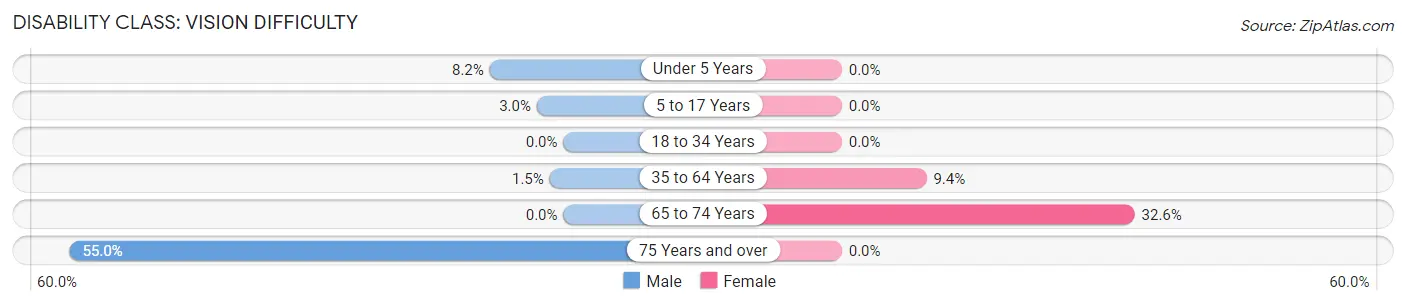
| Age Bracket | Male | Female |
| Under 5 Years | 11 (8.2%) | 0 (0.0%) |
| 5 to 17 Years | 4 (3.0%) | 0 (0.0%) |
| 18 to 34 Years | 0 (0.0%) | 0 (0.0%) |
| 35 to 64 Years | 5 (1.5%) | 33 (9.4%) |
| 65 to 74 Years | 0 (0.0%) | 30 (32.6%) |
| 75 Years and over | 11 (55.0%) | 0 (0.0%) |
Disability Class: Cognitive Difficulty
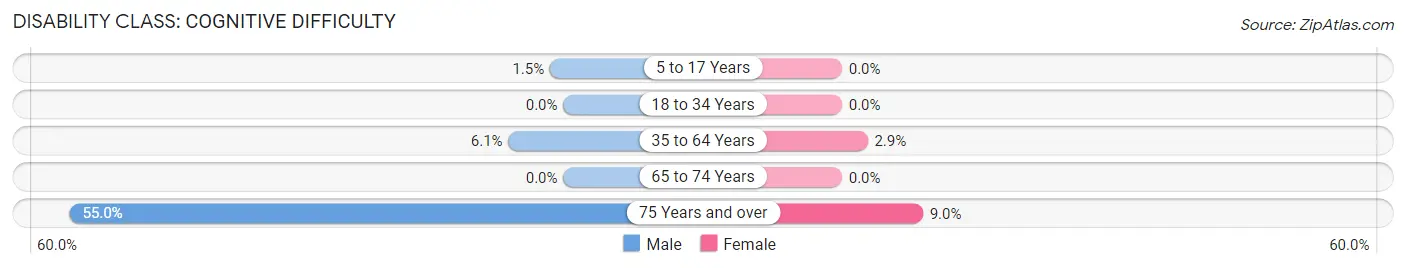
| Age Bracket | Male | Female |
| 5 to 17 Years | 2 (1.5%) | 0 (0.0%) |
| 18 to 34 Years | 0 (0.0%) | 0 (0.0%) |
| 35 to 64 Years | 20 (6.1%) | 10 (2.9%) |
| 65 to 74 Years | 0 (0.0%) | 0 (0.0%) |
| 75 Years and over | 11 (55.0%) | 10 (9.0%) |
Disability Class: Ambulatory Difficulty
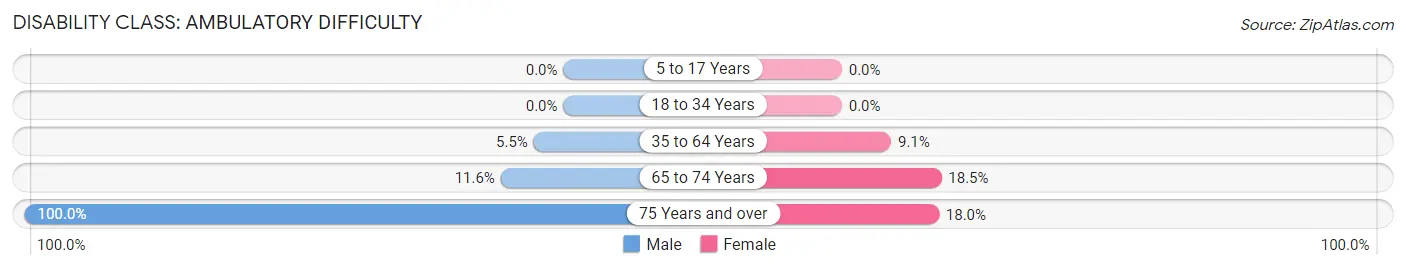
| Age Bracket | Male | Female |
| 5 to 17 Years | 0 (0.0%) | 0 (0.0%) |
| 18 to 34 Years | 0 (0.0%) | 0 (0.0%) |
| 35 to 64 Years | 18 (5.5%) | 32 (9.1%) |
| 65 to 74 Years | 5 (11.6%) | 17 (18.5%) |
| 75 Years and over | 20 (100.0%) | 20 (18.0%) |
Disability Class: Self-Care Difficulty
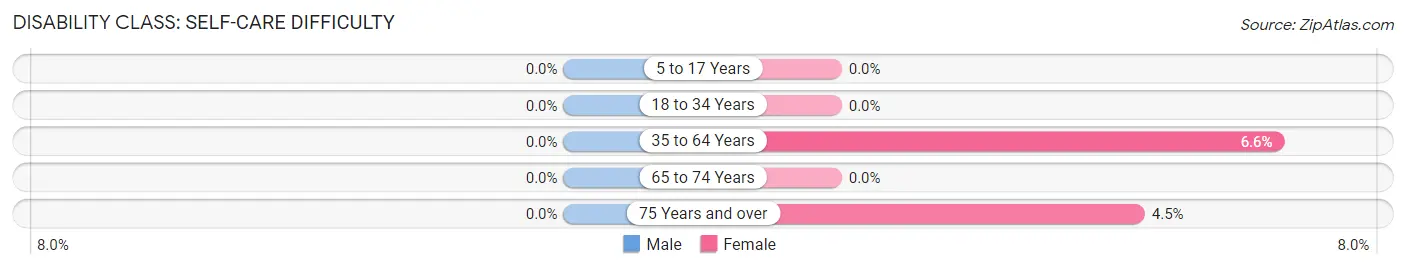
| Age Bracket | Male | Female |
| 5 to 17 Years | 0 (0.0%) | 0 (0.0%) |
| 18 to 34 Years | 0 (0.0%) | 0 (0.0%) |
| 35 to 64 Years | 0 (0.0%) | 23 (6.6%) |
| 65 to 74 Years | 0 (0.0%) | 0 (0.0%) |
| 75 Years and over | 0 (0.0%) | 5 (4.5%) |
Technology Access in Buffalo
Computing Device Access in Buffalo
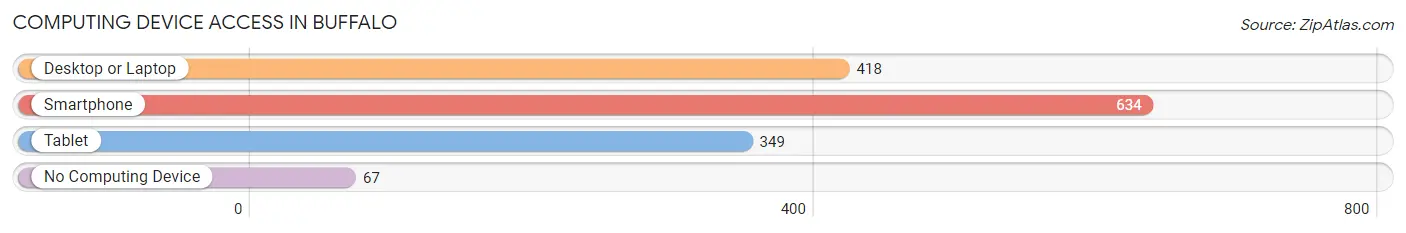
| Device Type | # Households | % Households |
| Desktop or Laptop | 418 | 55.4% |
| Smartphone | 634 | 84.0% |
| Tablet | 349 | 46.2% |
| No Computing Device | 67 | 8.9% |
| Total | 755 | 100.0% |
Internet Access in Buffalo
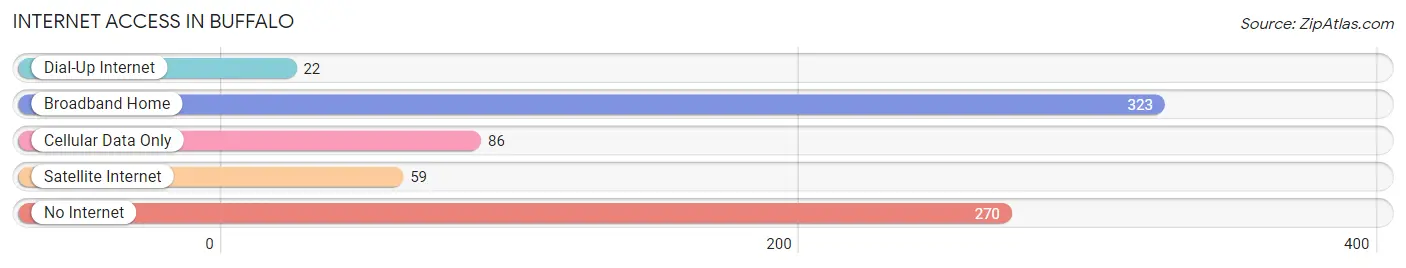
| Internet Type | # Households | % Households |
| Dial-Up Internet | 22 | 2.9% |
| Broadband Home | 323 | 42.8% |
| Cellular Data Only | 86 | 11.4% |
| Satellite Internet | 59 | 7.8% |
| No Internet | 270 | 35.8% |
| Total | 755 | 100.0% |
Buffalo Summary
Buffalo, Texas is a small town located in Leon County, Texas, United States. It is situated on the banks of the Buffalo Creek, a tributary of the Trinity River. The town was founded in 1854 and is the county seat of Leon County. The population of Buffalo was 1,845 at the 2010 census.
History
Buffalo was founded in 1854 by a group of settlers from Tennessee. The town was named after the nearby Buffalo Creek, which was named for the large number of buffalo that roamed the area. The town was originally located on the east side of the creek, but was moved to the west side in 1856.
In 1858, the Leon County Courthouse was built in Buffalo, and the town became the county seat. The town grew rapidly in the late 19th century, and by 1900, it had a population of 1,092.
In the early 20th century, Buffalo was a center of the cotton industry. The town had several cotton gins, and the local economy was largely dependent on the cotton industry.
Geography
Buffalo is located in Leon County, Texas, at the intersection of State Highway 7 and U.S. Highway 79. The town is situated on the banks of the Buffalo Creek, a tributary of the Trinity River. The town is located approximately 80 miles northeast of Austin and 90 miles south of Dallas.
The climate in Buffalo is hot and humid in the summer, with temperatures reaching into the 90s, and mild in the winter, with temperatures rarely dropping below freezing. The average annual precipitation is approximately 35 inches.
Economy
The economy of Buffalo is largely based on agriculture. The town is home to several cotton gins, and the local economy is largely dependent on the cotton industry. Other industries in the area include oil and gas production, ranching, and timber production.
The town also has a small retail sector, with several stores and restaurants. The town is also home to a small airport, which serves the local area.
Demographics
As of the 2010 census, the population of Buffalo was 1,845. The racial makeup of the town was 79.3% White, 17.2% African American, 0.7% Native American, 0.3% Asian, 0.1% Pacific Islander, and 2.4% from other races. Hispanic or Latino of any race were 4.2% of the population.
The median household income in Buffalo was $31,250, and the median family income was $37,500. The per capita income was $17,845. About 17.2% of the population was below the poverty line.
Conclusion
Buffalo, Texas is a small town located in Leon County, Texas, United States. It was founded in 1854 and is the county seat of Leon County. The town is situated on the banks of the Buffalo Creek, a tributary of the Trinity River. The economy of Buffalo is largely based on agriculture, with the local economy largely dependent on the cotton industry. The population of Buffalo was 1,845 at the 2010 census.
Common Questions
What is Per Capita Income in Buffalo?
Per Capita income in Buffalo is $32,085.
What is the Median Family Income in Buffalo?
Median Family Income in Buffalo is $72,232.
What is the Median Household income in Buffalo?
Median Household Income in Buffalo is $57,813.
What is Income or Wage Gap in Buffalo?
Income or Wage Gap in Buffalo is 48.0%.
Women in Buffalo earn 52.0 cents for every dollar earned by a man.
What is Inequality or Gini Index in Buffalo?
Inequality or Gini Index in Buffalo is 0.48.
What is the Total Population of Buffalo?
Total Population of Buffalo is 1,838.
What is the Total Male Population of Buffalo?
Total Male Population of Buffalo is 846.
What is the Total Female Population of Buffalo?
Total Female Population of Buffalo is 992.
What is the Ratio of Males per 100 Females in Buffalo?
There are 85.28 Males per 100 Females in Buffalo.
What is the Ratio of Females per 100 Males in Buffalo?
There are 117.26 Females per 100 Males in Buffalo.
What is the Median Population Age in Buffalo?
Median Population Age in Buffalo is 36.4 Years.
What is the Average Family Size in Buffalo
Average Family Size in Buffalo is 3.1 People.
What is the Average Household Size in Buffalo
Average Household Size in Buffalo is 2.4 People.
How Large is the Labor Force in Buffalo?
There are 809 People in the Labor Forcein in Buffalo.
What is the Percentage of People in the Labor Force in Buffalo?
56.7% of People are in the Labor Force in Buffalo.
What is the Unemployment Rate in Buffalo?
Unemployment Rate in Buffalo is 10.9%.