Zip Codes with the Highest Percentage of Population Employed in Education Instruction & Library in San Antonio, TX
RELATED REPORTS & OPTIONS
Education Instruction & Library
San Antonio
Compare Zip Codes
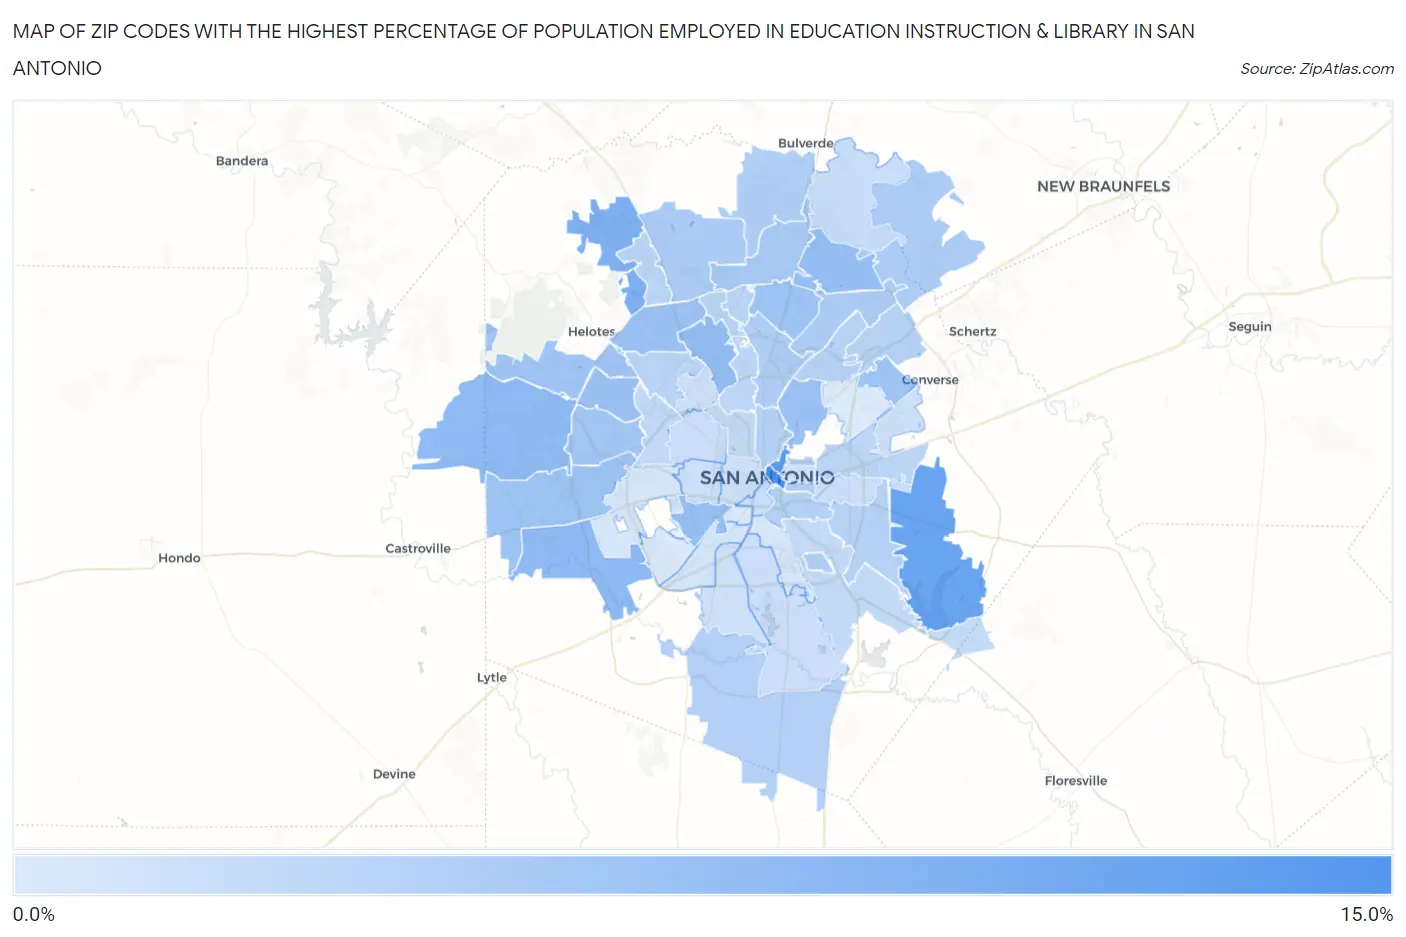
Map of Zip Codes with the Highest Percentage of Population Employed in Education Instruction & Library in San Antonio
2.7%
14.9%
Zip Codes with the Highest Percentage of Population Employed in Education Instruction & Library in San Antonio, TX
| Zip Code | % Employed | vs State | vs National | |
| 1. | 78205 | 14.9% | 6.4%(+8.49)#85 | 6.2%(+8.67)#1,309 |
| 2. | 78215 | 12.8% | 6.4%(+6.45)#126 | 6.2%(+6.63)#1,971 |
| 3. | 78263 | 11.9% | 6.4%(+5.52)#158 | 6.2%(+5.70)#2,457 |
| 4. | 78255 | 10.3% | 6.4%(+3.92)#238 | 6.2%(+4.10)#3,662 |
| 5. | 78253 | 9.0% | 6.4%(+2.60)#358 | 6.2%(+2.78)#5,286 |
| 6. | 78252 | 8.9% | 6.4%(+2.54)#370 | 6.2%(+2.72)#5,383 |
| 7. | 78230 | 8.5% | 6.4%(+2.11)#408 | 6.2%(+2.30)#6,136 |
| 8. | 78259 | 8.4% | 6.4%(+2.01)#423 | 6.2%(+2.19)#6,342 |
| 9. | 78226 | 8.1% | 6.4%(+1.70)#471 | 6.2%(+1.89)#7,000 |
| 10. | 78250 | 8.0% | 6.4%(+1.63)#479 | 6.2%(+1.81)#7,175 |
| 11. | 78209 | 8.0% | 6.4%(+1.61)#483 | 6.2%(+1.79)#7,218 |
| 12. | 78249 | 7.9% | 6.4%(+1.49)#498 | 6.2%(+1.67)#7,489 |
| 13. | 78245 | 7.6% | 6.4%(+1.26)#535 | 6.2%(+1.44)#8,108 |
| 14. | 78239 | 7.6% | 6.4%(+1.24)#540 | 6.2%(+1.42)#8,162 |
| 15. | 78232 | 7.6% | 6.4%(+1.21)#547 | 6.2%(+1.39)#8,241 |
| 16. | 78254 | 7.5% | 6.4%(+1.10)#559 | 6.2%(+1.29)#8,505 |
| 17. | 78251 | 7.2% | 6.4%(+0.855)#621 | 6.2%(+1.04)#9,240 |
| 18. | 78258 | 6.9% | 6.4%(+0.512)#687 | 6.2%(+0.695)#10,304 |
| 19. | 78257 | 6.7% | 6.4%(+0.377)#723 | 6.2%(+0.560)#10,759 |
| 20. | 78247 | 6.5% | 6.4%(+0.182)#755 | 6.2%(+0.364)#11,447 |
| 21. | 78266 | 6.5% | 6.4%(+0.179)#757 | 6.2%(+0.361)#11,461 |
| 22. | 78203 | 6.3% | 6.4%(-0.061)#806 | 6.2%(+0.121)#12,345 |
| 23. | 78216 | 6.2% | 6.4%(-0.123)#822 | 6.2%(+0.060)#12,607 |
| 24. | 78235 | 6.2% | 6.4%(-0.191)#836 | 6.2%(-0.008)#12,859 |
| 25. | 78260 | 6.1% | 6.4%(-0.250)#849 | 6.2%(-0.068)#13,064 |
| 26. | 78264 | 6.0% | 6.4%(-0.342)#875 | 6.2%(-0.160)#13,400 |
| 27. | 78210 | 6.0% | 6.4%(-0.353)#880 | 6.2%(-0.171)#13,447 |
| 28. | 78212 | 6.0% | 6.4%(-0.406)#893 | 6.2%(-0.224)#13,657 |
| 29. | 78208 | 5.9% | 6.4%(-0.453)#902 | 6.2%(-0.271)#13,829 |
| 30. | 78217 | 5.8% | 6.4%(-0.542)#926 | 6.2%(-0.360)#14,218 |
| 31. | 78233 | 5.8% | 6.4%(-0.593)#940 | 6.2%(-0.411)#14,433 |
| 32. | 78222 | 5.7% | 6.4%(-0.675)#954 | 6.2%(-0.493)#14,780 |
| 33. | 78248 | 5.5% | 6.4%(-0.911)#1,004 | 6.2%(-0.729)#15,740 |
| 34. | 78231 | 5.4% | 6.4%(-0.952)#1,022 | 6.2%(-0.770)#15,929 |
| 35. | 78240 | 5.4% | 6.4%(-1.00)#1,042 | 6.2%(-0.822)#16,136 |
| 36. | 78256 | 5.2% | 6.4%(-1.13)#1,080 | 6.2%(-0.946)#16,644 |
| 37. | 78213 | 5.2% | 6.4%(-1.15)#1,084 | 6.2%(-0.967)#16,716 |
| 38. | 78219 | 5.1% | 6.4%(-1.22)#1,099 | 6.2%(-1.04)#17,022 |
| 39. | 78238 | 4.9% | 6.4%(-1.42)#1,142 | 6.2%(-1.24)#17,872 |
| 40. | 78201 | 4.7% | 6.4%(-1.62)#1,181 | 6.2%(-1.43)#18,720 |
| 41. | 78223 | 4.6% | 6.4%(-1.77)#1,217 | 6.2%(-1.59)#19,346 |
| 42. | 78261 | 4.3% | 6.4%(-2.11)#1,292 | 6.2%(-1.93)#20,699 |
| 43. | 78204 | 4.2% | 6.4%(-2.12)#1,295 | 6.2%(-1.94)#20,744 |
| 44. | 78221 | 4.2% | 6.4%(-2.18)#1,306 | 6.2%(-2.00)#20,960 |
| 45. | 78228 | 4.1% | 6.4%(-2.24)#1,313 | 6.2%(-2.05)#21,175 |
| 46. | 78220 | 4.1% | 6.4%(-2.29)#1,327 | 6.2%(-2.11)#21,388 |
| 47. | 78207 | 4.0% | 6.4%(-2.36)#1,347 | 6.2%(-2.18)#21,647 |
| 48. | 78229 | 4.0% | 6.4%(-2.38)#1,352 | 6.2%(-2.20)#21,718 |
| 49. | 78237 | 3.9% | 6.4%(-2.49)#1,372 | 6.2%(-2.31)#22,118 |
| 50. | 78244 | 3.9% | 6.4%(-2.51)#1,378 | 6.2%(-2.33)#22,182 |
| 51. | 78202 | 3.8% | 6.4%(-2.54)#1,383 | 6.2%(-2.36)#22,321 |
| 52. | 78224 | 3.8% | 6.4%(-2.57)#1,386 | 6.2%(-2.39)#22,394 |
| 53. | 78211 | 3.4% | 6.4%(-2.93)#1,454 | 6.2%(-2.74)#23,550 |
| 54. | 78214 | 3.3% | 6.4%(-3.07)#1,478 | 6.2%(-2.89)#24,031 |
| 55. | 78227 | 3.2% | 6.4%(-3.16)#1,501 | 6.2%(-2.98)#24,341 |
| 56. | 78225 | 3.0% | 6.4%(-3.37)#1,519 | 6.2%(-3.19)#24,857 |
| 57. | 78242 | 2.9% | 6.4%(-3.47)#1,524 | 6.2%(-3.29)#25,066 |
| 58. | 78218 | 2.7% | 6.4%(-3.65)#1,550 | 6.2%(-3.47)#25,496 |
1
Common Questions
What are the Top 10 Zip Codes with the Highest Percentage of Population Employed in Education Instruction & Library in San Antonio, TX?
Top 10 Zip Codes with the Highest Percentage of Population Employed in Education Instruction & Library in San Antonio, TX are:
What zip code has the Highest Percentage of Population Employed in Education Instruction & Library in San Antonio, TX?
78205 has the Highest Percentage of Population Employed in Education Instruction & Library in San Antonio, TX with 14.9%.
What is the Percentage of Population Employed in Education Instruction & Library in San Antonio, TX?
Percentage of Population Employed in Education Instruction & Library in San Antonio is 5.8%.
What is the Percentage of Population Employed in Education Instruction & Library in Texas?
Percentage of Population Employed in Education Instruction & Library in Texas is 6.4%.
What is the Percentage of Population Employed in Education Instruction & Library in the United States?
Percentage of Population Employed in Education Instruction & Library in the United States is 6.2%.