Trenton, TX Map & Demographics
Trenton Map
Trenton Overview
$31,046
PER CAPITA INCOME
$73,533
AVG FAMILY INCOME
$62,857
AVG HOUSEHOLD INCOME
4.3%
WAGE / INCOME GAP [ % ]
95.7¢/ $1
WAGE / INCOME GAP [ $ ]
$8,757
FAMILY INCOME DEFICIT
0.40
INEQUALITY / GINI INDEX
636
TOTAL POPULATION
300
MALE POPULATION
336
FEMALE POPULATION
89.29
MALES / 100 FEMALES
112.00
FEMALES / 100 MALES
41.0
MEDIAN AGE
3.1
AVG FAMILY SIZE
2.5
AVG HOUSEHOLD SIZE
334
LABOR FORCE [ PEOPLE ]
62.3%
PERCENT IN LABOR FORCE
Trenton Zip Codes
Income in Trenton
Income Overview in Trenton
Per Capita Income in Trenton is $31,046, while median incomes of families and households are $73,533 and $62,857 respectively.
| Characteristic | Number | Measure |
| Per Capita Income | 636 | $31,046 |
| Median Family Income | 171 | $73,533 |
| Mean Family Income | 171 | $85,532 |
| Median Household Income | 256 | $62,857 |
| Mean Household Income | 256 | $74,979 |
| Income Deficit | 171 | $8,757 |
| Wage / Income Gap (%) | 636 | 4.27% |
| Wage / Income Gap ($) | 636 | 95.73¢ per $1 |
| Gini / Inequality Index | 636 | 0.40 |
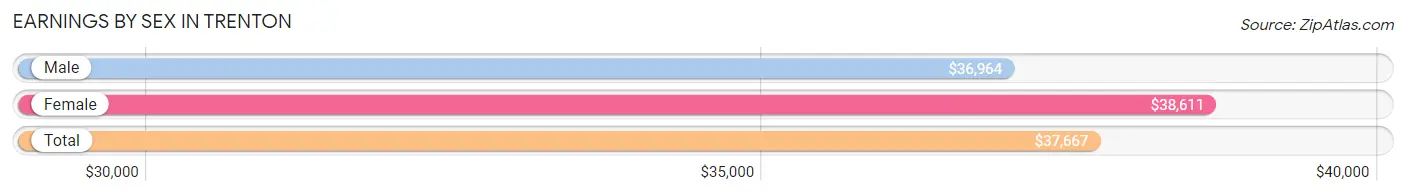
Earnings by Sex in Trenton
Average Earnings in Trenton are $37,667, $36,964 for men and $38,611 for women, a difference of 4.3%.
| Sex | Number | Average Earnings |
| Male | 200 (57.5%) | $36,964 |
| Female | 148 (42.5%) | $38,611 |
| Total | 348 (100.0%) | $37,667 |
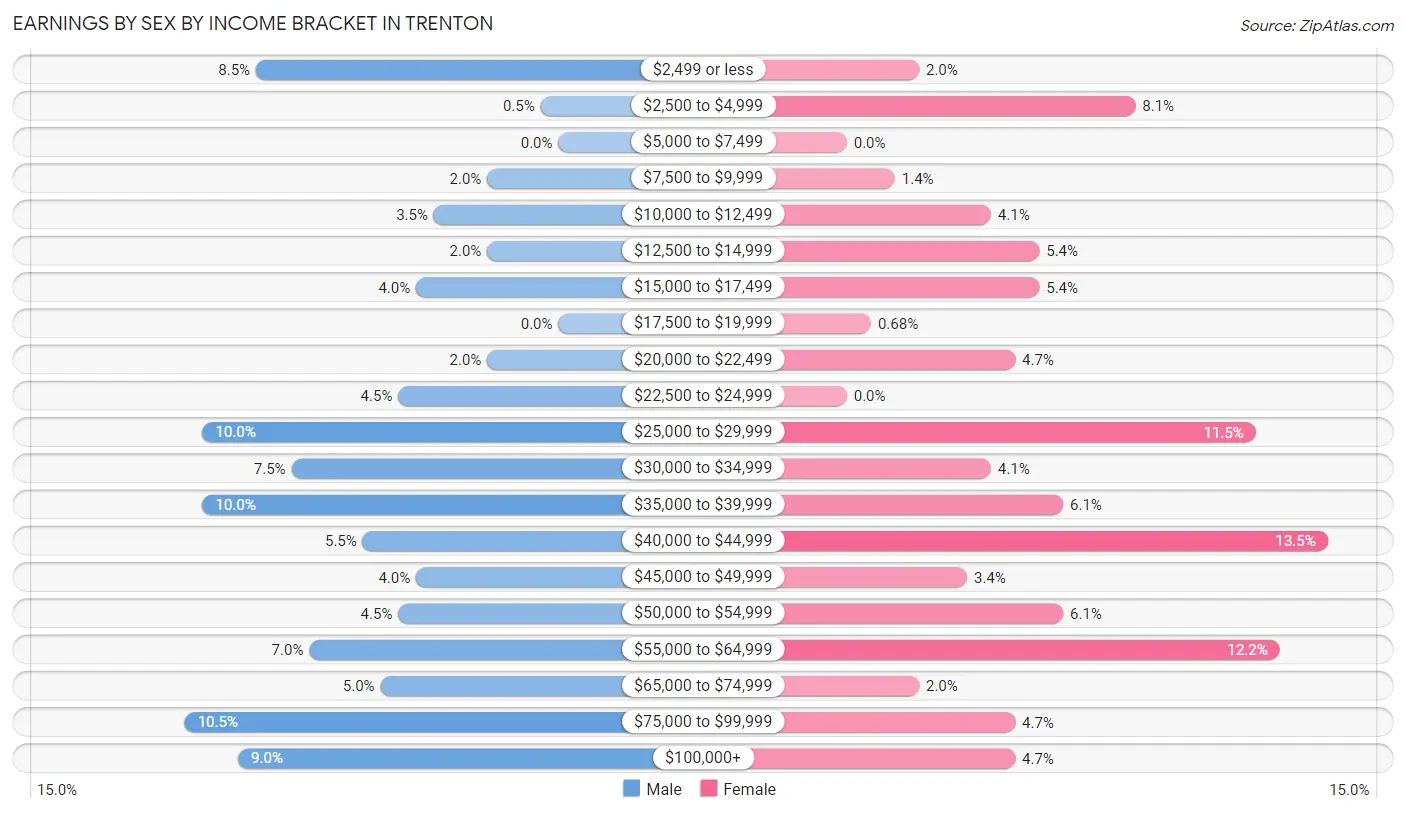
Earnings by Sex by Income Bracket in Trenton
The most common earnings brackets in Trenton are $75,000 to $99,999 for men (21 | 10.5%) and $40,000 to $44,999 for women (20 | 13.5%).
| Income | Male | Female |
| $2,499 or less | 17 (8.5%) | 3 (2.0%) |
| $2,500 to $4,999 | 1 (0.5%) | 12 (8.1%) |
| $5,000 to $7,499 | 0 (0.0%) | 0 (0.0%) |
| $7,500 to $9,999 | 4 (2.0%) | 2 (1.3%) |
| $10,000 to $12,499 | 7 (3.5%) | 6 (4.1%) |
| $12,500 to $14,999 | 4 (2.0%) | 8 (5.4%) |
| $15,000 to $17,499 | 8 (4.0%) | 8 (5.4%) |
| $17,500 to $19,999 | 0 (0.0%) | 1 (0.7%) |
| $20,000 to $22,499 | 4 (2.0%) | 7 (4.7%) |
| $22,500 to $24,999 | 9 (4.5%) | 0 (0.0%) |
| $25,000 to $29,999 | 20 (10.0%) | 17 (11.5%) |
| $30,000 to $34,999 | 15 (7.5%) | 6 (4.1%) |
| $35,000 to $39,999 | 20 (10.0%) | 9 (6.1%) |
| $40,000 to $44,999 | 11 (5.5%) | 20 (13.5%) |
| $45,000 to $49,999 | 8 (4.0%) | 5 (3.4%) |
| $50,000 to $54,999 | 9 (4.5%) | 9 (6.1%) |
| $55,000 to $64,999 | 14 (7.0%) | 18 (12.2%) |
| $65,000 to $74,999 | 10 (5.0%) | 3 (2.0%) |
| $75,000 to $99,999 | 21 (10.5%) | 7 (4.7%) |
| $100,000+ | 18 (9.0%) | 7 (4.7%) |
| Total | 200 (100.0%) | 148 (100.0%) |
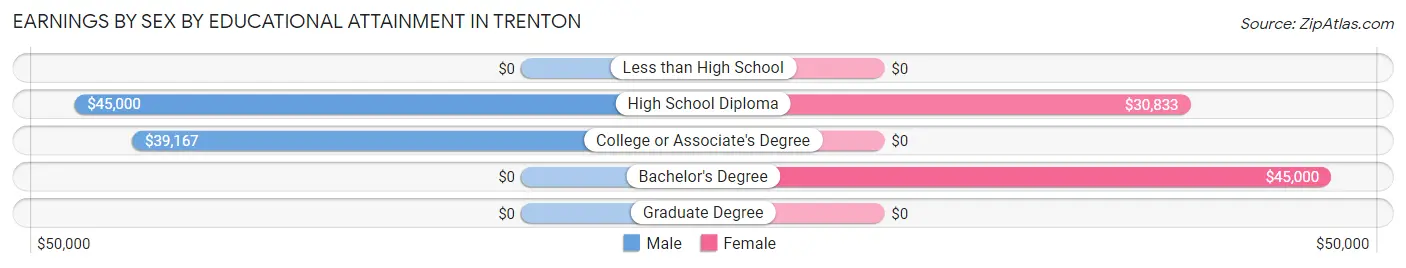
Earnings by Sex by Educational Attainment in Trenton
Average earnings in Trenton are $44,464 for men and $38,250 for women, a difference of 14.0%. Men with an educational attainment of high school diploma enjoy the highest average annual earnings of $45,000, while those with college or associate's degree education earn the least with $39,167. Women with an educational attainment of bachelor's degree earn the most with the average annual earnings of $45,000, while those with high school diploma education have the smallest earnings of $30,833.
| Educational Attainment | Male Income | Female Income |
| Less than High School | - | - |
| High School Diploma | $45,000 | $30,833 |
| College or Associate's Degree | $39,167 | $0 |
| Bachelor's Degree | - | - |
| Graduate Degree | - | - |
| Total | $44,464 | $38,250 |
Family Income in Trenton
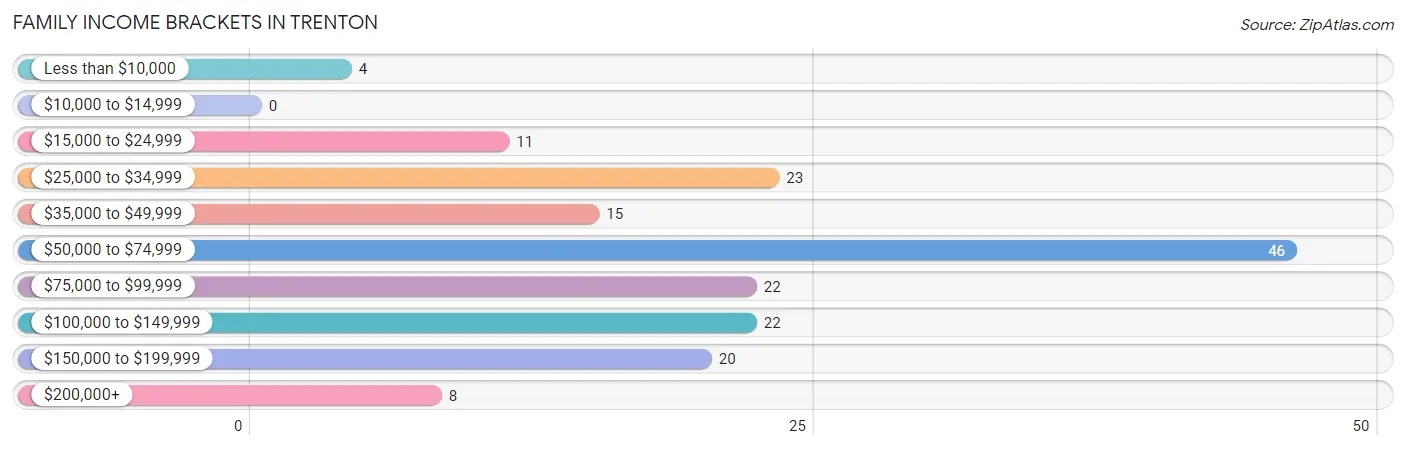
Family Income Brackets in Trenton
According to the Trenton family income data, there are 46 families falling into the $50,000 to $74,999 income range, which is the most common income bracket and makes up 26.9% of all families.
| Income Bracket | # Families | % Families |
| Less than $10,000 | 4 | 2.3% |
| $10,000 to $14,999 | 0 | 0.0% |
| $15,000 to $24,999 | 11 | 6.4% |
| $25,000 to $34,999 | 23 | 13.5% |
| $35,000 to $49,999 | 15 | 8.8% |
| $50,000 to $74,999 | 46 | 26.9% |
| $75,000 to $99,999 | 22 | 12.9% |
| $100,000 to $149,999 | 22 | 12.9% |
| $150,000 to $199,999 | 20 | 11.7% |
| $200,000+ | 8 | 4.7% |
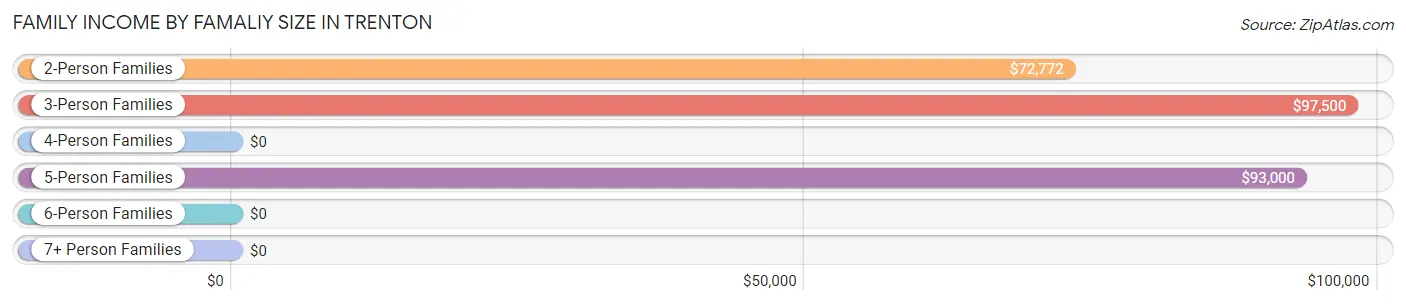
Family Income by Famaliy Size in Trenton
3-person families (42 | 24.6%) account for the highest median family income in Trenton with $97,500 per family, while 2-person families (87 | 50.9%) have the highest median income of $36,386 per family member.
| Income Bracket | # Families | Median Income |
| 2-Person Families | 87 (50.9%) | $72,772 |
| 3-Person Families | 42 (24.6%) | $97,500 |
| 4-Person Families | 19 (11.1%) | $0 |
| 5-Person Families | 16 (9.4%) | $93,000 |
| 6-Person Families | 7 (4.1%) | $0 |
| 7+ Person Families | 0 (0.0%) | $0 |
| Total | 171 (100.0%) | $73,533 |
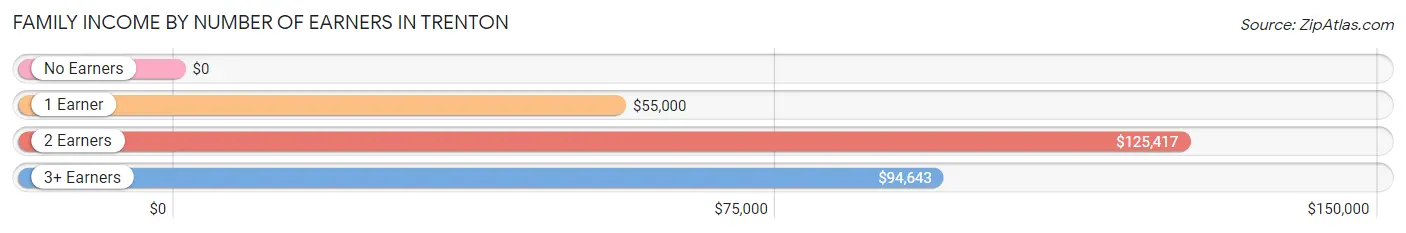
Family Income by Number of Earners in Trenton
| Number of Earners | # Families | Median Income |
| No Earners | 26 (15.2%) | $0 |
| 1 Earner | 56 (32.8%) | $55,000 |
| 2 Earners | 69 (40.4%) | $125,417 |
| 3+ Earners | 20 (11.7%) | $94,643 |
| Total | 171 (100.0%) | $73,533 |
Household Income in Trenton
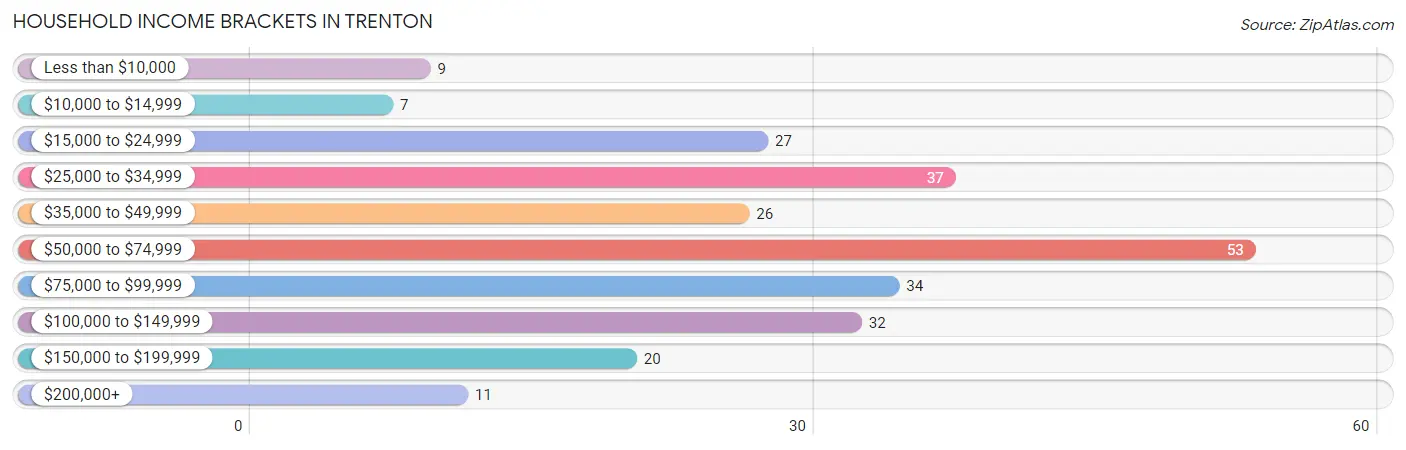
Household Income Brackets in Trenton
With 53 households falling in the category, the $50,000 to $74,999 income range is the most frequent in Trenton, accounting for 20.7% of all households. In contrast, only 7 households (2.7%) fall into the $10,000 to $14,999 income bracket, making it the least populous group.
| Income Bracket | # Households | % Households |
| Less than $10,000 | 9 | 3.5% |
| $10,000 to $14,999 | 7 | 2.7% |
| $15,000 to $24,999 | 27 | 10.5% |
| $25,000 to $34,999 | 37 | 14.5% |
| $35,000 to $49,999 | 26 | 10.2% |
| $50,000 to $74,999 | 53 | 20.7% |
| $75,000 to $99,999 | 34 | 13.3% |
| $100,000 to $149,999 | 32 | 12.5% |
| $150,000 to $199,999 | 20 | 7.8% |
| $200,000+ | 11 | 4.3% |
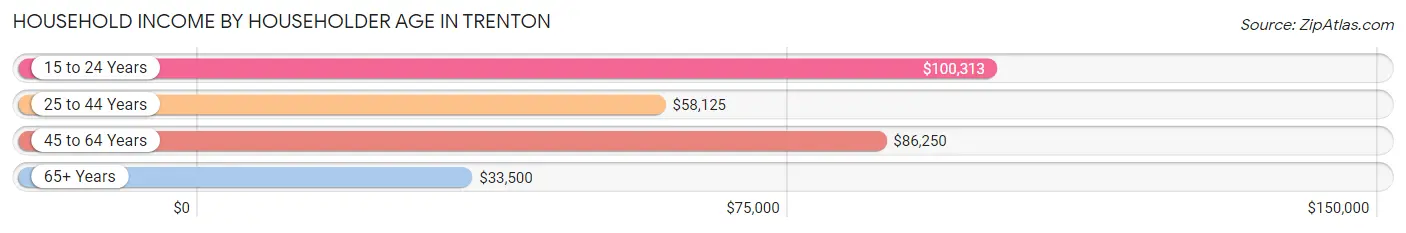
Household Income by Householder Age in Trenton
The median household income in Trenton is $62,857, with the highest median household income of $100,313 found in the 15 to 24 years age bracket for the primary householder. A total of 7 households (2.7%) fall into this category. Meanwhile, the 65+ years age bracket for the primary householder has the lowest median household income of $33,500, with 78 households (30.5%) in this group.
| Income Bracket | # Households | Median Income |
| 15 to 24 Years | 7 (2.7%) | $100,313 |
| 25 to 44 Years | 79 (30.9%) | $58,125 |
| 45 to 64 Years | 92 (35.9%) | $86,250 |
| 65+ Years | 78 (30.5%) | $33,500 |
| Total | 256 (100.0%) | $62,857 |
Poverty in Trenton
Income Below Poverty by Sex and Age in Trenton
With 7.7% poverty level for males and 17.1% for females among the residents of Trenton, 15 year old males and 5 year old females are the most vulnerable to poverty, with 3 males (50.0%) and 4 females (100.0%) in their respective age groups living below the poverty level.
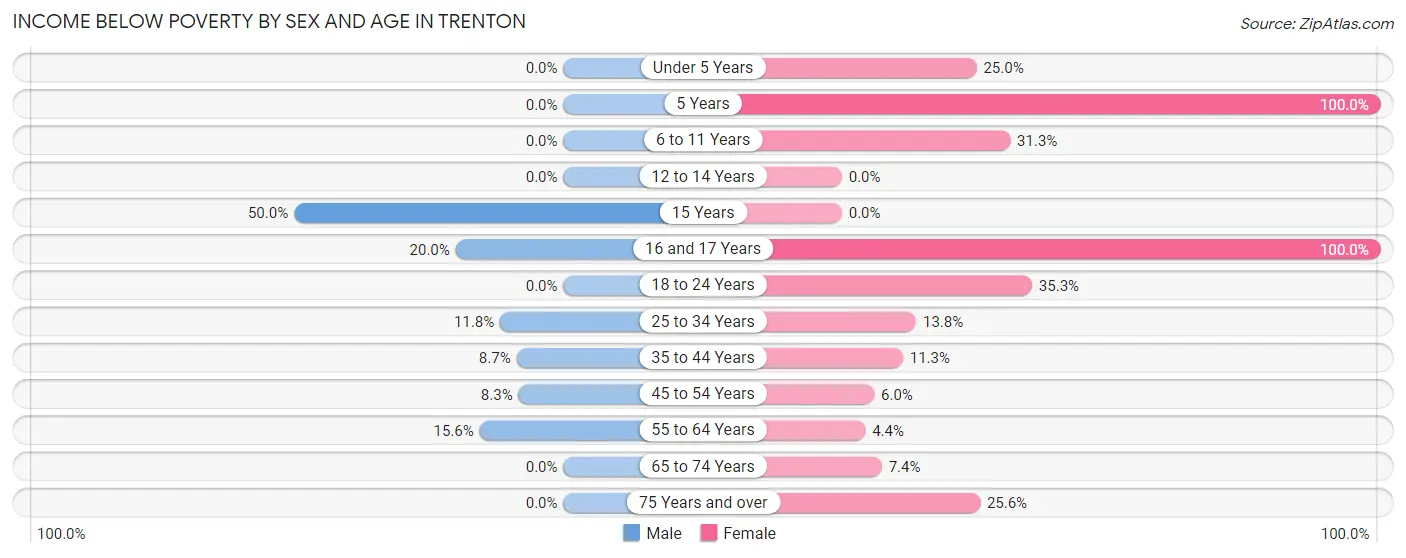
| Age Bracket | Male | Female |
| Under 5 Years | 0 (0.0%) | 3 (25.0%) |
| 5 Years | 0 (0.0%) | 4 (100.0%) |
| 6 to 11 Years | 0 (0.0%) | 10 (31.2%) |
| 12 to 14 Years | 0 (0.0%) | 0 (0.0%) |
| 15 Years | 3 (50.0%) | 0 (0.0%) |
| 16 and 17 Years | 1 (20.0%) | 7 (100.0%) |
| 18 to 24 Years | 0 (0.0%) | 6 (35.3%) |
| 25 to 34 Years | 4 (11.8%) | 4 (13.8%) |
| 35 to 44 Years | 6 (8.7%) | 6 (11.3%) |
| 45 to 54 Years | 2 (8.3%) | 3 (6.0%) |
| 55 to 64 Years | 7 (15.6%) | 2 (4.3%) |
| 65 to 74 Years | 0 (0.0%) | 2 (7.4%) |
| 75 Years and over | 0 (0.0%) | 10 (25.6%) |
| Total | 23 (7.7%) | 57 (17.1%) |
Income Above Poverty by Sex and Age in Trenton
According to the poverty statistics in Trenton, males aged under 5 years and females aged 12 to 14 years are the age groups that are most secure financially, with 100.0% of males and 100.0% of females in these age groups living above the poverty line.
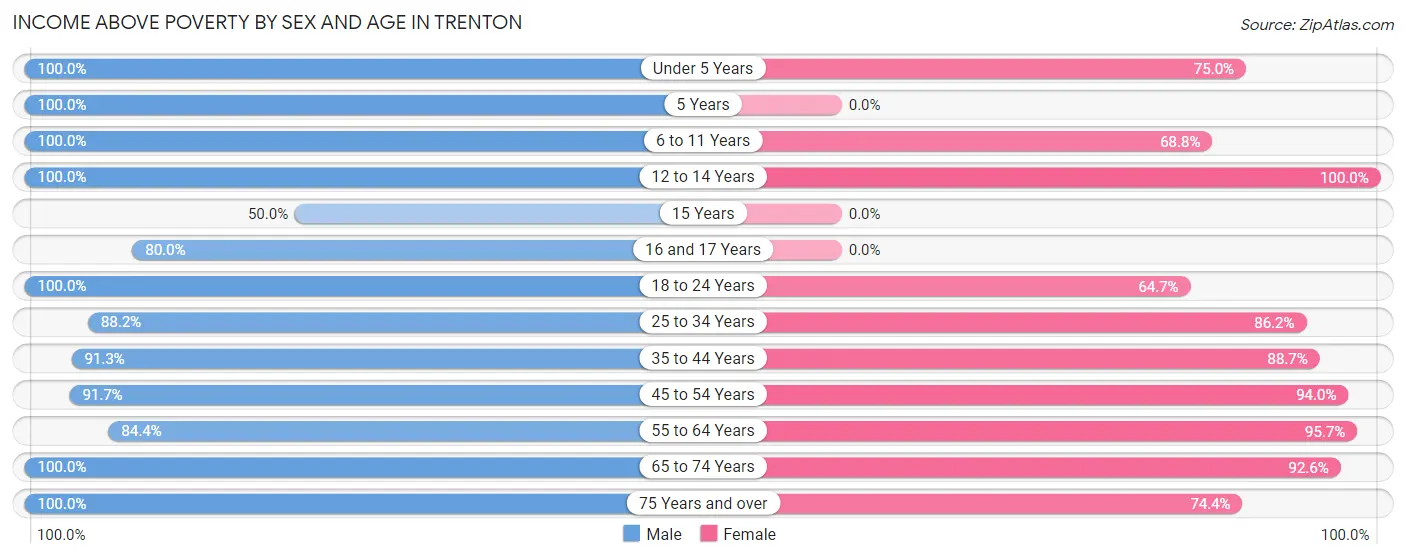
| Age Bracket | Male | Female |
| Under 5 Years | 8 (100.0%) | 9 (75.0%) |
| 5 Years | 1 (100.0%) | 0 (0.0%) |
| 6 to 11 Years | 13 (100.0%) | 22 (68.8%) |
| 12 to 14 Years | 4 (100.0%) | 18 (100.0%) |
| 15 Years | 3 (50.0%) | 0 (0.0%) |
| 16 and 17 Years | 4 (80.0%) | 0 (0.0%) |
| 18 to 24 Years | 50 (100.0%) | 11 (64.7%) |
| 25 to 34 Years | 30 (88.2%) | 25 (86.2%) |
| 35 to 44 Years | 63 (91.3%) | 47 (88.7%) |
| 45 to 54 Years | 22 (91.7%) | 47 (94.0%) |
| 55 to 64 Years | 38 (84.4%) | 44 (95.7%) |
| 65 to 74 Years | 23 (100.0%) | 25 (92.6%) |
| 75 Years and over | 18 (100.0%) | 29 (74.4%) |
| Total | 277 (92.3%) | 277 (82.9%) |
Income Below Poverty Among Married-Couple Families in Trenton
The poverty statistics for married-couple families in Trenton show that 10.1% or 14 of the total 138 families live below the poverty line. Families with 3 or 4 children have the highest poverty rate of 44.4%, comprising of 4 families. On the other hand, families with no children have the lowest poverty rate of 5.2%, which includes 4 families.
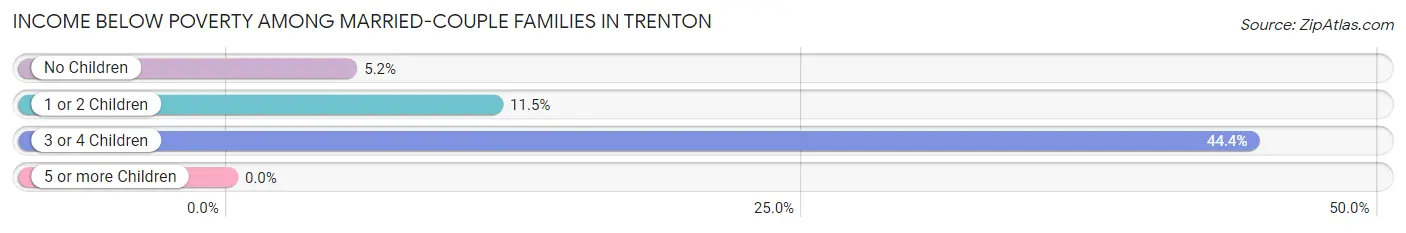
| Children | Above Poverty | Below Poverty |
| No Children | 73 (94.8%) | 4 (5.2%) |
| 1 or 2 Children | 46 (88.5%) | 6 (11.5%) |
| 3 or 4 Children | 5 (55.6%) | 4 (44.4%) |
| 5 or more Children | 0 (0.0%) | 0 (0.0%) |
| Total | 124 (89.9%) | 14 (10.1%) |
Income Below Poverty Among Single-Parent Households in Trenton
| Children | Single Father | Single Mother |
| No Children | 0 (0.0%) | 0 (0.0%) |
| 1 or 2 Children | 0 (0.0%) | 0 (0.0%) |
| 3 or 4 Children | 0 (0.0%) | 0 (0.0%) |
| 5 or more Children | 0 (0.0%) | 0 (0.0%) |
| Total | 0 (0.0%) | 0 (0.0%) |
Income Below Poverty Among Married-Couple vs Single-Parent Households in Trenton
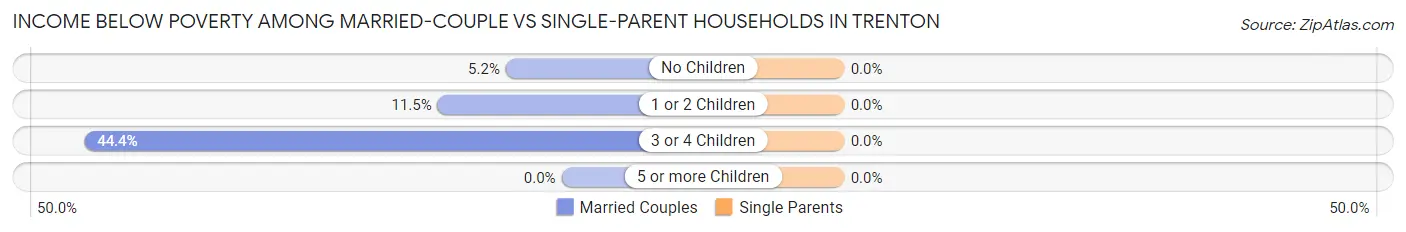
| Children | Married-Couple Families | Single-Parent Households |
| No Children | 4 (5.2%) | 0 (0.0%) |
| 1 or 2 Children | 6 (11.5%) | 0 (0.0%) |
| 3 or 4 Children | 4 (44.4%) | 0 (0.0%) |
| 5 or more Children | 0 (0.0%) | 0 (0.0%) |
| Total | 14 (10.1%) | 0 (0.0%) |
Race in Trenton
The most populous races in Trenton are White / Caucasian (586 | 92.1%), Hispanic or Latino (104 | 16.4%), and Two or more Races (30 | 4.7%).
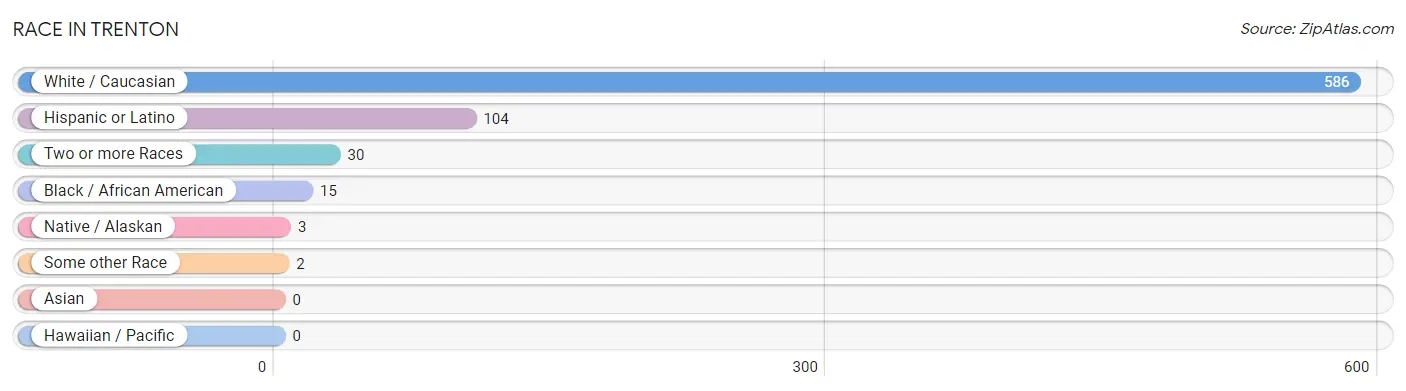
| Race | # Population | % Population |
| Asian | 0 | 0.0% |
| Black / African American | 15 | 2.4% |
| Hawaiian / Pacific | 0 | 0.0% |
| Hispanic or Latino | 104 | 16.4% |
| Native / Alaskan | 3 | 0.5% |
| White / Caucasian | 586 | 92.1% |
| Two or more Races | 30 | 4.7% |
| Some other Race | 2 | 0.3% |
| Total | 636 | 100.0% |
Ancestry in Trenton
The most populous ancestries reported in Trenton are American (102 | 16.0%), Mexican (102 | 16.0%), Irish (69 | 10.8%), German (53 | 8.3%), and English (43 | 6.8%), together accounting for 58.0% of all Trenton residents.
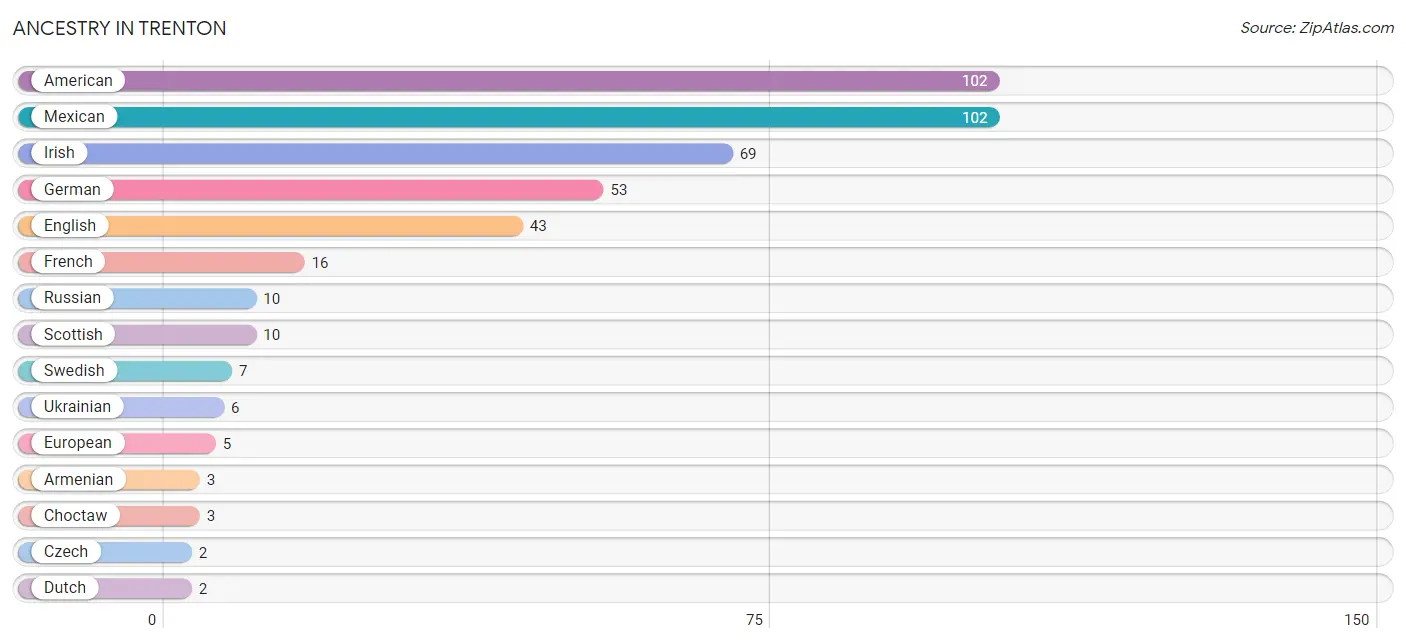
| Ancestry | # Population | % Population |
| American | 102 | 16.0% |
| Armenian | 3 | 0.5% |
| Cherokee | 1 | 0.2% |
| Choctaw | 3 | 0.5% |
| Czech | 2 | 0.3% |
| Dutch | 2 | 0.3% |
| English | 43 | 6.8% |
| European | 5 | 0.8% |
| French | 16 | 2.5% |
| German | 53 | 8.3% |
| Greek | 2 | 0.3% |
| Irish | 69 | 10.8% |
| Italian | 2 | 0.3% |
| Mexican | 102 | 16.0% |
| Polish | 2 | 0.3% |
| Russian | 10 | 1.6% |
| Scottish | 10 | 1.6% |
| Spaniard | 2 | 0.3% |
| Swedish | 7 | 1.1% |
| Ukrainian | 6 | 0.9% | View All 20 Rows |
Immigrants in Trenton
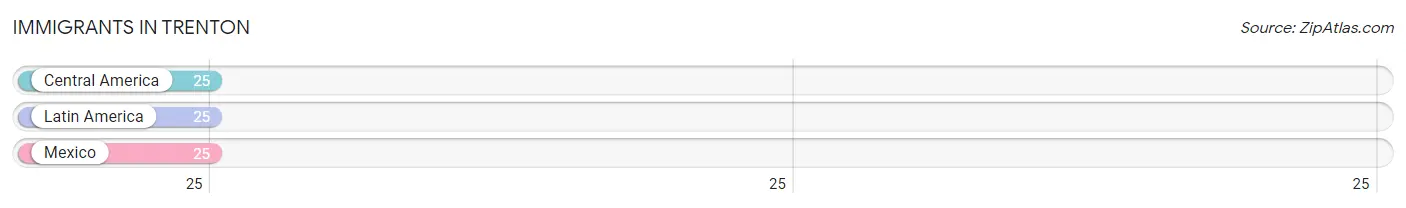
The most numerous immigrant groups reported in Trenton came from Central America (25 | 3.9%), Latin America (25 | 3.9%), and Mexico (25 | 3.9%), together accounting for 11.8% of all Trenton residents.
| Immigration Origin | # Population | % Population |
| Central America | 25 | 3.9% |
| Latin America | 25 | 3.9% |
| Mexico | 25 | 3.9% | View All 3 Rows |
Sex and Age in Trenton
Sex and Age in Trenton
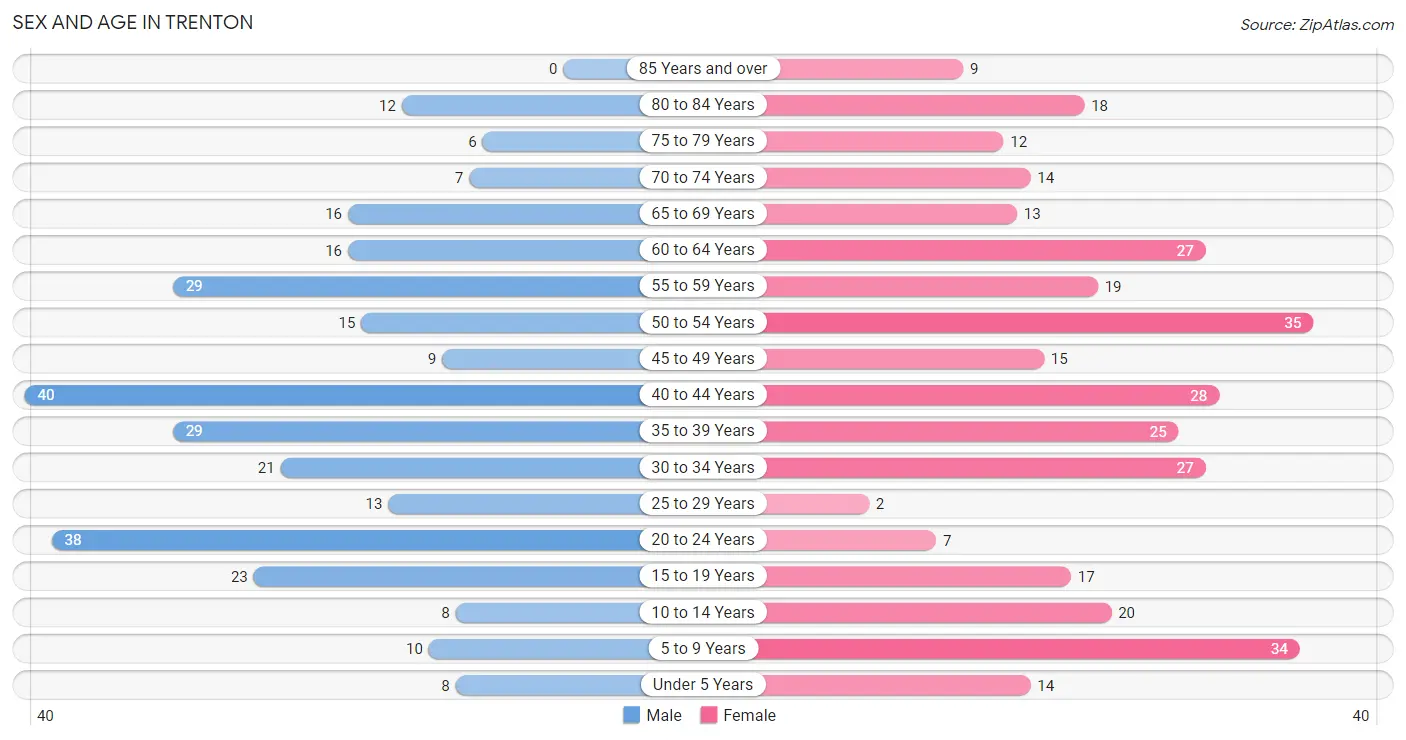
The most populous age groups in Trenton are 40 to 44 Years (40 | 13.3%) for men and 50 to 54 Years (35 | 10.4%) for women.
| Age Bracket | Male | Female |
| Under 5 Years | 8 (2.7%) | 14 (4.2%) |
| 5 to 9 Years | 10 (3.3%) | 34 (10.1%) |
| 10 to 14 Years | 8 (2.7%) | 20 (5.9%) |
| 15 to 19 Years | 23 (7.7%) | 17 (5.1%) |
| 20 to 24 Years | 38 (12.7%) | 7 (2.1%) |
| 25 to 29 Years | 13 (4.3%) | 2 (0.6%) |
| 30 to 34 Years | 21 (7.0%) | 27 (8.0%) |
| 35 to 39 Years | 29 (9.7%) | 25 (7.4%) |
| 40 to 44 Years | 40 (13.3%) | 28 (8.3%) |
| 45 to 49 Years | 9 (3.0%) | 15 (4.5%) |
| 50 to 54 Years | 15 (5.0%) | 35 (10.4%) |
| 55 to 59 Years | 29 (9.7%) | 19 (5.7%) |
| 60 to 64 Years | 16 (5.3%) | 27 (8.0%) |
| 65 to 69 Years | 16 (5.3%) | 13 (3.9%) |
| 70 to 74 Years | 7 (2.3%) | 14 (4.2%) |
| 75 to 79 Years | 6 (2.0%) | 12 (3.6%) |
| 80 to 84 Years | 12 (4.0%) | 18 (5.4%) |
| 85 Years and over | 0 (0.0%) | 9 (2.7%) |
| Total | 300 (100.0%) | 336 (100.0%) |
Families and Households in Trenton
Median Family Size in Trenton
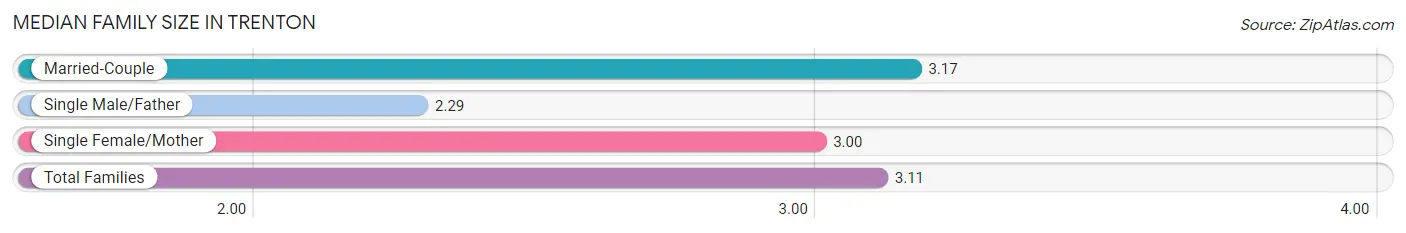
The median family size in Trenton is 3.11 persons per family, with married-couple families (138 | 80.7%) accounting for the largest median family size of 3.17 persons per family. On the other hand, single male/father families (7 | 4.1%) represent the smallest median family size with 2.29 persons per family.
| Family Type | # Families | Family Size |
| Married-Couple | 138 (80.7%) | 3.17 |
| Single Male/Father | 7 (4.1%) | 2.29 |
| Single Female/Mother | 26 (15.2%) | 3.00 |
| Total Families | 171 (100.0%) | 3.11 |
Median Household Size in Trenton
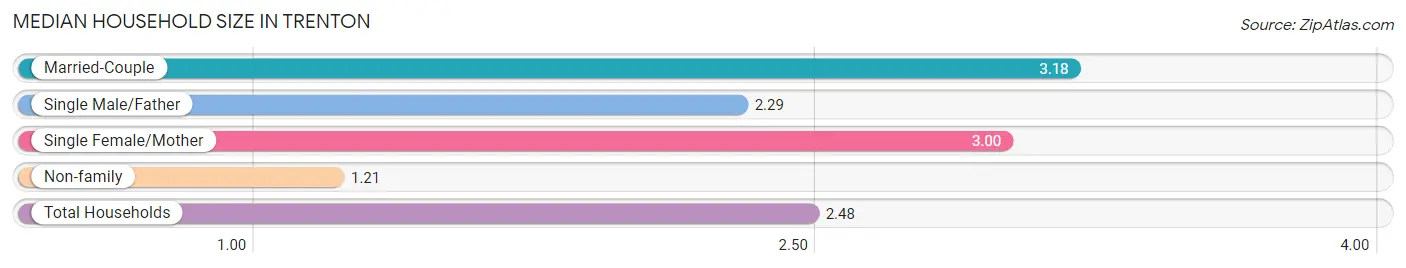
The median household size in Trenton is 2.48 persons per household, with married-couple households (138 | 53.9%) accounting for the largest median household size of 3.18 persons per household. non-family households (85 | 33.2%) represent the smallest median household size with 1.21 persons per household.
| Household Type | # Households | Household Size |
| Married-Couple | 138 (53.9%) | 3.18 |
| Single Male/Father | 7 (2.7%) | 2.29 |
| Single Female/Mother | 26 (10.2%) | 3.00 |
| Non-family | 85 (33.2%) | 1.21 |
| Total Households | 256 (100.0%) | 2.48 |
Household Size by Marriage Status in Trenton
Out of a total of 256 households in Trenton, 171 (66.8%) are family households, while 85 (33.2%) are nonfamily households. The most numerous type of family households are 2-person households, comprising 87, and the most common type of nonfamily households are 1-person households, comprising 69.
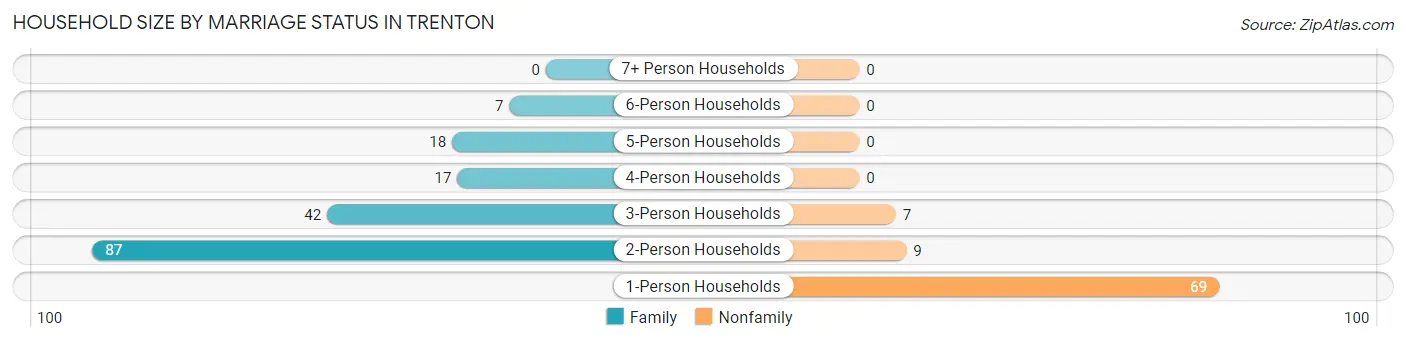
| Household Size | Family Households | Nonfamily Households |
| 1-Person Households | - | 69 (27.0%) |
| 2-Person Households | 87 (34.0%) | 9 (3.5%) |
| 3-Person Households | 42 (16.4%) | 7 (2.7%) |
| 4-Person Households | 17 (6.6%) | 0 (0.0%) |
| 5-Person Households | 18 (7.0%) | 0 (0.0%) |
| 6-Person Households | 7 (2.7%) | 0 (0.0%) |
| 7+ Person Households | 0 (0.0%) | 0 (0.0%) |
| Total | 171 (66.8%) | 85 (33.2%) |
Female Fertility in Trenton
Fertility by Age in Trenton
Average fertility rate in Trenton is 101.0 births per 1,000 women. Women in the age bracket of 15 to 19 years have the highest fertility rate with 235.0 births per 1,000 women. Women in the age bracket of 35 to 50 years acount for 42.9% of all women with births.
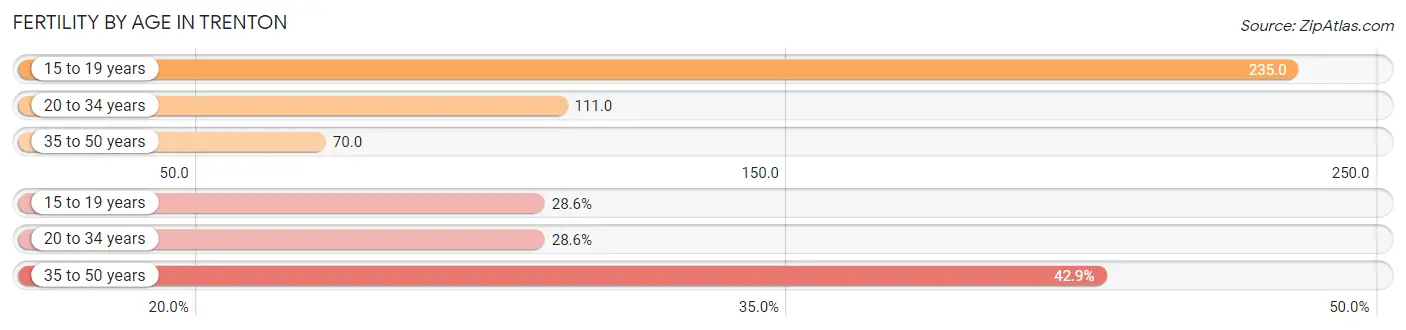
| Age Bracket | Women with Births | Births / 1,000 Women |
| 15 to 19 years | 4 (28.6%) | 235.0 |
| 20 to 34 years | 4 (28.6%) | 111.0 |
| 35 to 50 years | 6 (42.9%) | 70.0 |
| Total | 14 (100.0%) | 101.0 |
Fertility by Age by Marriage Status in Trenton
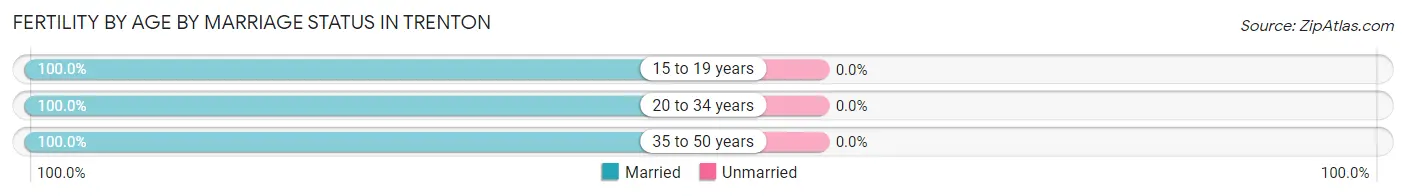
| Age Bracket | Married | Unmarried |
| 15 to 19 years | 4 (100.0%) | 0 (0.0%) |
| 20 to 34 years | 4 (100.0%) | 0 (0.0%) |
| 35 to 50 years | 6 (100.0%) | 0 (0.0%) |
| Total | 14 (100.0%) | 0 (0.0%) |
Fertility by Education in Trenton
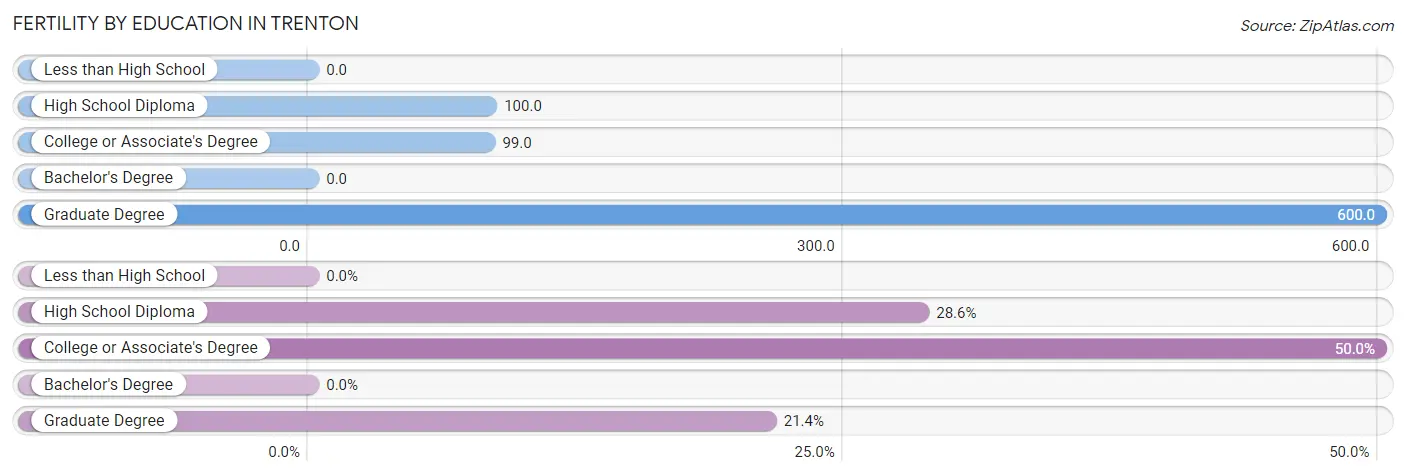
| Educational Attainment | Women with Births | Births / 1,000 Women |
| Less than High School | 0 (0.0%) | 0.0 |
| High School Diploma | 4 (28.6%) | 100.0 |
| College or Associate's Degree | 7 (50.0%) | 99.0 |
| Bachelor's Degree | 0 (0.0%) | 0.0 |
| Graduate Degree | 3 (21.4%) | 600.0 |
| Total | 14 (100.0%) | 101.0 |
Fertility by Education by Marriage Status in Trenton
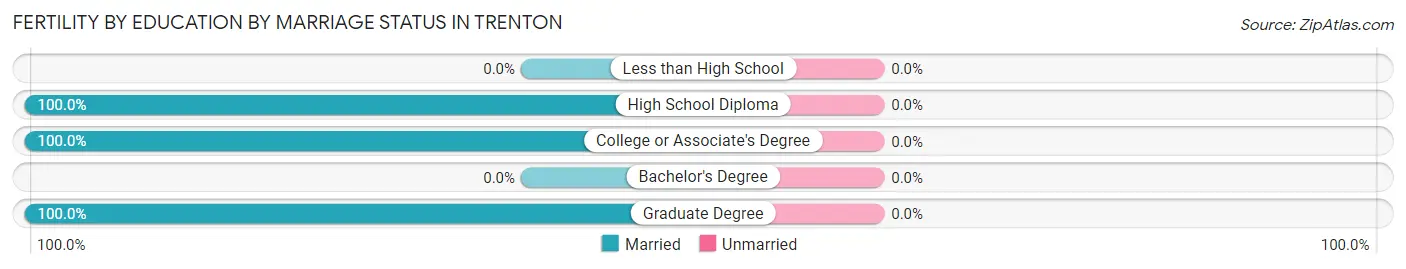
| Educational Attainment | Married | Unmarried |
| Less than High School | 0 (0.0%) | 0 (0.0%) |
| High School Diploma | 4 (100.0%) | 0 (0.0%) |
| College or Associate's Degree | 7 (100.0%) | 0 (0.0%) |
| Bachelor's Degree | 0 (0.0%) | 0 (0.0%) |
| Graduate Degree | 3 (100.0%) | 0 (0.0%) |
| Total | 14 (100.0%) | 0 (0.0%) |
Employment Characteristics in Trenton
Employment by Class of Employer in Trenton
Among the 334 employed individuals in Trenton, private company employees (219 | 65.6%), local government employees (53 | 15.9%), and self-employed (not incorporated) (21 | 6.3%) make up the most common classes of employment.
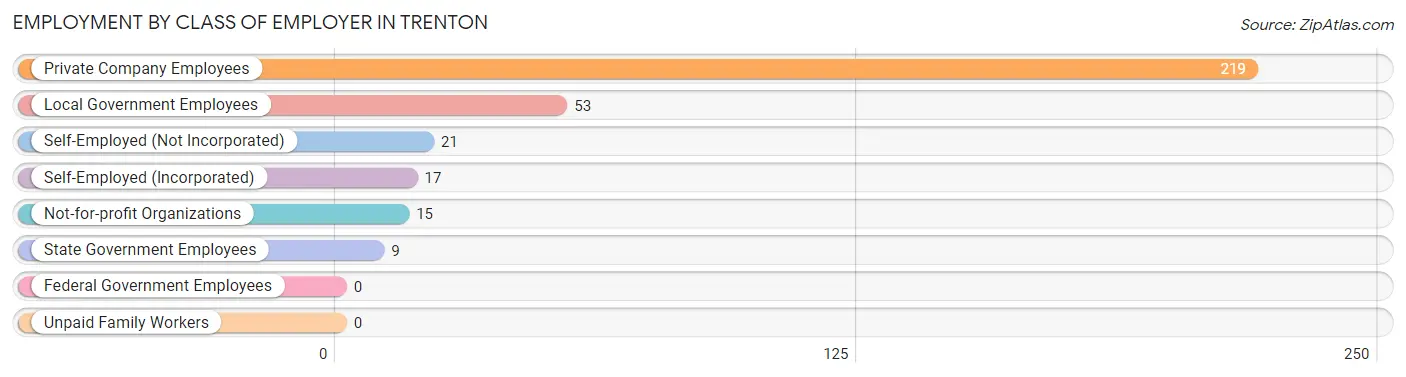
| Employer Class | # Employees | % Employees |
| Private Company Employees | 219 | 65.6% |
| Self-Employed (Incorporated) | 17 | 5.1% |
| Self-Employed (Not Incorporated) | 21 | 6.3% |
| Not-for-profit Organizations | 15 | 4.5% |
| Local Government Employees | 53 | 15.9% |
| State Government Employees | 9 | 2.7% |
| Federal Government Employees | 0 | 0.0% |
| Unpaid Family Workers | 0 | 0.0% |
| Total | 334 | 100.0% |
Employment Status by Age in Trenton
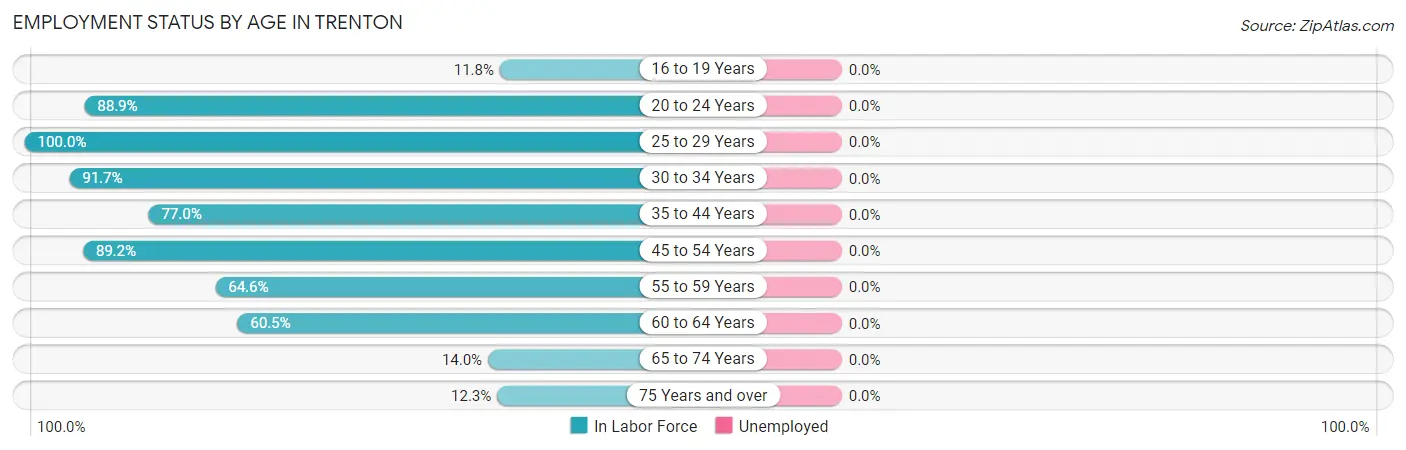
| Age Bracket | In Labor Force | Unemployed |
| 16 to 19 Years | 4 (11.8%) | 0 (0.0%) |
| 20 to 24 Years | 40 (88.9%) | 0 (0.0%) |
| 25 to 29 Years | 15 (100.0%) | 0 (0.0%) |
| 30 to 34 Years | 44 (91.7%) | 0 (0.0%) |
| 35 to 44 Years | 94 (77.0%) | 0 (0.0%) |
| 45 to 54 Years | 66 (89.2%) | 0 (0.0%) |
| 55 to 59 Years | 31 (64.6%) | 0 (0.0%) |
| 60 to 64 Years | 26 (60.5%) | 0 (0.0%) |
| 65 to 74 Years | 7 (14.0%) | 0 (0.0%) |
| 75 Years and over | 7 (12.3%) | 0 (0.0%) |
| Total | 334 (62.3%) | 0 (0.0%) |
Employment Status by Educational Attainment in Trenton
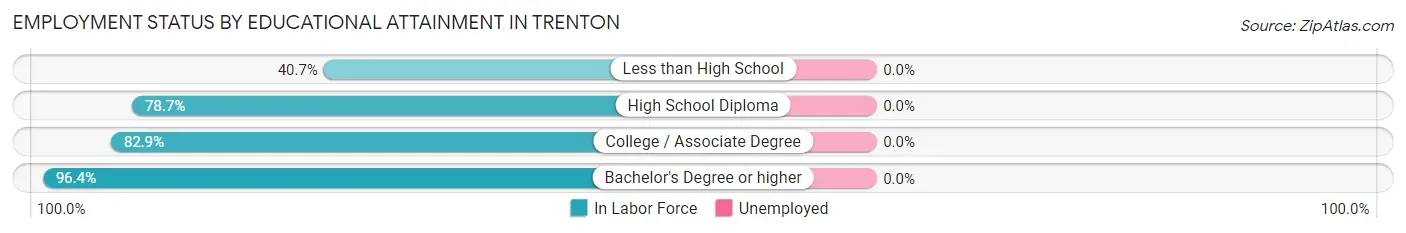
| Educational Attainment | In Labor Force | Unemployed |
| Less than High School | 11 (40.7%) | 0 (0.0%) |
| High School Diploma | 122 (78.7%) | 0 (0.0%) |
| College / Associate Degree | 116 (82.9%) | 0 (0.0%) |
| Bachelor's Degree or higher | 27 (96.4%) | 0 (0.0%) |
| Total | 276 (78.9%) | 0 (0.0%) |
Employment Occupations by Sex in Trenton
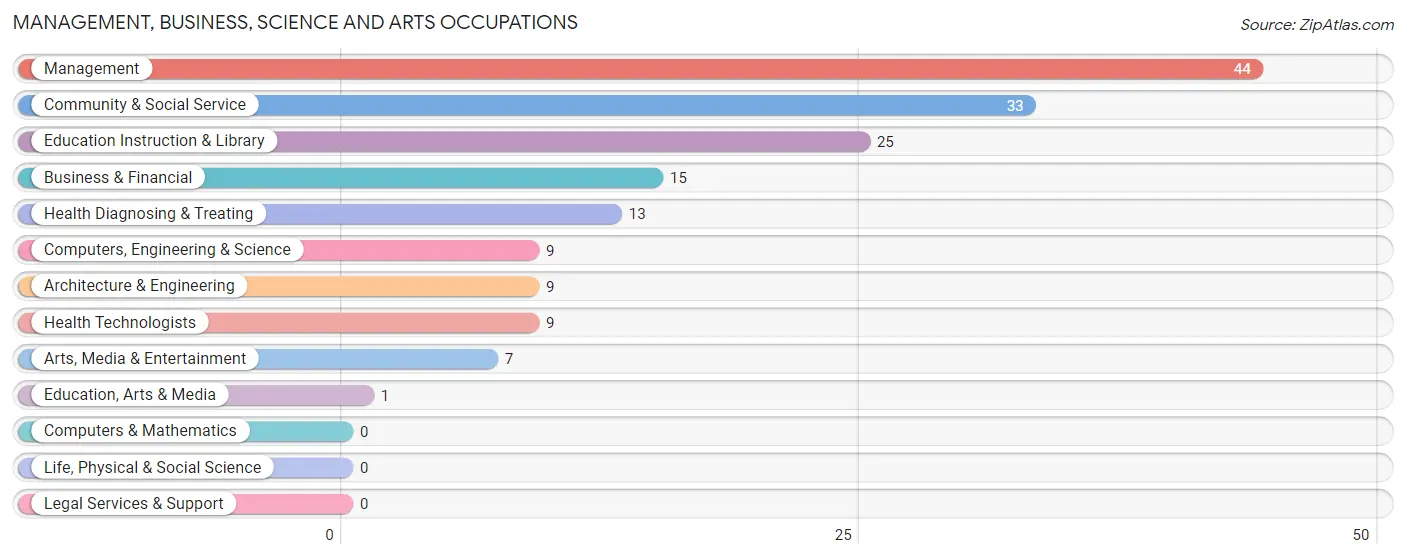
Management, Business, Science and Arts Occupations
The most common Management, Business, Science and Arts occupations in Trenton are Management (44 | 13.2%), Community & Social Service (33 | 9.9%), Education Instruction & Library (25 | 7.5%), Business & Financial (15 | 4.5%), and Health Diagnosing & Treating (13 | 3.9%).
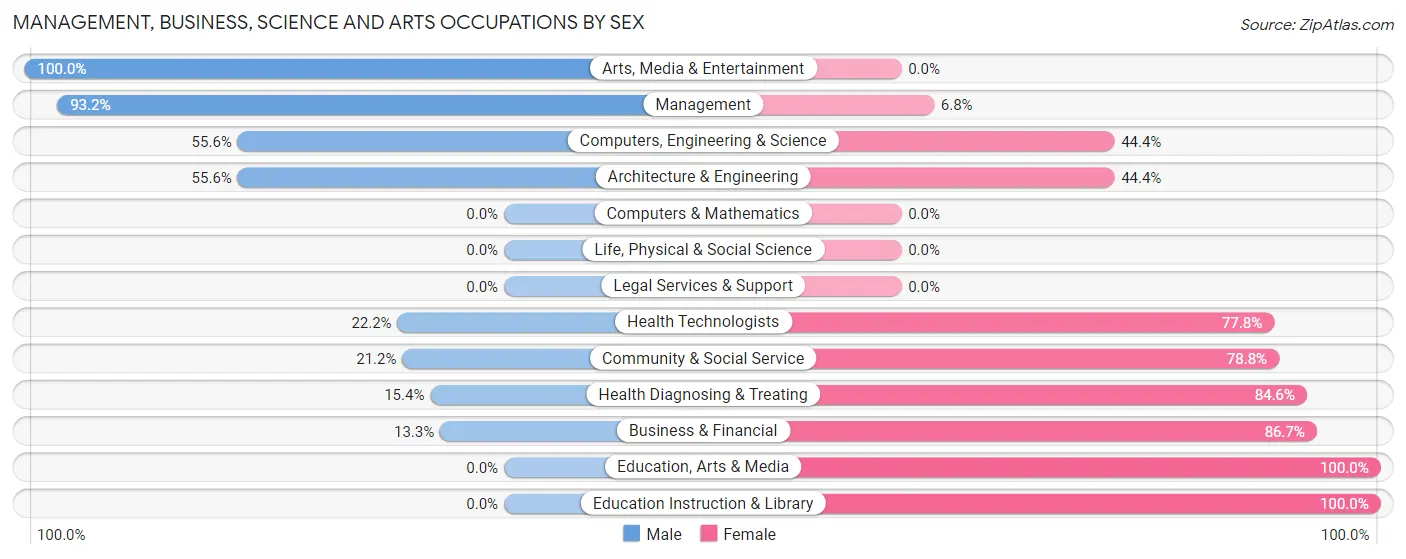
Management, Business, Science and Arts Occupations by Sex
Within the Management, Business, Science and Arts occupations in Trenton, the most male-oriented occupations are Arts, Media & Entertainment (100.0%), Management (93.2%), and Computers, Engineering & Science (55.6%), while the most female-oriented occupations are Education, Arts & Media (100.0%), Education Instruction & Library (100.0%), and Business & Financial (86.7%).
| Occupation | Male | Female |
| Management | 41 (93.2%) | 3 (6.8%) |
| Business & Financial | 2 (13.3%) | 13 (86.7%) |
| Computers, Engineering & Science | 5 (55.6%) | 4 (44.4%) |
| Computers & Mathematics | 0 (0.0%) | 0 (0.0%) |
| Architecture & Engineering | 5 (55.6%) | 4 (44.4%) |
| Life, Physical & Social Science | 0 (0.0%) | 0 (0.0%) |
| Community & Social Service | 7 (21.2%) | 26 (78.8%) |
| Education, Arts & Media | 0 (0.0%) | 1 (100.0%) |
| Legal Services & Support | 0 (0.0%) | 0 (0.0%) |
| Education Instruction & Library | 0 (0.0%) | 25 (100.0%) |
| Arts, Media & Entertainment | 7 (100.0%) | 0 (0.0%) |
| Health Diagnosing & Treating | 2 (15.4%) | 11 (84.6%) |
| Health Technologists | 2 (22.2%) | 7 (77.8%) |
| Total (Category) | 57 (50.0%) | 57 (50.0%) |
| Total (Overall) | 195 (58.4%) | 139 (41.6%) |
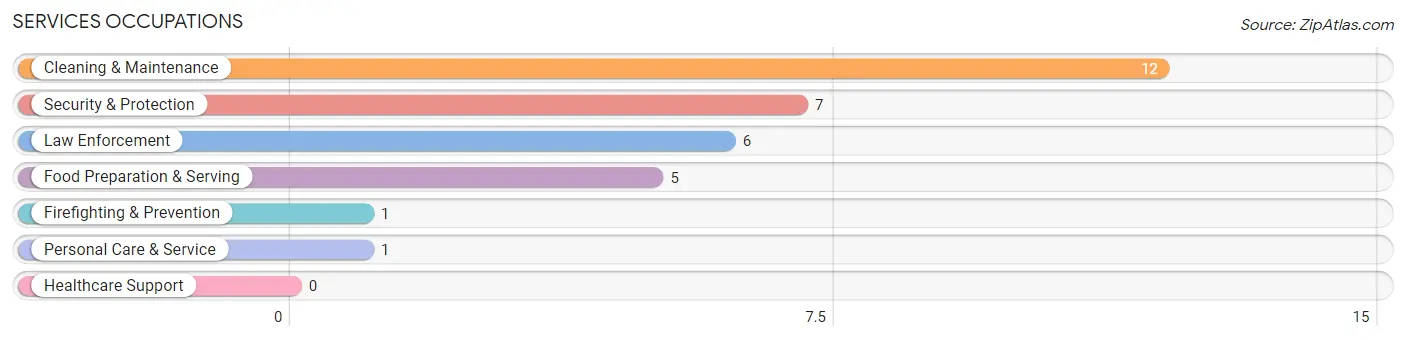
Services Occupations
The most common Services occupations in Trenton are Cleaning & Maintenance (12 | 3.6%), Security & Protection (7 | 2.1%), Law Enforcement (6 | 1.8%), Food Preparation & Serving (5 | 1.5%), and Firefighting & Prevention (1 | 0.3%).
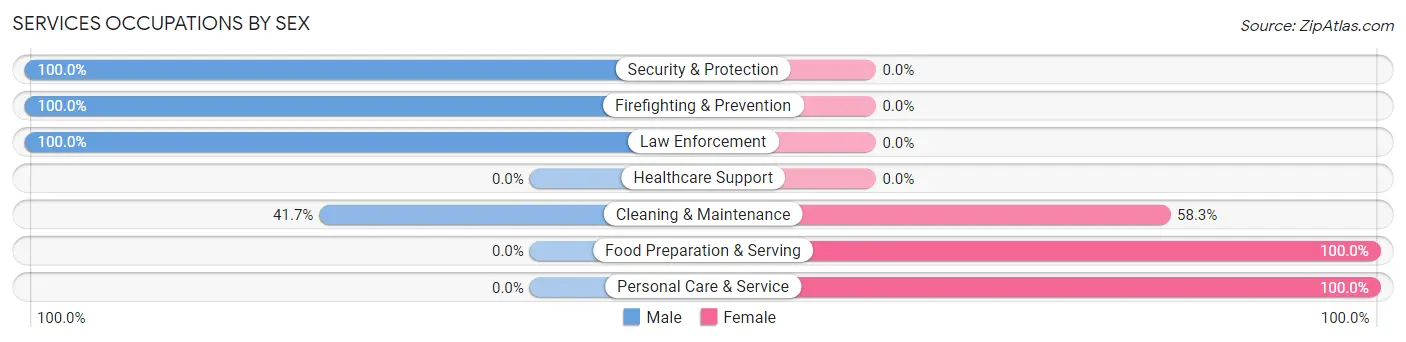
Services Occupations by Sex
Within the Services occupations in Trenton, the most male-oriented occupations are Security & Protection (100.0%), Firefighting & Prevention (100.0%), and Law Enforcement (100.0%), while the most female-oriented occupations are Food Preparation & Serving (100.0%), Personal Care & Service (100.0%), and Cleaning & Maintenance (58.3%).
| Occupation | Male | Female |
| Healthcare Support | 0 (0.0%) | 0 (0.0%) |
| Security & Protection | 7 (100.0%) | 0 (0.0%) |
| Firefighting & Prevention | 1 (100.0%) | 0 (0.0%) |
| Law Enforcement | 6 (100.0%) | 0 (0.0%) |
| Food Preparation & Serving | 0 (0.0%) | 5 (100.0%) |
| Cleaning & Maintenance | 5 (41.7%) | 7 (58.3%) |
| Personal Care & Service | 0 (0.0%) | 1 (100.0%) |
| Total (Category) | 12 (48.0%) | 13 (52.0%) |
| Total (Overall) | 195 (58.4%) | 139 (41.6%) |
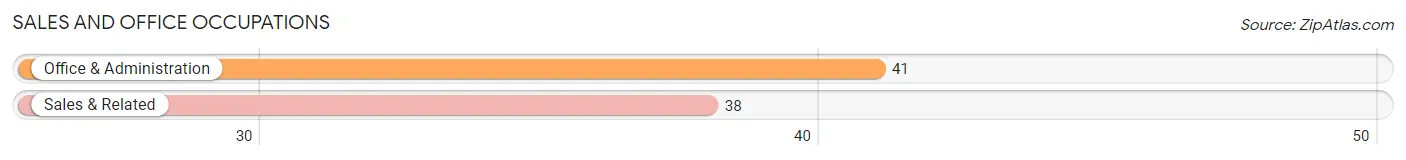
Sales and Office Occupations
The most common Sales and Office occupations in Trenton are Office & Administration (41 | 12.3%), and Sales & Related (38 | 11.4%).
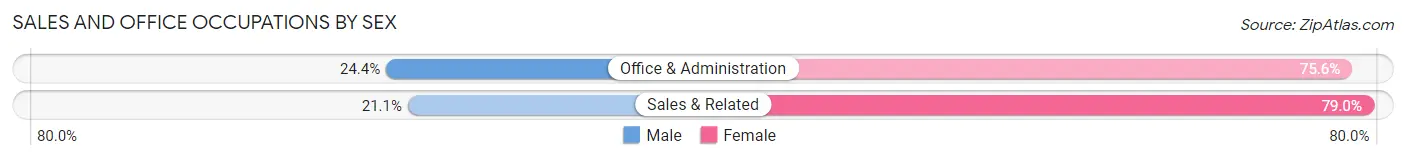
Sales and Office Occupations by Sex
| Occupation | Male | Female |
| Sales & Related | 8 (21.0%) | 30 (78.9%) |
| Office & Administration | 10 (24.4%) | 31 (75.6%) |
| Total (Category) | 18 (22.8%) | 61 (77.2%) |
| Total (Overall) | 195 (58.4%) | 139 (41.6%) |
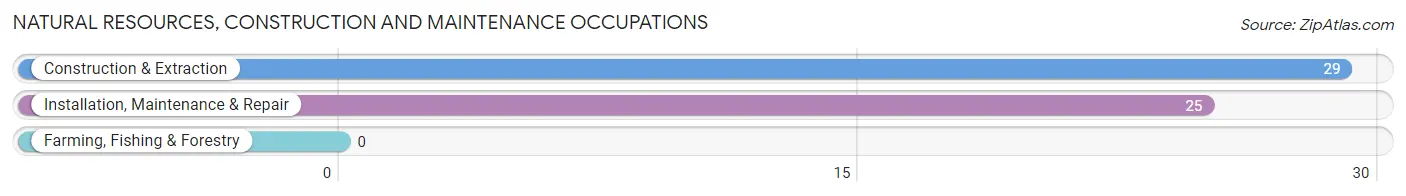
Natural Resources, Construction and Maintenance Occupations
The most common Natural Resources, Construction and Maintenance occupations in Trenton are Construction & Extraction (29 | 8.7%), and Installation, Maintenance & Repair (25 | 7.5%).
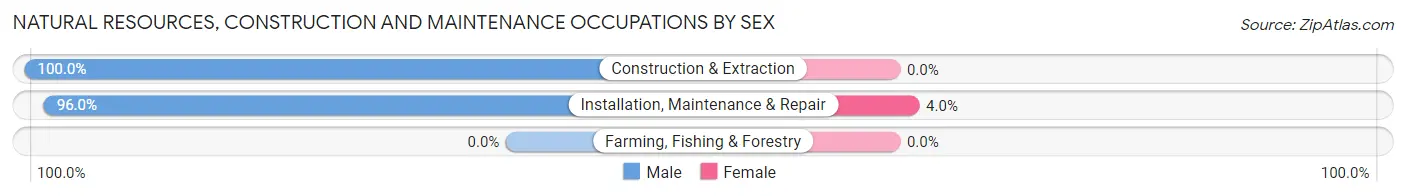
Natural Resources, Construction and Maintenance Occupations by Sex
| Occupation | Male | Female |
| Farming, Fishing & Forestry | 0 (0.0%) | 0 (0.0%) |
| Construction & Extraction | 29 (100.0%) | 0 (0.0%) |
| Installation, Maintenance & Repair | 24 (96.0%) | 1 (4.0%) |
| Total (Category) | 53 (98.2%) | 1 (1.8%) |
| Total (Overall) | 195 (58.4%) | 139 (41.6%) |
Production, Transportation and Moving Occupations
The most common Production, Transportation and Moving occupations in Trenton are Production (36 | 10.8%), Transportation (21 | 6.3%), and Material Moving (5 | 1.5%).
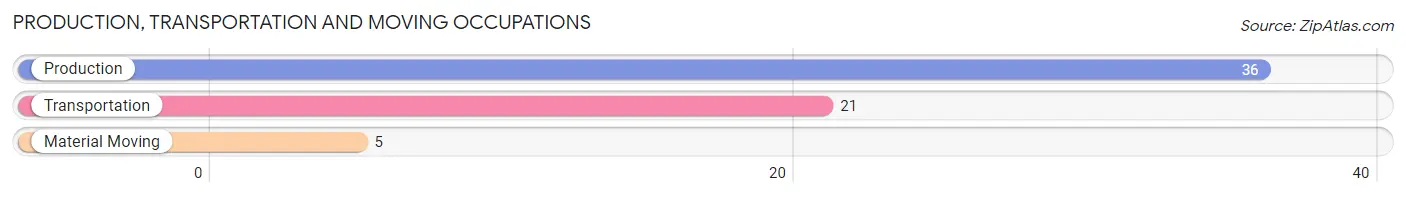
Production, Transportation and Moving Occupations by Sex
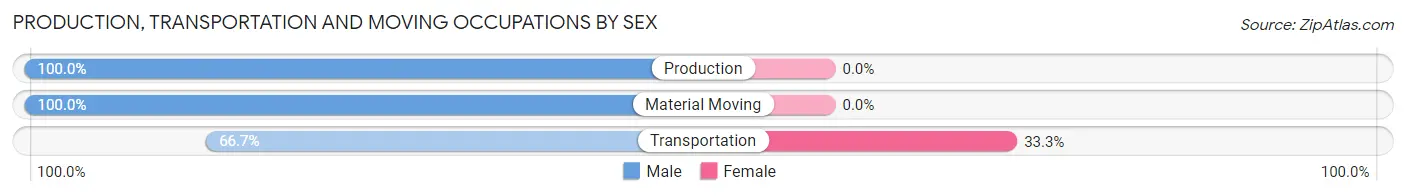
| Occupation | Male | Female |
| Production | 36 (100.0%) | 0 (0.0%) |
| Transportation | 14 (66.7%) | 7 (33.3%) |
| Material Moving | 5 (100.0%) | 0 (0.0%) |
| Total (Category) | 55 (88.7%) | 7 (11.3%) |
| Total (Overall) | 195 (58.4%) | 139 (41.6%) |
Employment Industries by Sex in Trenton
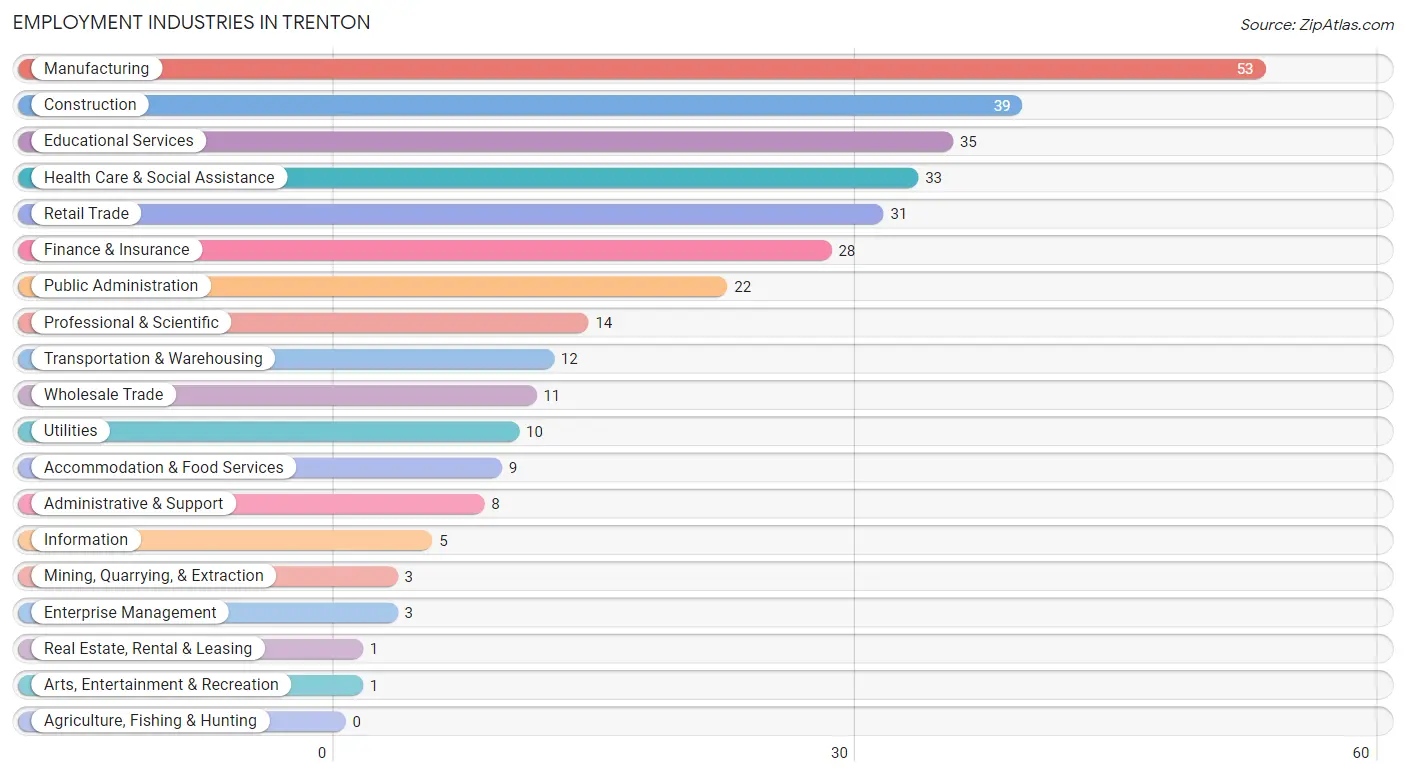
Employment Industries in Trenton
The major employment industries in Trenton include Manufacturing (53 | 15.9%), Construction (39 | 11.7%), Educational Services (35 | 10.5%), Health Care & Social Assistance (33 | 9.9%), and Retail Trade (31 | 9.3%).
Employment Industries by Sex in Trenton
The Trenton industries that see more men than women are Mining, Quarrying, & Extraction (100.0%), Information (100.0%), and Arts, Entertainment & Recreation (100.0%), whereas the industries that tend to have a higher number of women are Wholesale Trade (100.0%), Real Estate, Rental & Leasing (100.0%), and Enterprise Management (100.0%).
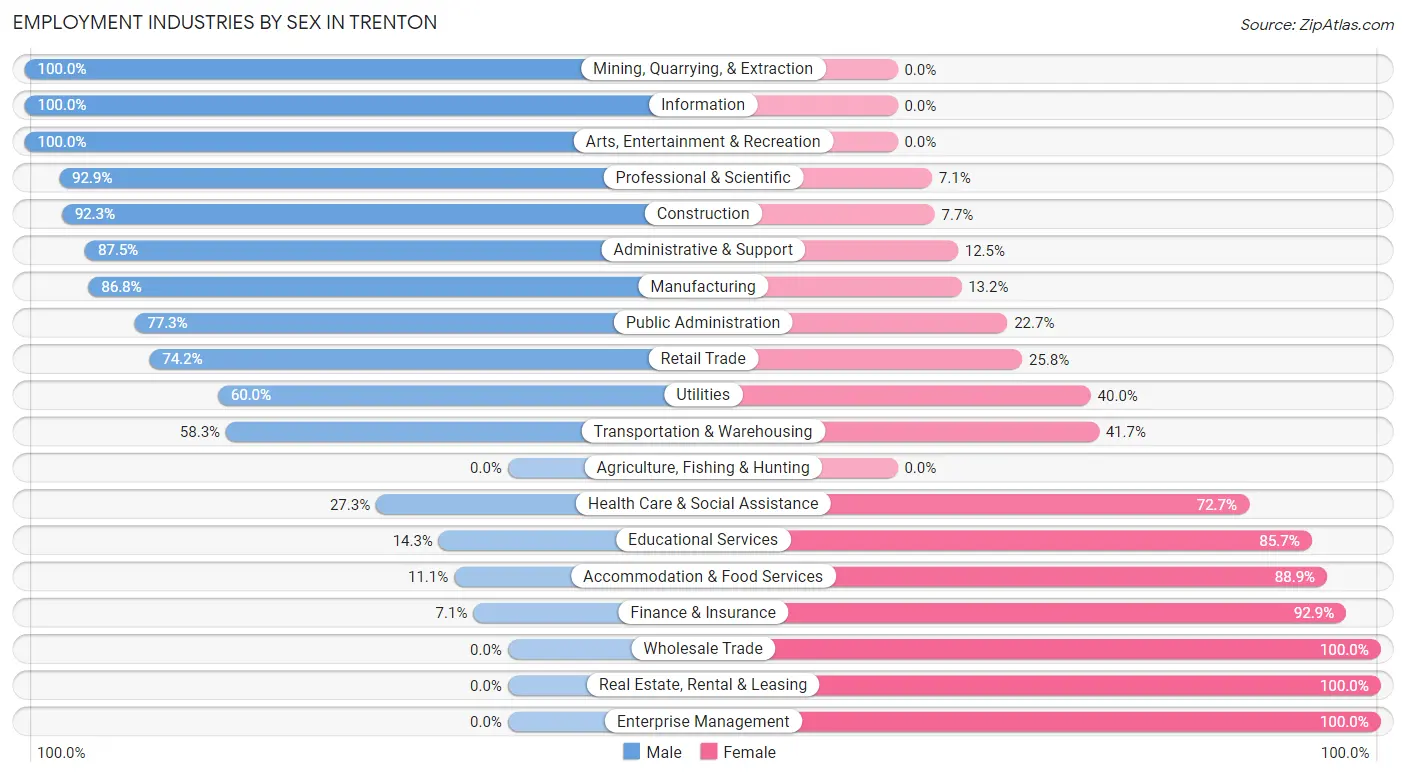
| Industry | Male | Female |
| Agriculture, Fishing & Hunting | 0 (0.0%) | 0 (0.0%) |
| Mining, Quarrying, & Extraction | 3 (100.0%) | 0 (0.0%) |
| Construction | 36 (92.3%) | 3 (7.7%) |
| Manufacturing | 46 (86.8%) | 7 (13.2%) |
| Wholesale Trade | 0 (0.0%) | 11 (100.0%) |
| Retail Trade | 23 (74.2%) | 8 (25.8%) |
| Transportation & Warehousing | 7 (58.3%) | 5 (41.7%) |
| Utilities | 6 (60.0%) | 4 (40.0%) |
| Information | 5 (100.0%) | 0 (0.0%) |
| Finance & Insurance | 2 (7.1%) | 26 (92.9%) |
| Real Estate, Rental & Leasing | 0 (0.0%) | 1 (100.0%) |
| Professional & Scientific | 13 (92.9%) | 1 (7.1%) |
| Enterprise Management | 0 (0.0%) | 3 (100.0%) |
| Administrative & Support | 7 (87.5%) | 1 (12.5%) |
| Educational Services | 5 (14.3%) | 30 (85.7%) |
| Health Care & Social Assistance | 9 (27.3%) | 24 (72.7%) |
| Arts, Entertainment & Recreation | 1 (100.0%) | 0 (0.0%) |
| Accommodation & Food Services | 1 (11.1%) | 8 (88.9%) |
| Public Administration | 17 (77.3%) | 5 (22.7%) |
| Total | 195 (58.4%) | 139 (41.6%) |
Education in Trenton
School Enrollment in Trenton
The most common levels of schooling among the 120 students in Trenton are elementary school (30 | 25.0%), middle school (29 | 24.2%), and college / undergraduate (24 | 20.0%).
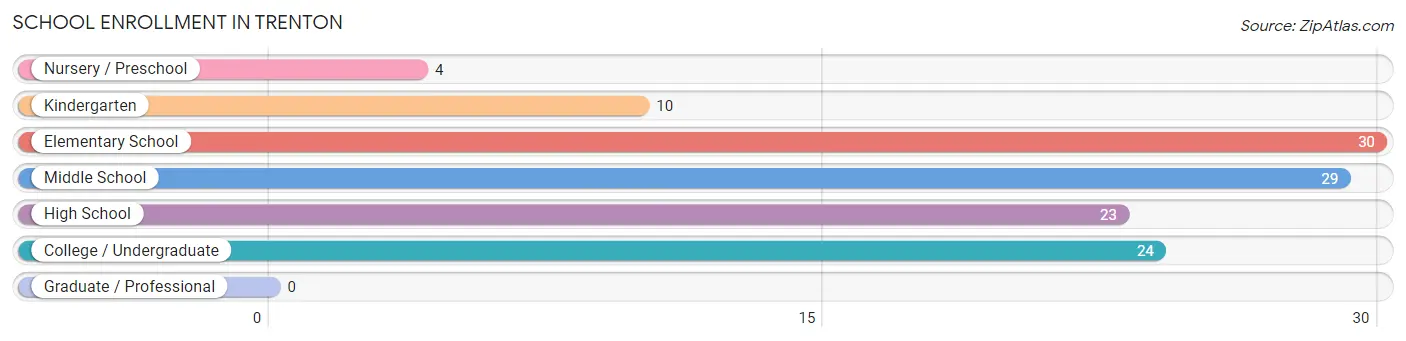
| School Level | # Students | % Students |
| Nursery / Preschool | 4 | 3.3% |
| Kindergarten | 10 | 8.3% |
| Elementary School | 30 | 25.0% |
| Middle School | 29 | 24.2% |
| High School | 23 | 19.2% |
| College / Undergraduate | 24 | 20.0% |
| Graduate / Professional | 0 | 0.0% |
| Total | 120 | 100.0% |
School Enrollment by Age by Funding Source in Trenton
Out of a total of 120 students who are enrolled in schools in Trenton, 14 (11.7%) attend a private institution, while the remaining 106 (88.3%) are enrolled in public schools. The age group of 15 to 17 year olds has the highest likelihood of being enrolled in private schools, with 3 (27.3% in the age bracket) enrolled. Conversely, the age group of 18 to 19 year olds has the lowest likelihood of being enrolled in a private school, with 16 (100.0% in the age bracket) attending a public institution.
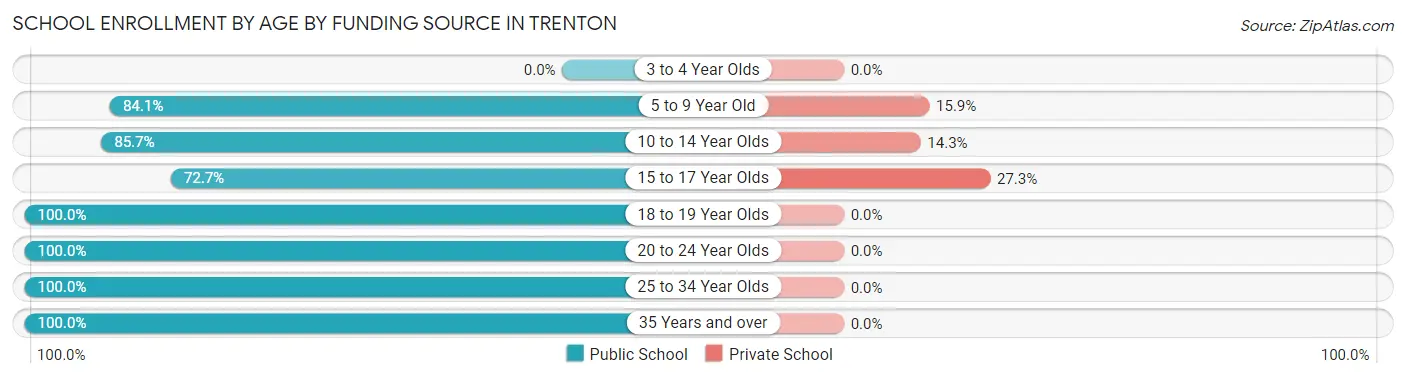
| Age Bracket | Public School | Private School |
| 3 to 4 Year Olds | 0 (0.0%) | 0 (0.0%) |
| 5 to 9 Year Old | 37 (84.1%) | 7 (15.9%) |
| 10 to 14 Year Olds | 24 (85.7%) | 4 (14.3%) |
| 15 to 17 Year Olds | 8 (72.7%) | 3 (27.3%) |
| 18 to 19 Year Olds | 16 (100.0%) | 0 (0.0%) |
| 20 to 24 Year Olds | 15 (100.0%) | 0 (0.0%) |
| 25 to 34 Year Olds | 4 (100.0%) | 0 (0.0%) |
| 35 Years and over | 2 (100.0%) | 0 (0.0%) |
| Total | 106 (88.3%) | 14 (11.7%) |
Educational Attainment by Field of Study in Trenton
Education (12 | 23.1%), science & technology (10 | 19.2%), multidisciplinary studies (7 | 13.5%), business (6 | 11.5%), and visual & performing arts (4 | 7.7%) are the most common fields of study among 52 individuals in Trenton who have obtained a bachelor's degree or higher.
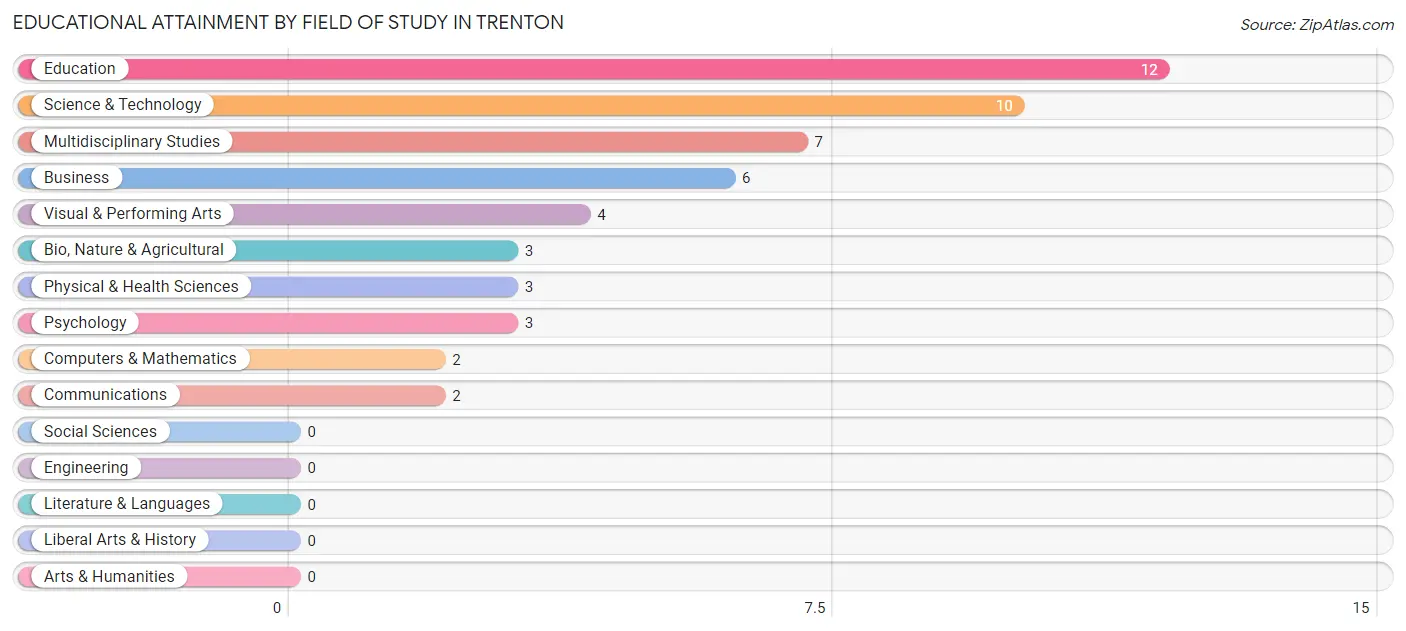
| Field of Study | # Graduates | % Graduates |
| Computers & Mathematics | 2 | 3.8% |
| Bio, Nature & Agricultural | 3 | 5.8% |
| Physical & Health Sciences | 3 | 5.8% |
| Psychology | 3 | 5.8% |
| Social Sciences | 0 | 0.0% |
| Engineering | 0 | 0.0% |
| Multidisciplinary Studies | 7 | 13.5% |
| Science & Technology | 10 | 19.2% |
| Business | 6 | 11.5% |
| Education | 12 | 23.1% |
| Literature & Languages | 0 | 0.0% |
| Liberal Arts & History | 0 | 0.0% |
| Visual & Performing Arts | 4 | 7.7% |
| Communications | 2 | 3.8% |
| Arts & Humanities | 0 | 0.0% |
| Total | 52 | 100.0% |
Transportation & Commute in Trenton
Vehicle Availability by Sex in Trenton
The most prevalent vehicle ownership categories in Trenton are males with 2 vehicles (81, accounting for 41.5%) and females with 2 vehicles (46, making up 58.3%).
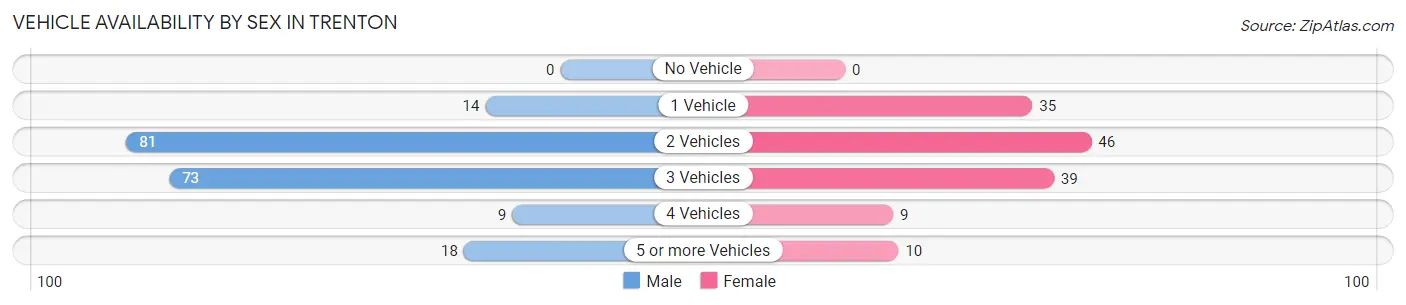
| Vehicles Available | Male | Female |
| No Vehicle | 0 (0.0%) | 0 (0.0%) |
| 1 Vehicle | 14 (7.2%) | 35 (25.2%) |
| 2 Vehicles | 81 (41.5%) | 46 (33.1%) |
| 3 Vehicles | 73 (37.4%) | 39 (28.1%) |
| 4 Vehicles | 9 (4.6%) | 9 (6.5%) |
| 5 or more Vehicles | 18 (9.2%) | 10 (7.2%) |
| Total | 195 (100.0%) | 139 (100.0%) |
Commute Time in Trenton
The most frequently occuring commute durations in Trenton are less than 5 minutes (62 commuters, 19.6%), 30 to 34 minutes (61 commuters, 19.3%), and 20 to 24 minutes (36 commuters, 11.4%).
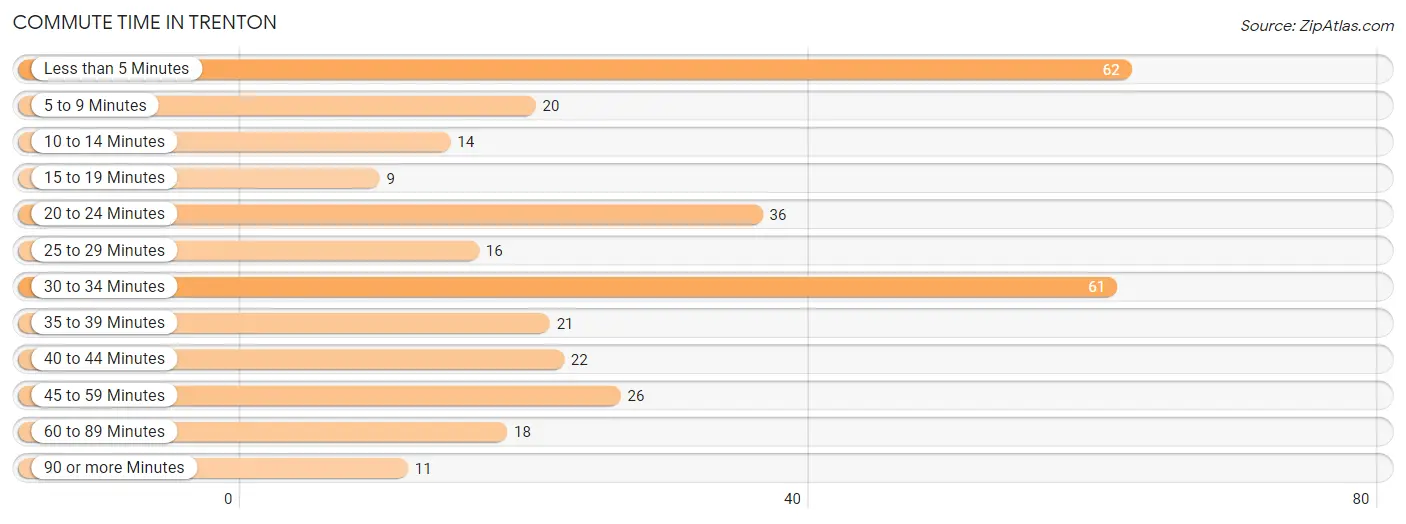
| Commute Time | # Commuters | % Commuters |
| Less than 5 Minutes | 62 | 19.6% |
| 5 to 9 Minutes | 20 | 6.3% |
| 10 to 14 Minutes | 14 | 4.4% |
| 15 to 19 Minutes | 9 | 2.9% |
| 20 to 24 Minutes | 36 | 11.4% |
| 25 to 29 Minutes | 16 | 5.1% |
| 30 to 34 Minutes | 61 | 19.3% |
| 35 to 39 Minutes | 21 | 6.7% |
| 40 to 44 Minutes | 22 | 7.0% |
| 45 to 59 Minutes | 26 | 8.2% |
| 60 to 89 Minutes | 18 | 5.7% |
| 90 or more Minutes | 11 | 3.5% |
Commute Time by Sex in Trenton
The most common commute times in Trenton are 30 to 34 minutes (37 commuters, 20.2%) for males and less than 5 minutes (33 commuters, 24.8%) for females.
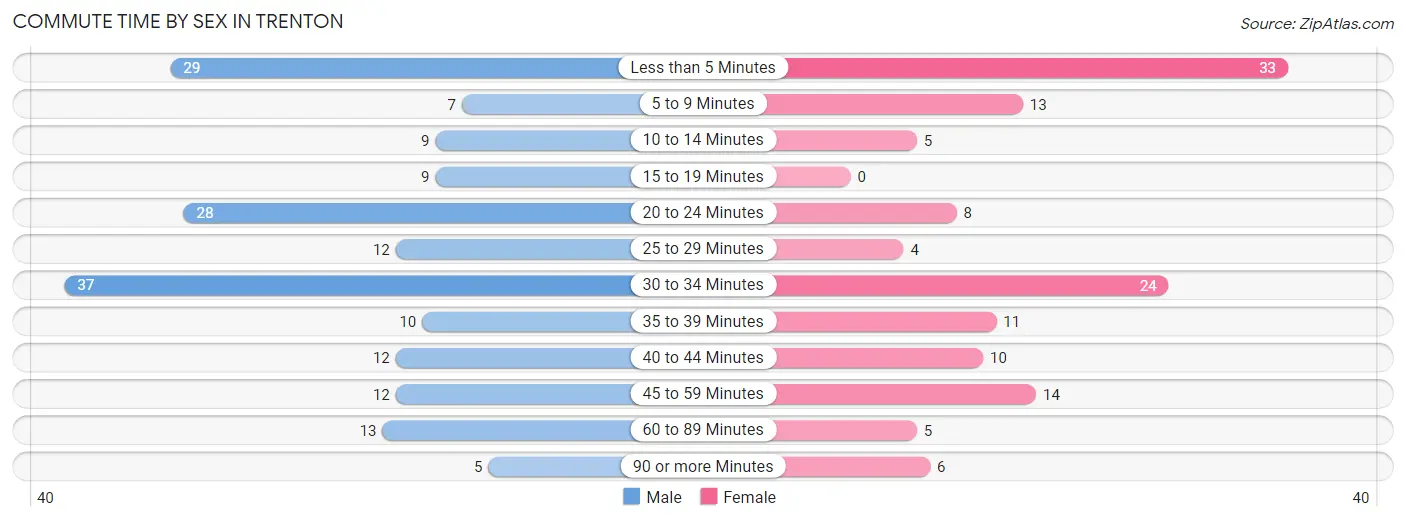
| Commute Time | Male | Female |
| Less than 5 Minutes | 29 (15.9%) | 33 (24.8%) |
| 5 to 9 Minutes | 7 (3.8%) | 13 (9.8%) |
| 10 to 14 Minutes | 9 (4.9%) | 5 (3.8%) |
| 15 to 19 Minutes | 9 (4.9%) | 0 (0.0%) |
| 20 to 24 Minutes | 28 (15.3%) | 8 (6.0%) |
| 25 to 29 Minutes | 12 (6.6%) | 4 (3.0%) |
| 30 to 34 Minutes | 37 (20.2%) | 24 (18.0%) |
| 35 to 39 Minutes | 10 (5.5%) | 11 (8.3%) |
| 40 to 44 Minutes | 12 (6.6%) | 10 (7.5%) |
| 45 to 59 Minutes | 12 (6.6%) | 14 (10.5%) |
| 60 to 89 Minutes | 13 (7.1%) | 5 (3.8%) |
| 90 or more Minutes | 5 (2.7%) | 6 (4.5%) |
Time of Departure to Work by Sex in Trenton
The most frequent times of departure to work in Trenton are 5:30 AM to 5:59 AM (33, 18.0%) for males and 7:00 AM to 7:29 AM (27, 20.3%) for females.
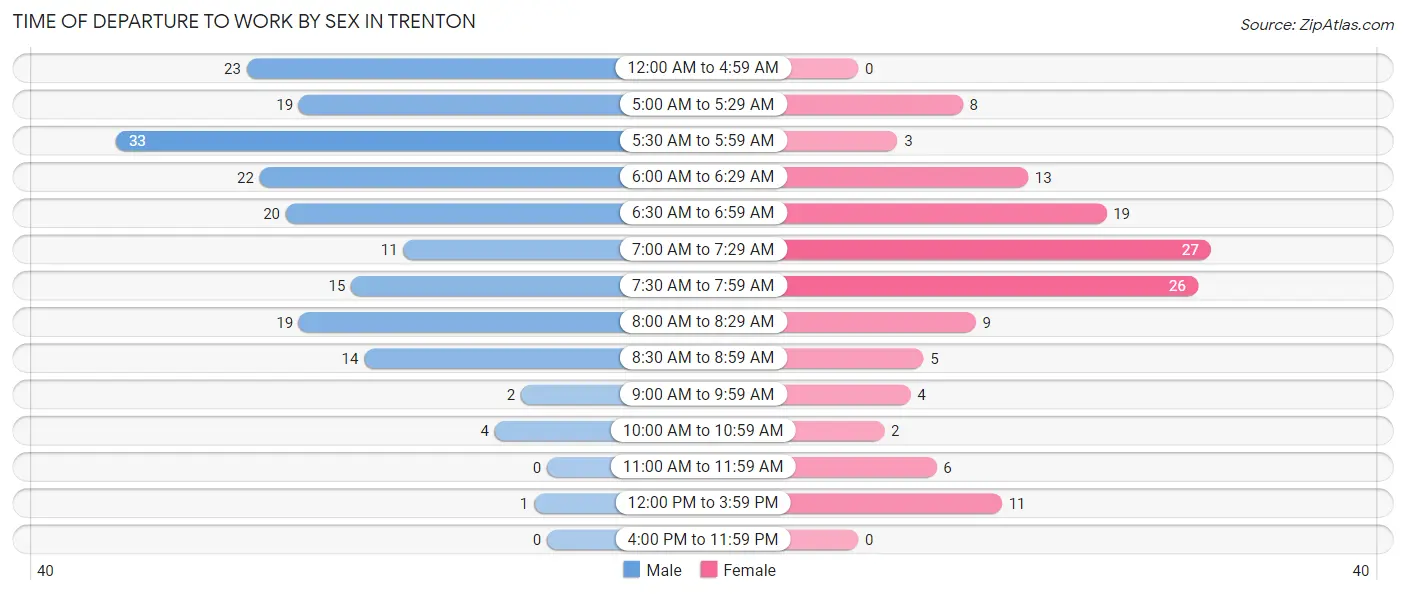
| Time of Departure | Male | Female |
| 12:00 AM to 4:59 AM | 23 (12.6%) | 0 (0.0%) |
| 5:00 AM to 5:29 AM | 19 (10.4%) | 8 (6.0%) |
| 5:30 AM to 5:59 AM | 33 (18.0%) | 3 (2.3%) |
| 6:00 AM to 6:29 AM | 22 (12.0%) | 13 (9.8%) |
| 6:30 AM to 6:59 AM | 20 (10.9%) | 19 (14.3%) |
| 7:00 AM to 7:29 AM | 11 (6.0%) | 27 (20.3%) |
| 7:30 AM to 7:59 AM | 15 (8.2%) | 26 (19.6%) |
| 8:00 AM to 8:29 AM | 19 (10.4%) | 9 (6.8%) |
| 8:30 AM to 8:59 AM | 14 (7.6%) | 5 (3.8%) |
| 9:00 AM to 9:59 AM | 2 (1.1%) | 4 (3.0%) |
| 10:00 AM to 10:59 AM | 4 (2.2%) | 2 (1.5%) |
| 11:00 AM to 11:59 AM | 0 (0.0%) | 6 (4.5%) |
| 12:00 PM to 3:59 PM | 1 (0.5%) | 11 (8.3%) |
| 4:00 PM to 11:59 PM | 0 (0.0%) | 0 (0.0%) |
| Total | 183 (100.0%) | 133 (100.0%) |
Housing Occupancy in Trenton
Occupancy by Ownership in Trenton
Of the total 256 dwellings in Trenton, owner-occupied units account for 201 (78.5%), while renter-occupied units make up 55 (21.5%).
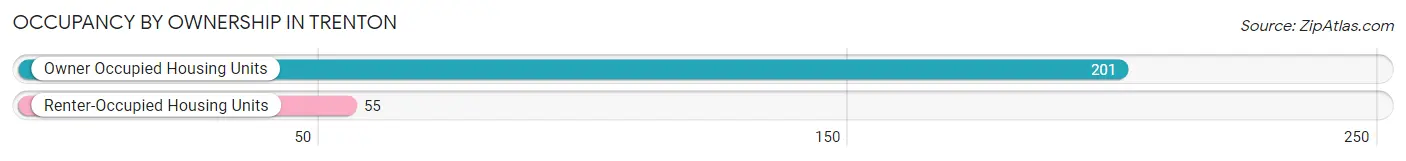
| Occupancy | # Housing Units | % Housing Units |
| Owner Occupied Housing Units | 201 | 78.5% |
| Renter-Occupied Housing Units | 55 | 21.5% |
| Total Occupied Housing Units | 256 | 100.0% |
Occupancy by Household Size in Trenton
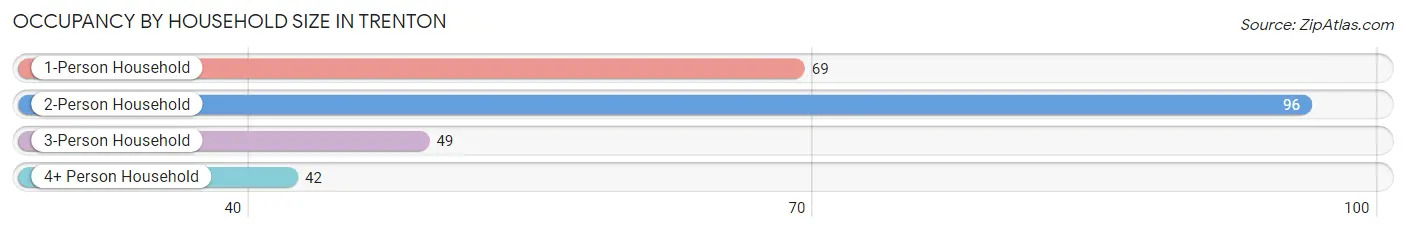
| Household Size | # Housing Units | % Housing Units |
| 1-Person Household | 69 | 27.0% |
| 2-Person Household | 96 | 37.5% |
| 3-Person Household | 49 | 19.1% |
| 4+ Person Household | 42 | 16.4% |
| Total Housing Units | 256 | 100.0% |
Occupancy by Ownership by Household Size in Trenton
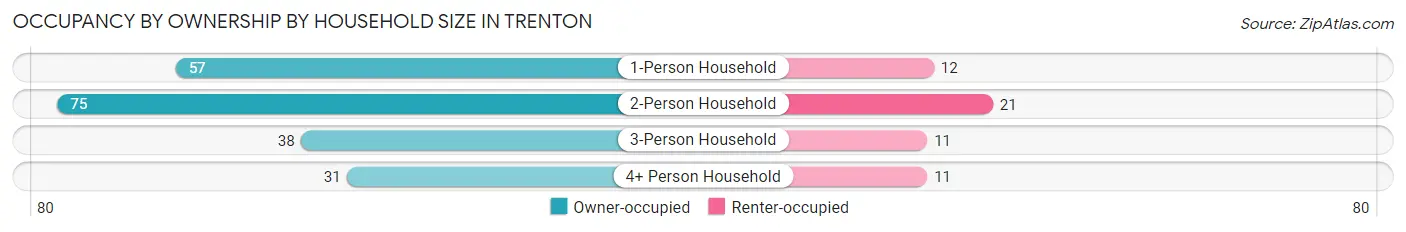
| Household Size | Owner-occupied | Renter-occupied |
| 1-Person Household | 57 (82.6%) | 12 (17.4%) |
| 2-Person Household | 75 (78.1%) | 21 (21.9%) |
| 3-Person Household | 38 (77.5%) | 11 (22.5%) |
| 4+ Person Household | 31 (73.8%) | 11 (26.2%) |
| Total Housing Units | 201 (78.5%) | 55 (21.5%) |
Occupancy by Educational Attainment in Trenton
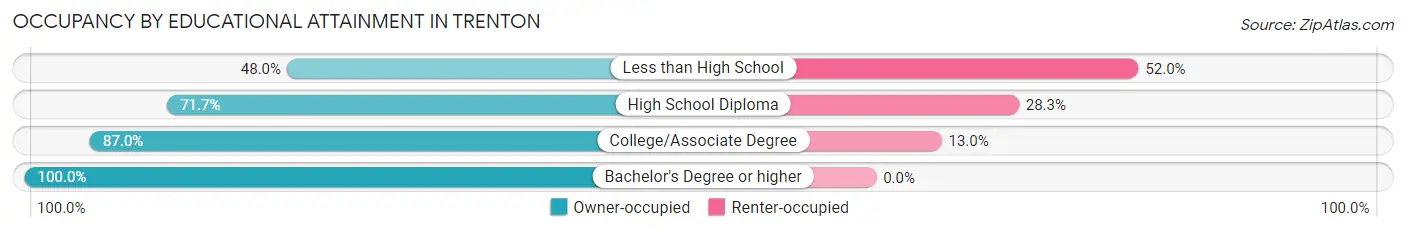
| Household Size | Owner-occupied | Renter-occupied |
| Less than High School | 12 (48.0%) | 13 (52.0%) |
| High School Diploma | 71 (71.7%) | 28 (28.3%) |
| College/Associate Degree | 94 (87.0%) | 14 (13.0%) |
| Bachelor's Degree or higher | 24 (100.0%) | 0 (0.0%) |
Occupancy by Age of Householder in Trenton
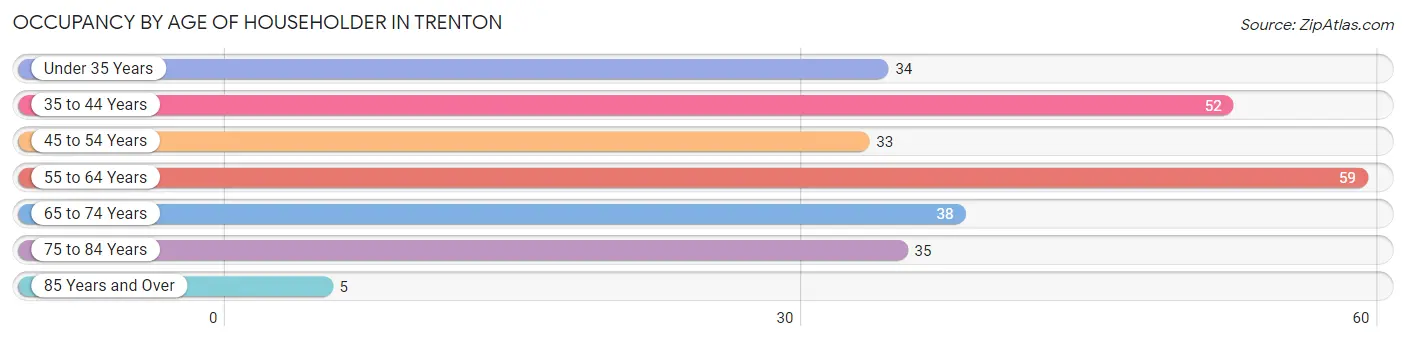
| Age Bracket | # Households | % Households |
| Under 35 Years | 34 | 13.3% |
| 35 to 44 Years | 52 | 20.3% |
| 45 to 54 Years | 33 | 12.9% |
| 55 to 64 Years | 59 | 23.1% |
| 65 to 74 Years | 38 | 14.8% |
| 75 to 84 Years | 35 | 13.7% |
| 85 Years and Over | 5 | 1.9% |
| Total | 256 | 100.0% |
Housing Finances in Trenton
Median Income by Occupancy in Trenton
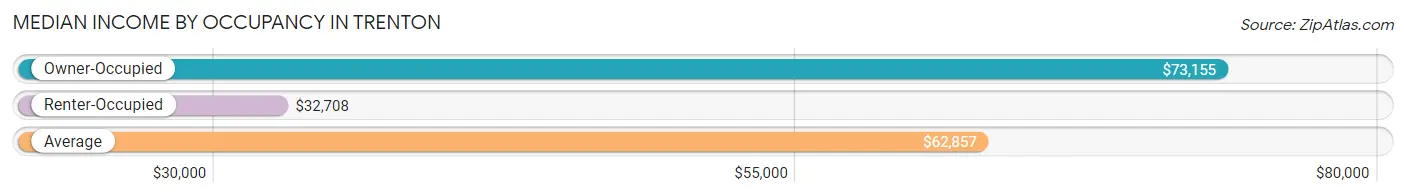
| Occupancy Type | # Households | Median Income |
| Owner-Occupied | 201 (78.5%) | $73,155 |
| Renter-Occupied | 55 (21.5%) | $32,708 |
| Average | 256 (100.0%) | $62,857 |
Occupancy by Householder Income Bracket in Trenton
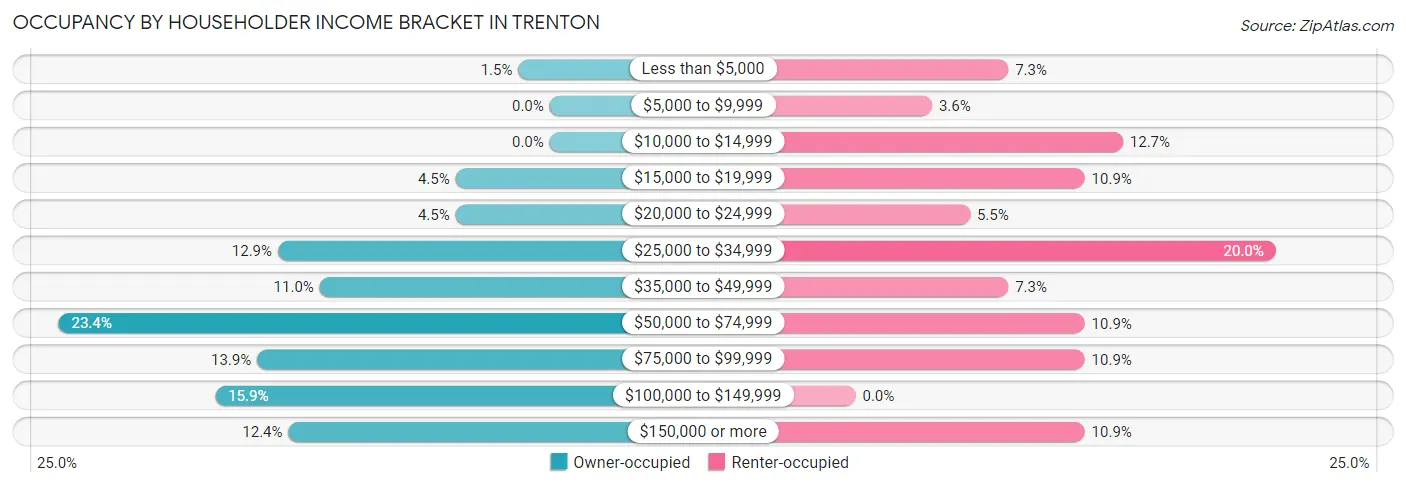
| Income Bracket | Owner-occupied | Renter-occupied |
| Less than $5,000 | 3 (1.5%) | 4 (7.3%) |
| $5,000 to $9,999 | 0 (0.0%) | 2 (3.6%) |
| $10,000 to $14,999 | 0 (0.0%) | 7 (12.7%) |
| $15,000 to $19,999 | 9 (4.5%) | 6 (10.9%) |
| $20,000 to $24,999 | 9 (4.5%) | 3 (5.4%) |
| $25,000 to $34,999 | 26 (12.9%) | 11 (20.0%) |
| $35,000 to $49,999 | 22 (11.0%) | 4 (7.3%) |
| $50,000 to $74,999 | 47 (23.4%) | 6 (10.9%) |
| $75,000 to $99,999 | 28 (13.9%) | 6 (10.9%) |
| $100,000 to $149,999 | 32 (15.9%) | 0 (0.0%) |
| $150,000 or more | 25 (12.4%) | 6 (10.9%) |
| Total | 201 (100.0%) | 55 (100.0%) |
Monthly Housing Cost Tiers in Trenton
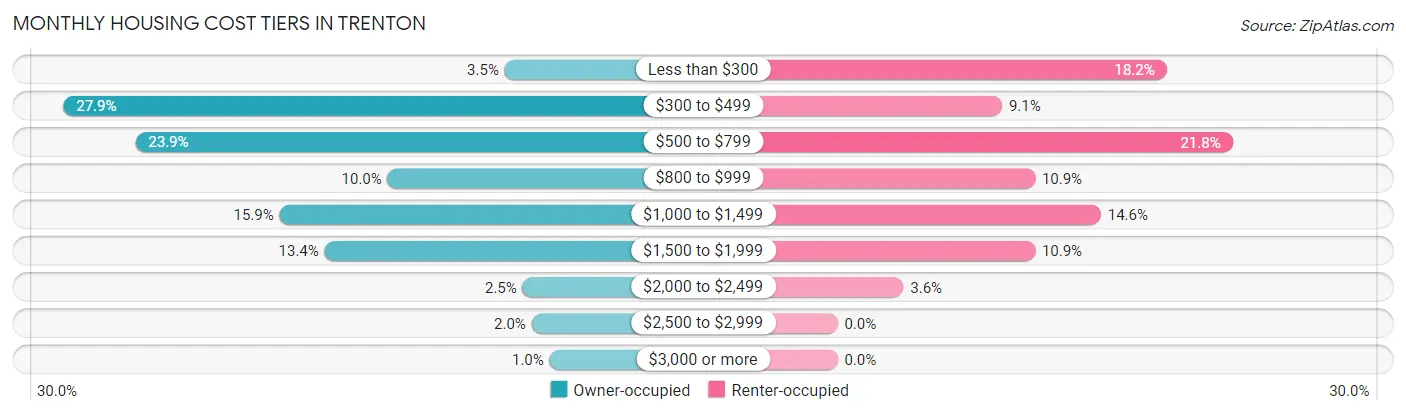
| Monthly Cost | Owner-occupied | Renter-occupied |
| Less than $300 | 7 (3.5%) | 10 (18.2%) |
| $300 to $499 | 56 (27.9%) | 5 (9.1%) |
| $500 to $799 | 48 (23.9%) | 12 (21.8%) |
| $800 to $999 | 20 (10.0%) | 6 (10.9%) |
| $1,000 to $1,499 | 32 (15.9%) | 8 (14.5%) |
| $1,500 to $1,999 | 27 (13.4%) | 6 (10.9%) |
| $2,000 to $2,499 | 5 (2.5%) | 2 (3.6%) |
| $2,500 to $2,999 | 4 (2.0%) | 0 (0.0%) |
| $3,000 or more | 2 (1.0%) | 0 (0.0%) |
| Total | 201 (100.0%) | 55 (100.0%) |
Physical Housing Characteristics in Trenton
Housing Structures in Trenton
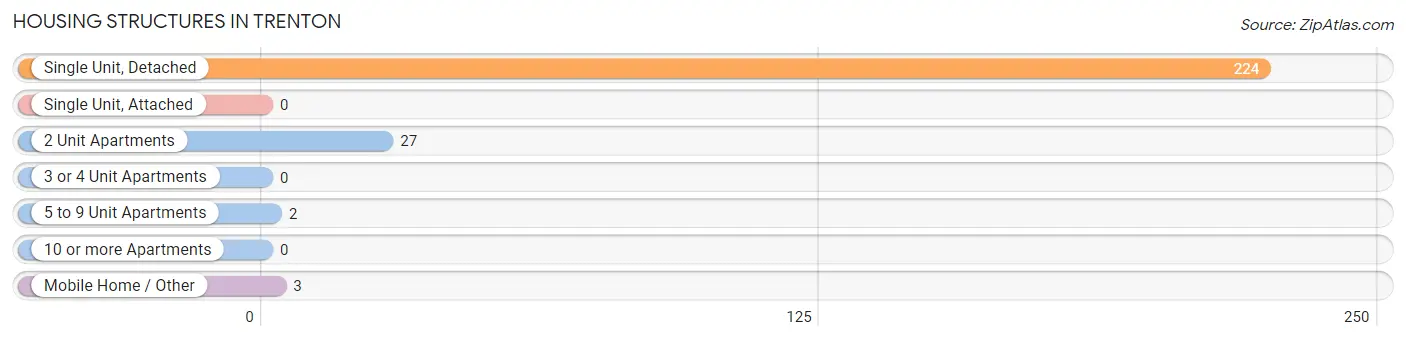
| Structure Type | # Housing Units | % Housing Units |
| Single Unit, Detached | 224 | 87.5% |
| Single Unit, Attached | 0 | 0.0% |
| 2 Unit Apartments | 27 | 10.5% |
| 3 or 4 Unit Apartments | 0 | 0.0% |
| 5 to 9 Unit Apartments | 2 | 0.8% |
| 10 or more Apartments | 0 | 0.0% |
| Mobile Home / Other | 3 | 1.2% |
| Total | 256 | 100.0% |
Housing Structures by Occupancy in Trenton
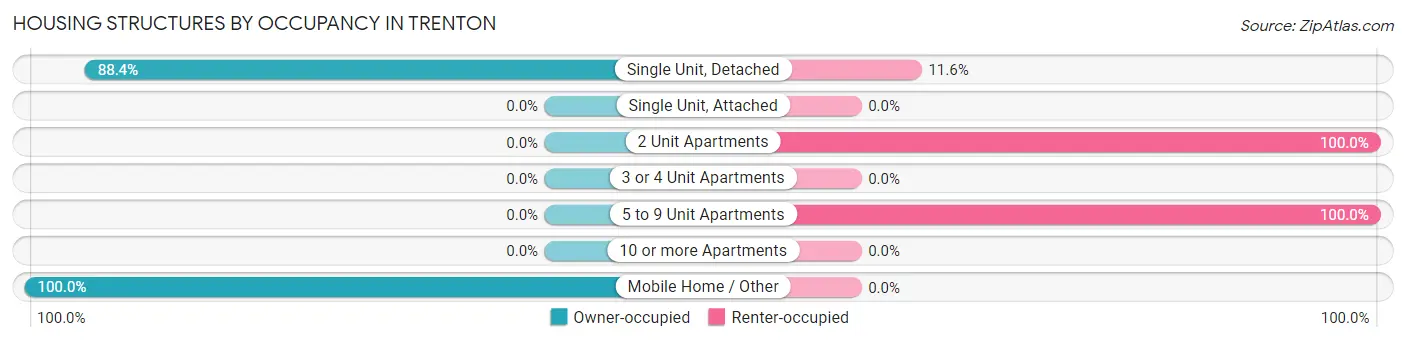
| Structure Type | Owner-occupied | Renter-occupied |
| Single Unit, Detached | 198 (88.4%) | 26 (11.6%) |
| Single Unit, Attached | 0 (0.0%) | 0 (0.0%) |
| 2 Unit Apartments | 0 (0.0%) | 27 (100.0%) |
| 3 or 4 Unit Apartments | 0 (0.0%) | 0 (0.0%) |
| 5 to 9 Unit Apartments | 0 (0.0%) | 2 (100.0%) |
| 10 or more Apartments | 0 (0.0%) | 0 (0.0%) |
| Mobile Home / Other | 3 (100.0%) | 0 (0.0%) |
| Total | 201 (78.5%) | 55 (21.5%) |
Housing Structures by Number of Rooms in Trenton
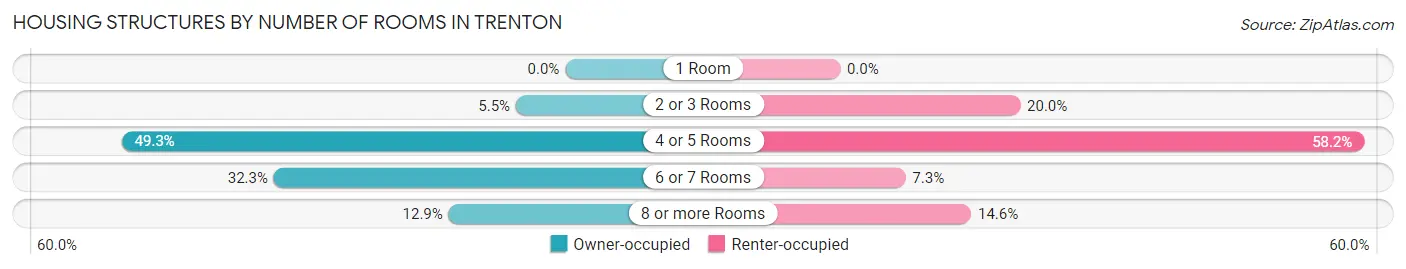
| Number of Rooms | Owner-occupied | Renter-occupied |
| 1 Room | 0 (0.0%) | 0 (0.0%) |
| 2 or 3 Rooms | 11 (5.5%) | 11 (20.0%) |
| 4 or 5 Rooms | 99 (49.2%) | 32 (58.2%) |
| 6 or 7 Rooms | 65 (32.3%) | 4 (7.3%) |
| 8 or more Rooms | 26 (12.9%) | 8 (14.5%) |
| Total | 201 (100.0%) | 55 (100.0%) |
Housing Structure by Heating Type in Trenton
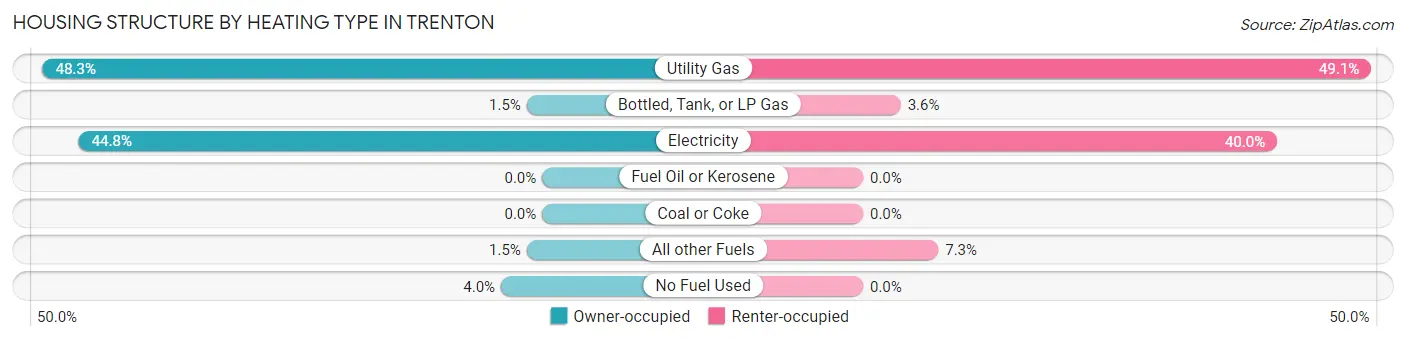
| Heating Type | Owner-occupied | Renter-occupied |
| Utility Gas | 97 (48.3%) | 27 (49.1%) |
| Bottled, Tank, or LP Gas | 3 (1.5%) | 2 (3.6%) |
| Electricity | 90 (44.8%) | 22 (40.0%) |
| Fuel Oil or Kerosene | 0 (0.0%) | 0 (0.0%) |
| Coal or Coke | 0 (0.0%) | 0 (0.0%) |
| All other Fuels | 3 (1.5%) | 4 (7.3%) |
| No Fuel Used | 8 (4.0%) | 0 (0.0%) |
| Total | 201 (100.0%) | 55 (100.0%) |
Household Vehicle Usage in Trenton
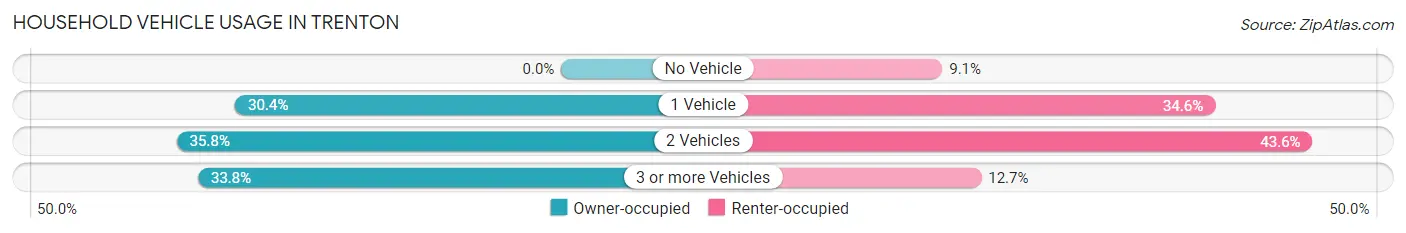
| Vehicles per Household | Owner-occupied | Renter-occupied |
| No Vehicle | 0 (0.0%) | 5 (9.1%) |
| 1 Vehicle | 61 (30.3%) | 19 (34.5%) |
| 2 Vehicles | 72 (35.8%) | 24 (43.6%) |
| 3 or more Vehicles | 68 (33.8%) | 7 (12.7%) |
| Total | 201 (100.0%) | 55 (100.0%) |
Real Estate & Mortgages in Trenton
Real Estate and Mortgage Overview in Trenton
| Characteristic | Without Mortgage | With Mortgage |
| Housing Units | 108 | 93 |
| Median Property Value | $107,000 | $162,500 |
| Median Household Income | $50,250 | $12 |
| Monthly Housing Costs | $468 | $2 |
| Real Estate Taxes | $1,360 | $2 |
Property Value by Mortgage Status in Trenton
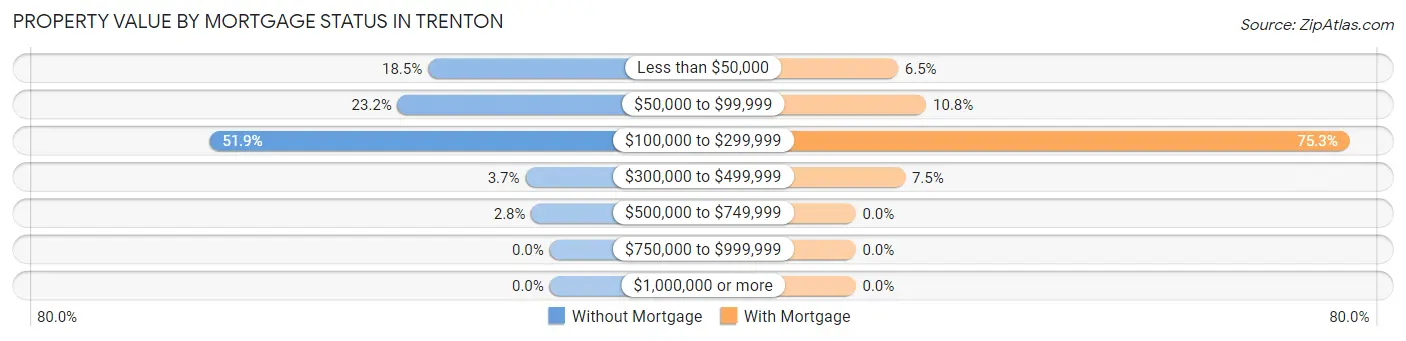
| Property Value | Without Mortgage | With Mortgage |
| Less than $50,000 | 20 (18.5%) | 6 (6.5%) |
| $50,000 to $99,999 | 25 (23.2%) | 10 (10.7%) |
| $100,000 to $299,999 | 56 (51.8%) | 70 (75.3%) |
| $300,000 to $499,999 | 4 (3.7%) | 7 (7.5%) |
| $500,000 to $749,999 | 3 (2.8%) | 0 (0.0%) |
| $750,000 to $999,999 | 0 (0.0%) | 0 (0.0%) |
| $1,000,000 or more | 0 (0.0%) | 0 (0.0%) |
| Total | 108 (100.0%) | 93 (100.0%) |
Household Income by Mortgage Status in Trenton
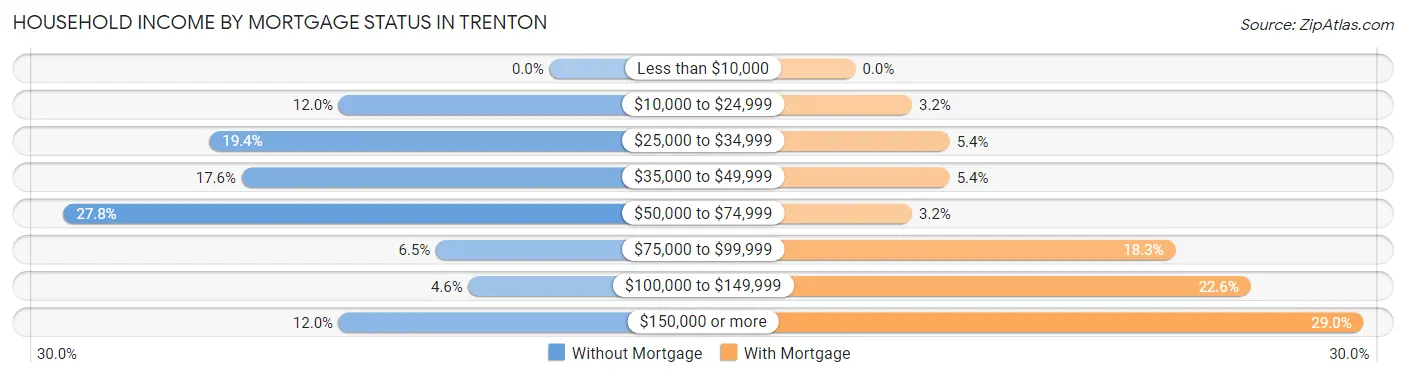
| Household Income | Without Mortgage | With Mortgage |
| Less than $10,000 | 0 (0.0%) | 0 (0.0%) |
| $10,000 to $24,999 | 13 (12.0%) | 3 (3.2%) |
| $25,000 to $34,999 | 21 (19.4%) | 5 (5.4%) |
| $35,000 to $49,999 | 19 (17.6%) | 5 (5.4%) |
| $50,000 to $74,999 | 30 (27.8%) | 3 (3.2%) |
| $75,000 to $99,999 | 7 (6.5%) | 17 (18.3%) |
| $100,000 to $149,999 | 5 (4.6%) | 21 (22.6%) |
| $150,000 or more | 13 (12.0%) | 27 (29.0%) |
| Total | 108 (100.0%) | 93 (100.0%) |
Property Value to Household Income Ratio in Trenton
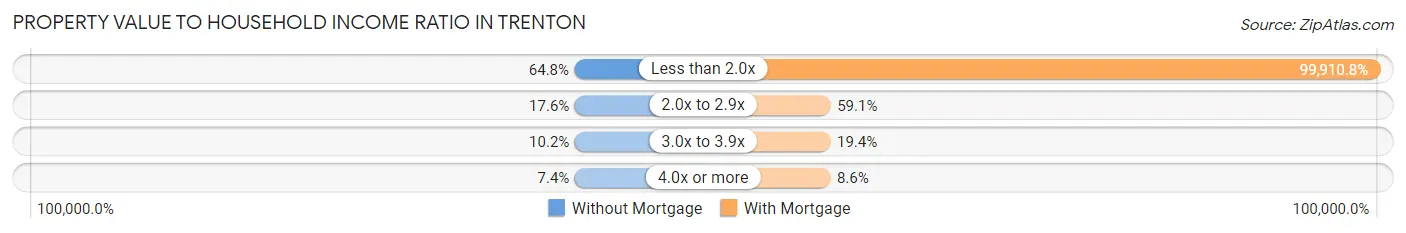
| Value-to-Income Ratio | Without Mortgage | With Mortgage |
| Less than 2.0x | 70 (64.8%) | 92,917 (99,910.7%) |
| 2.0x to 2.9x | 19 (17.6%) | 55 (59.1%) |
| 3.0x to 3.9x | 11 (10.2%) | 18 (19.4%) |
| 4.0x or more | 8 (7.4%) | 8 (8.6%) |
| Total | 108 (100.0%) | 93 (100.0%) |
Real Estate Taxes by Mortgage Status in Trenton
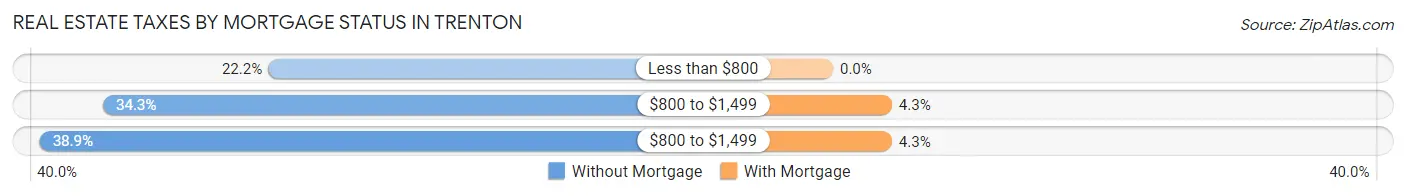
| Property Taxes | Without Mortgage | With Mortgage |
| Less than $800 | 24 (22.2%) | 0 (0.0%) |
| $800 to $1,499 | 37 (34.3%) | 4 (4.3%) |
| $800 to $1,499 | 42 (38.9%) | 4 (4.3%) |
| Total | 108 (100.0%) | 93 (100.0%) |
Health & Disability in Trenton
Health Insurance Coverage by Age in Trenton
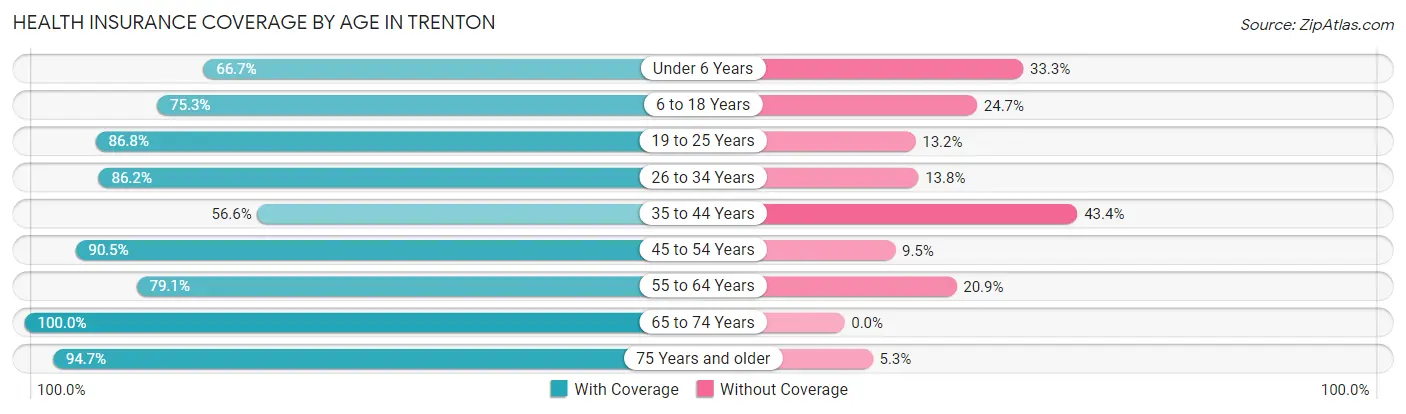
| Age Bracket | With Coverage | Without Coverage |
| Under 6 Years | 18 (66.7%) | 9 (33.3%) |
| 6 to 18 Years | 67 (75.3%) | 22 (24.7%) |
| 19 to 25 Years | 59 (86.8%) | 9 (13.2%) |
| 26 to 34 Years | 50 (86.2%) | 8 (13.8%) |
| 35 to 44 Years | 69 (56.6%) | 53 (43.4%) |
| 45 to 54 Years | 67 (90.5%) | 7 (9.5%) |
| 55 to 64 Years | 72 (79.1%) | 19 (20.9%) |
| 65 to 74 Years | 50 (100.0%) | 0 (0.0%) |
| 75 Years and older | 54 (94.7%) | 3 (5.3%) |
| Total | 506 (79.6%) | 130 (20.4%) |
Health Insurance Coverage by Citizenship Status in Trenton
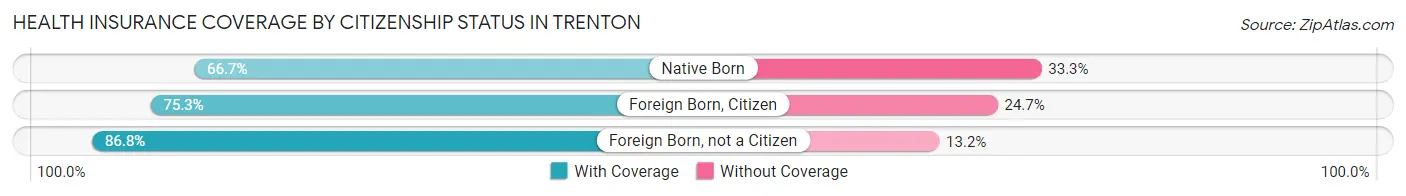
| Citizenship Status | With Coverage | Without Coverage |
| Native Born | 18 (66.7%) | 9 (33.3%) |
| Foreign Born, Citizen | 67 (75.3%) | 22 (24.7%) |
| Foreign Born, not a Citizen | 59 (86.8%) | 9 (13.2%) |
Health Insurance Coverage by Household Income in Trenton
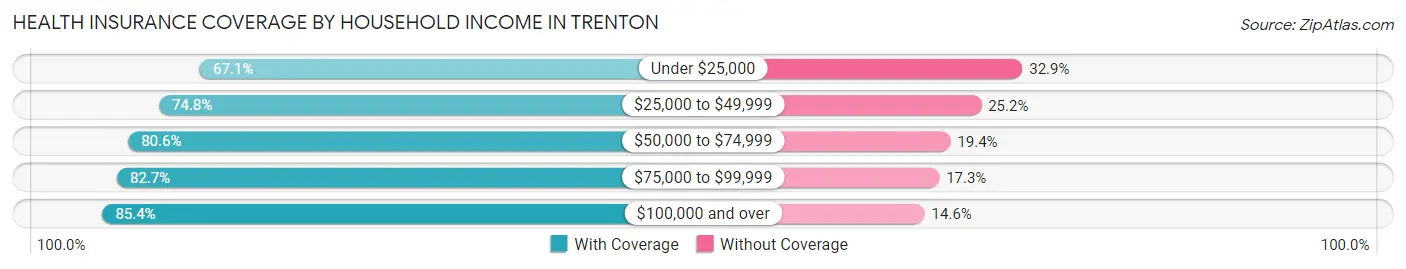
| Household Income | With Coverage | Without Coverage |
| Under $25,000 | 49 (67.1%) | 24 (32.9%) |
| $25,000 to $49,999 | 101 (74.8%) | 34 (25.2%) |
| $50,000 to $74,999 | 112 (80.6%) | 27 (19.4%) |
| $75,000 to $99,999 | 86 (82.7%) | 18 (17.3%) |
| $100,000 and over | 158 (85.4%) | 27 (14.6%) |
Public vs Private Health Insurance Coverage by Age in Trenton
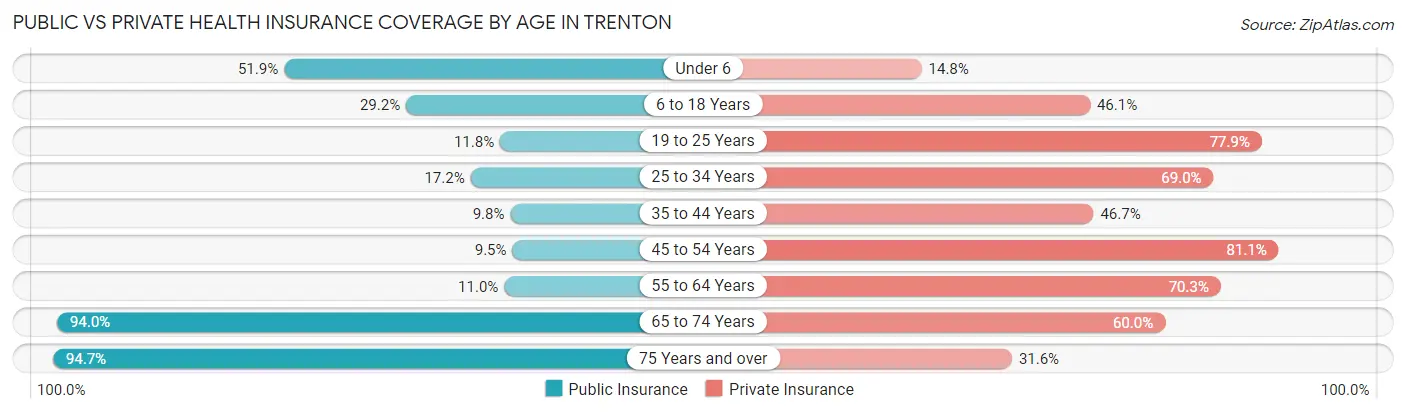
| Age Bracket | Public Insurance | Private Insurance |
| Under 6 | 14 (51.8%) | 4 (14.8%) |
| 6 to 18 Years | 26 (29.2%) | 41 (46.1%) |
| 19 to 25 Years | 8 (11.8%) | 53 (77.9%) |
| 25 to 34 Years | 10 (17.2%) | 40 (69.0%) |
| 35 to 44 Years | 12 (9.8%) | 57 (46.7%) |
| 45 to 54 Years | 7 (9.5%) | 60 (81.1%) |
| 55 to 64 Years | 10 (11.0%) | 64 (70.3%) |
| 65 to 74 Years | 47 (94.0%) | 30 (60.0%) |
| 75 Years and over | 54 (94.7%) | 18 (31.6%) |
| Total | 188 (29.6%) | 367 (57.7%) |
Disability Status by Sex by Age in Trenton
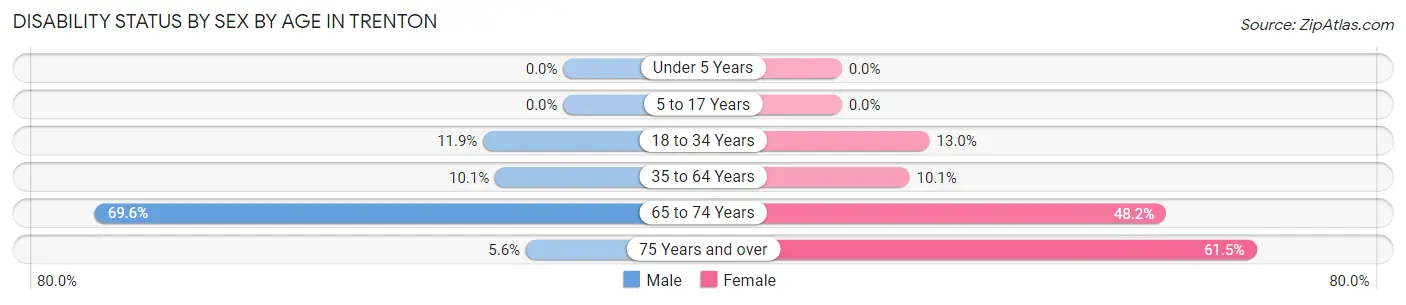
| Age Bracket | Male | Female |
| Under 5 Years | 0 (0.0%) | 0 (0.0%) |
| 5 to 17 Years | 0 (0.0%) | 0 (0.0%) |
| 18 to 34 Years | 10 (11.9%) | 6 (13.0%) |
| 35 to 64 Years | 14 (10.1%) | 15 (10.1%) |
| 65 to 74 Years | 16 (69.6%) | 13 (48.1%) |
| 75 Years and over | 1 (5.6%) | 24 (61.5%) |
Disability Class by Sex by Age in Trenton
Disability Class: Hearing Difficulty
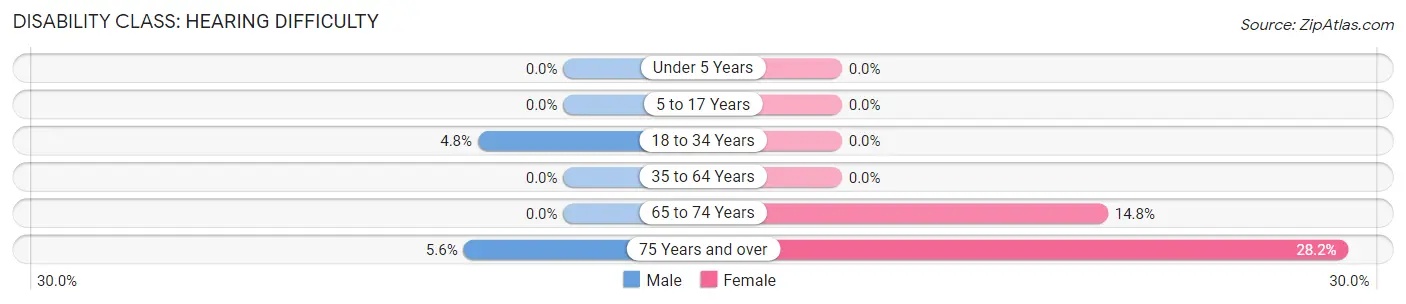
| Age Bracket | Male | Female |
| Under 5 Years | 0 (0.0%) | 0 (0.0%) |
| 5 to 17 Years | 0 (0.0%) | 0 (0.0%) |
| 18 to 34 Years | 4 (4.8%) | 0 (0.0%) |
| 35 to 64 Years | 0 (0.0%) | 0 (0.0%) |
| 65 to 74 Years | 0 (0.0%) | 4 (14.8%) |
| 75 Years and over | 1 (5.6%) | 11 (28.2%) |
Disability Class: Vision Difficulty
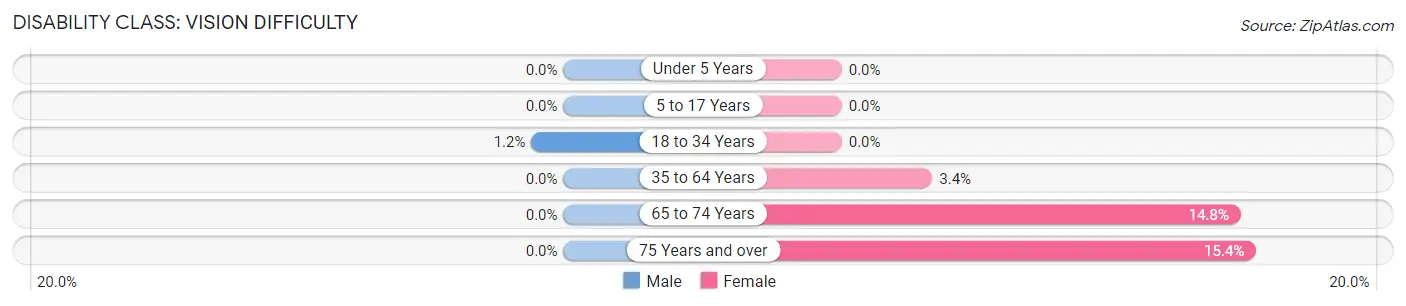
| Age Bracket | Male | Female |
| Under 5 Years | 0 (0.0%) | 0 (0.0%) |
| 5 to 17 Years | 0 (0.0%) | 0 (0.0%) |
| 18 to 34 Years | 1 (1.2%) | 0 (0.0%) |
| 35 to 64 Years | 0 (0.0%) | 5 (3.4%) |
| 65 to 74 Years | 0 (0.0%) | 4 (14.8%) |
| 75 Years and over | 0 (0.0%) | 6 (15.4%) |
Disability Class: Cognitive Difficulty
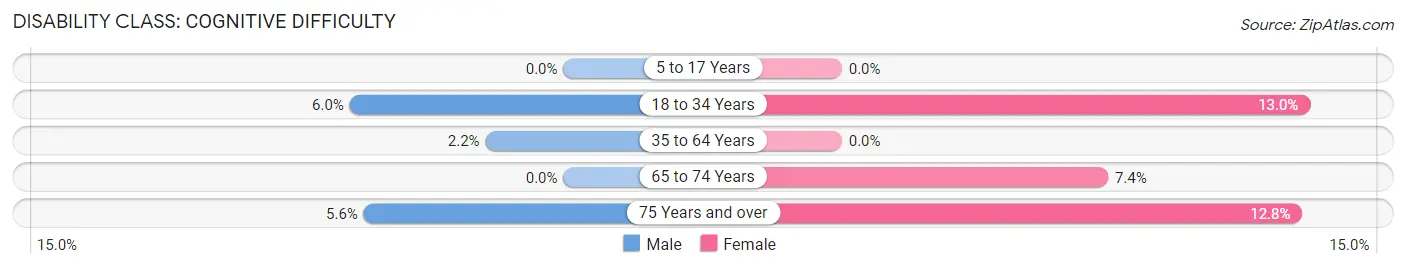
| Age Bracket | Male | Female |
| 5 to 17 Years | 0 (0.0%) | 0 (0.0%) |
| 18 to 34 Years | 5 (5.9%) | 6 (13.0%) |
| 35 to 64 Years | 3 (2.2%) | 0 (0.0%) |
| 65 to 74 Years | 0 (0.0%) | 2 (7.4%) |
| 75 Years and over | 1 (5.6%) | 5 (12.8%) |
Disability Class: Ambulatory Difficulty
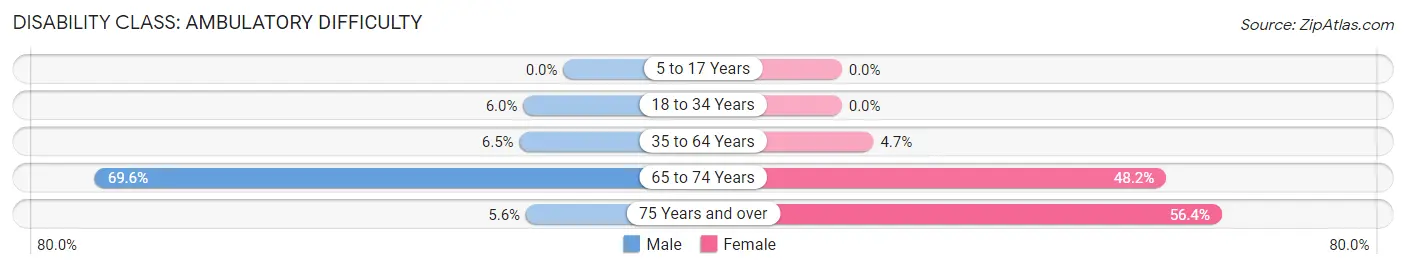
| Age Bracket | Male | Female |
| 5 to 17 Years | 0 (0.0%) | 0 (0.0%) |
| 18 to 34 Years | 5 (5.9%) | 0 (0.0%) |
| 35 to 64 Years | 9 (6.5%) | 7 (4.7%) |
| 65 to 74 Years | 16 (69.6%) | 13 (48.1%) |
| 75 Years and over | 1 (5.6%) | 22 (56.4%) |
Disability Class: Self-Care Difficulty
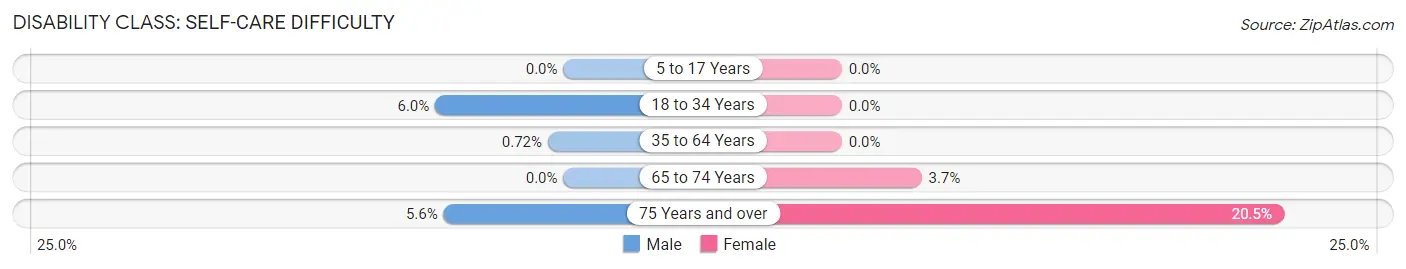
| Age Bracket | Male | Female |
| 5 to 17 Years | 0 (0.0%) | 0 (0.0%) |
| 18 to 34 Years | 5 (5.9%) | 0 (0.0%) |
| 35 to 64 Years | 1 (0.7%) | 0 (0.0%) |
| 65 to 74 Years | 0 (0.0%) | 1 (3.7%) |
| 75 Years and over | 1 (5.6%) | 8 (20.5%) |
Technology Access in Trenton
Computing Device Access in Trenton
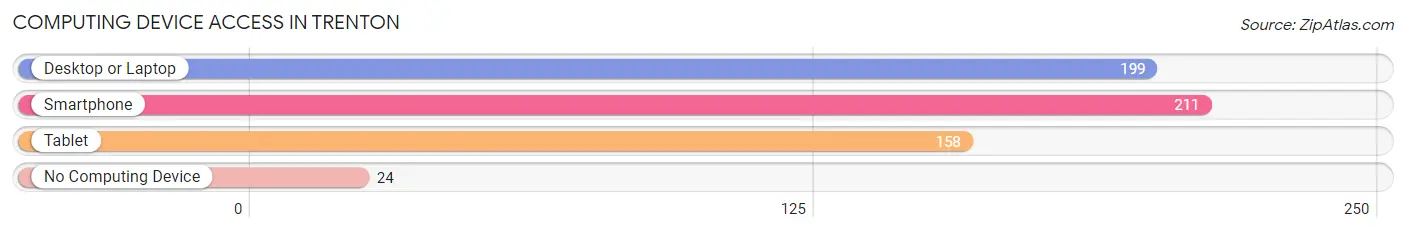
| Device Type | # Households | % Households |
| Desktop or Laptop | 199 | 77.7% |
| Smartphone | 211 | 82.4% |
| Tablet | 158 | 61.7% |
| No Computing Device | 24 | 9.4% |
| Total | 256 | 100.0% |
Internet Access in Trenton
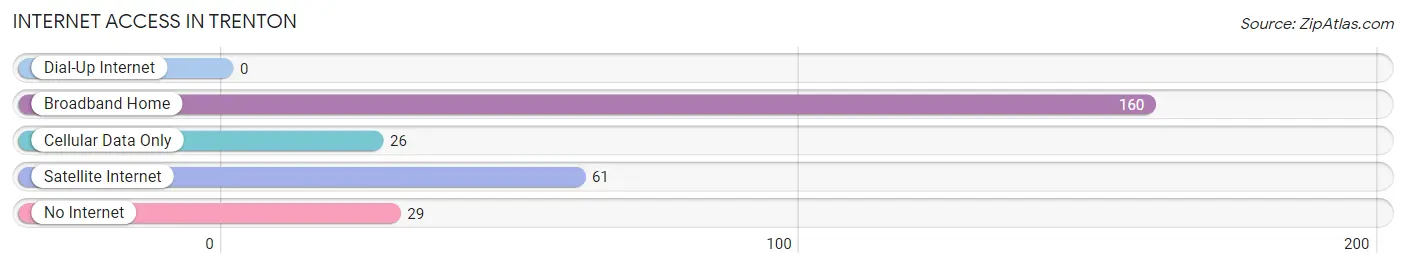
| Internet Type | # Households | % Households |
| Dial-Up Internet | 0 | 0.0% |
| Broadband Home | 160 | 62.5% |
| Cellular Data Only | 26 | 10.2% |
| Satellite Internet | 61 | 23.8% |
| No Internet | 29 | 11.3% |
| Total | 256 | 100.0% |
Trenton Summary
Trenton is a small city located in Fannin County, Texas, United States. It is situated in the northeast corner of the state, near the Oklahoma border. The population was 1,845 at the 2010 census.
History
Trenton was founded in 1876 by a group of settlers from Tennessee. The town was named after the capital of Tennessee, and the settlers hoped to recreate the same atmosphere in their new home. The town was incorporated in 1882 and quickly grew to become a thriving agricultural center.
The town was also home to a number of businesses, including a cotton gin, a grist mill, and a blacksmith shop. The town also had a school, a post office, and a number of churches.
In the early 1900s, Trenton began to experience a decline in population as many of its residents moved away to larger cities. The Great Depression also had a negative impact on the town, and by the 1940s, the population had dropped to just over 500.
Geography
Trenton is located at 33°37'25" North, 95°45'45" West (33.623861, -95.762490). It is situated in the northeast corner of Texas, near the Oklahoma border. The city is located in the Red River Valley, and is surrounded by rolling hills and wooded areas.
The climate in Trenton is generally mild, with hot summers and cool winters. The average annual temperature is around 68°F (20°C). The average annual precipitation is around 37 inches (94 cm).
Economy
Trenton's economy is largely based on agriculture. The town is home to a number of farms, which produce a variety of crops, including cotton, corn, soybeans, and wheat. The town also has a number of businesses, including a lumber yard, a feed store, and a hardware store.
Demographics
As of the 2010 census, there were 1,845 people, 717 households, and 486 families residing in Trenton. The population density was 1,092.3 people per square mile (422.2/km2). The racial makeup of the city was 87.2% White, 0.3% African American, 0.7% Native American, 0.2% Asian, 0.1% Pacific Islander, 9.7% from other races, and 1.8% from two or more races. Hispanic or Latino of any race were 18.2% of the population.
The median income for a household in Trenton was $31,250, and the median income for a family was $37,500. Males had a median income of $30,000 versus $20,000 for females. The per capita income for the city was $15,845. About 14.2% of families and 17.2% of the population were below the poverty line, including 22.2% of those under age 18 and 14.3% of those age 65 or over.
Common Questions
What is Per Capita Income in Trenton?
Per Capita income in Trenton is $31,046.
What is the Median Family Income in Trenton?
Median Family Income in Trenton is $73,533.
What is the Median Household income in Trenton?
Median Household Income in Trenton is $62,857.
What is Income or Wage Gap in Trenton?
Income or Wage Gap in Trenton is 4.3%.
Women in Trenton earn 95.7 cents for every dollar earned by a man.
What is Family Income Deficit in Trenton?
Family Income Deficit in Trenton is $8,757.
Families that are below poverty line in Trenton earn $8,757 less on average than the poverty threshold level.
What is Inequality or Gini Index in Trenton?
Inequality or Gini Index in Trenton is 0.40.
What is the Total Population of Trenton?
Total Population of Trenton is 636.
What is the Total Male Population of Trenton?
Total Male Population of Trenton is 300.
What is the Total Female Population of Trenton?
Total Female Population of Trenton is 336.
What is the Ratio of Males per 100 Females in Trenton?
There are 89.29 Males per 100 Females in Trenton.
What is the Ratio of Females per 100 Males in Trenton?
There are 112.00 Females per 100 Males in Trenton.
What is the Median Population Age in Trenton?
Median Population Age in Trenton is 41.0 Years.
What is the Average Family Size in Trenton
Average Family Size in Trenton is 3.1 People.
What is the Average Household Size in Trenton
Average Household Size in Trenton is 2.5 People.
How Large is the Labor Force in Trenton?
There are 334 People in the Labor Forcein in Trenton.
What is the Percentage of People in the Labor Force in Trenton?
62.3% of People are in the Labor Force in Trenton.