Rule, TX Map & Demographics
Rule Map
Rule Overview
$19,333
PER CAPITA INCOME
$32,083
AVG FAMILY INCOME
$26,797
AVG HOUSEHOLD INCOME
41.2%
WAGE / INCOME GAP [ % ]
58.8¢/ $1
WAGE / INCOME GAP [ $ ]
$10,536
FAMILY INCOME DEFICIT
0.44
INEQUALITY / GINI INDEX
742
TOTAL POPULATION
355
MALE POPULATION
387
FEMALE POPULATION
91.73
MALES / 100 FEMALES
109.01
FEMALES / 100 MALES
45.5
MEDIAN AGE
3.0
AVG FAMILY SIZE
2.3
AVG HOUSEHOLD SIZE
261
LABOR FORCE [ PEOPLE ]
42.9%
PERCENT IN LABOR FORCE
2.3%
UNEMPLOYMENT RATE
Rule Area Codes
Income in Rule
Income Overview in Rule
Per Capita Income in Rule is $19,333, while median incomes of families and households are $32,083 and $26,797 respectively.
| Characteristic | Number | Measure |
| Per Capita Income | 742 | $19,333 |
| Median Family Income | 181 | $32,083 |
| Mean Family Income | 181 | $50,188 |
| Median Household Income | 329 | $26,797 |
| Mean Household Income | 329 | $42,325 |
| Income Deficit | 181 | $10,536 |
| Wage / Income Gap (%) | 742 | 41.18% |
| Wage / Income Gap ($) | 742 | 58.82¢ per $1 |
| Gini / Inequality Index | 742 | 0.44 |
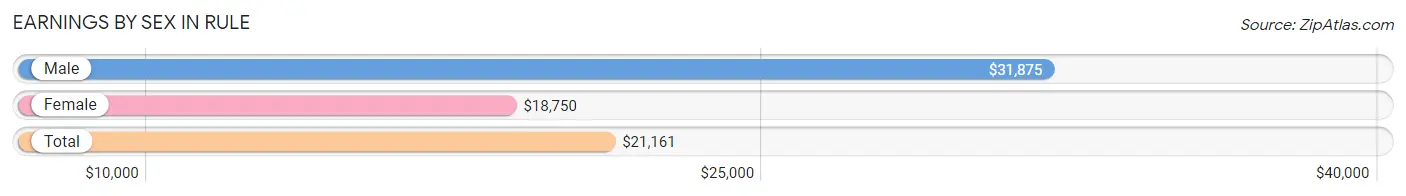
Earnings by Sex in Rule
Average Earnings in Rule are $21,161, $31,875 for men and $18,750 for women, a difference of 41.2%.
| Sex | Number | Average Earnings |
| Male | 113 (37.5%) | $31,875 |
| Female | 188 (62.5%) | $18,750 |
| Total | 301 (100.0%) | $21,161 |
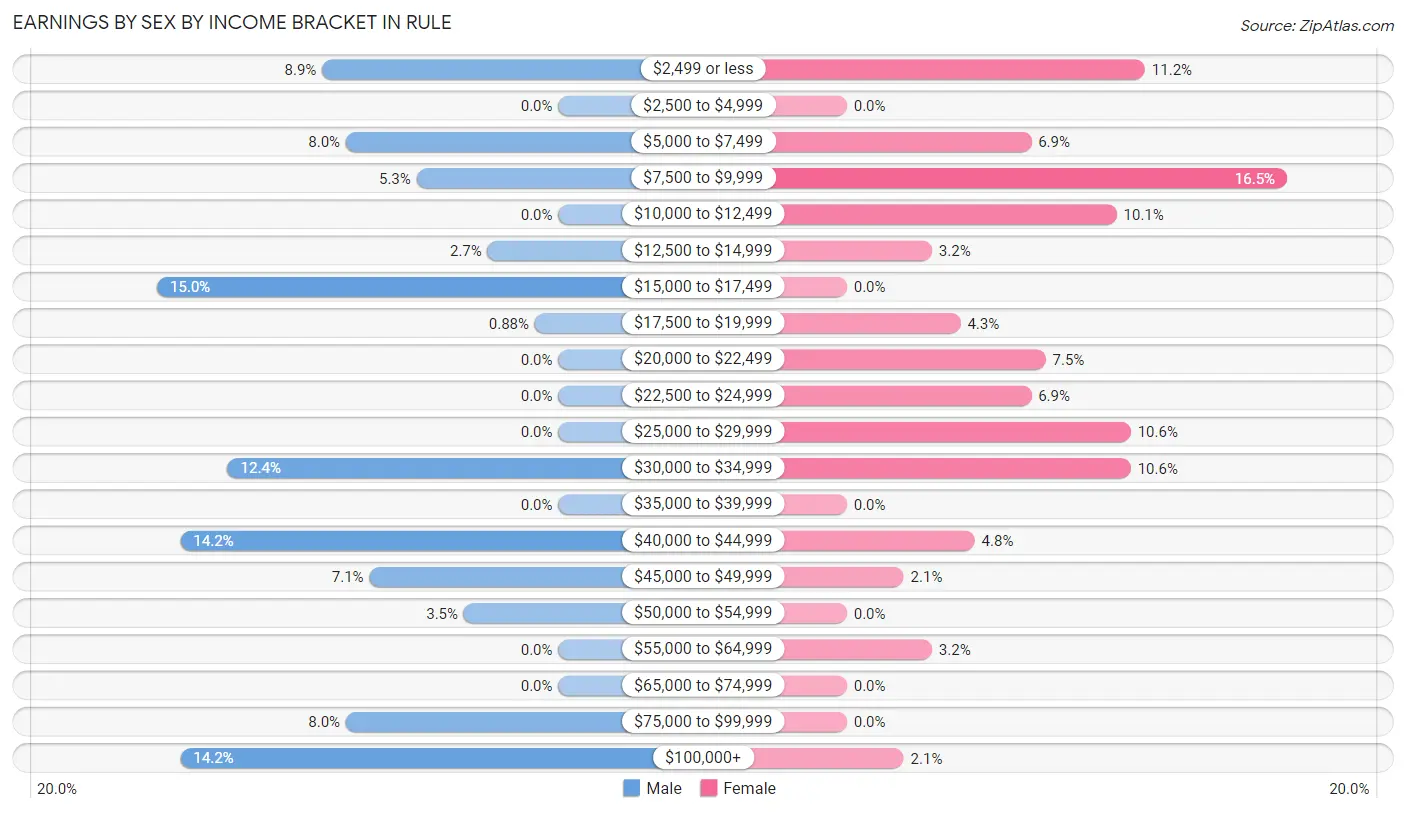
Earnings by Sex by Income Bracket in Rule
The most common earnings brackets in Rule are $15,000 to $17,499 for men (17 | 15.0%) and $7,500 to $9,999 for women (31 | 16.5%).
| Income | Male | Female |
| $2,499 or less | 10 (8.8%) | 21 (11.2%) |
| $2,500 to $4,999 | 0 (0.0%) | 0 (0.0%) |
| $5,000 to $7,499 | 9 (8.0%) | 13 (6.9%) |
| $7,500 to $9,999 | 6 (5.3%) | 31 (16.5%) |
| $10,000 to $12,499 | 0 (0.0%) | 19 (10.1%) |
| $12,500 to $14,999 | 3 (2.6%) | 6 (3.2%) |
| $15,000 to $17,499 | 17 (15.0%) | 0 (0.0%) |
| $17,500 to $19,999 | 1 (0.9%) | 8 (4.3%) |
| $20,000 to $22,499 | 0 (0.0%) | 14 (7.4%) |
| $22,500 to $24,999 | 0 (0.0%) | 13 (6.9%) |
| $25,000 to $29,999 | 0 (0.0%) | 20 (10.6%) |
| $30,000 to $34,999 | 14 (12.4%) | 20 (10.6%) |
| $35,000 to $39,999 | 0 (0.0%) | 0 (0.0%) |
| $40,000 to $44,999 | 16 (14.2%) | 9 (4.8%) |
| $45,000 to $49,999 | 8 (7.1%) | 4 (2.1%) |
| $50,000 to $54,999 | 4 (3.5%) | 0 (0.0%) |
| $55,000 to $64,999 | 0 (0.0%) | 6 (3.2%) |
| $65,000 to $74,999 | 0 (0.0%) | 0 (0.0%) |
| $75,000 to $99,999 | 9 (8.0%) | 0 (0.0%) |
| $100,000+ | 16 (14.2%) | 4 (2.1%) |
| Total | 113 (100.0%) | 188 (100.0%) |
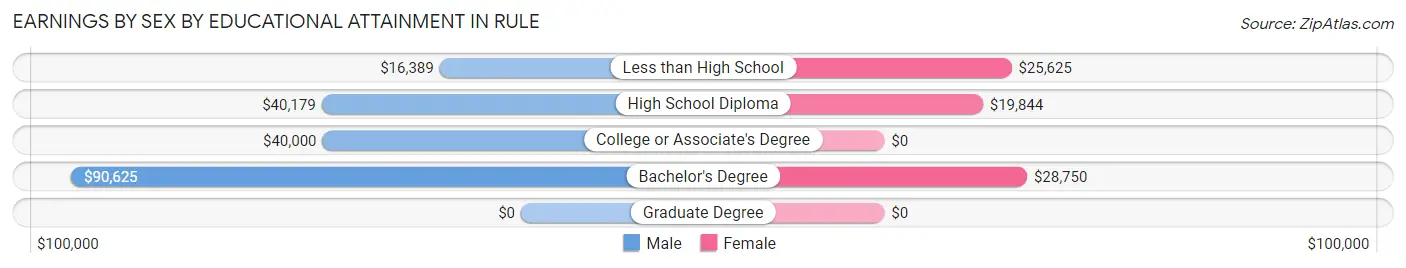
Earnings by Sex by Educational Attainment in Rule
Average earnings in Rule are $40,234 for men and $20,625 for women, a difference of 48.7%. Men with an educational attainment of bachelor's degree enjoy the highest average annual earnings of $90,625, while those with less than high school education earn the least with $16,389. Women with an educational attainment of bachelor's degree earn the most with the average annual earnings of $28,750, while those with high school diploma education have the smallest earnings of $19,844.
| Educational Attainment | Male Income | Female Income |
| Less than High School | $16,389 | $25,625 |
| High School Diploma | $40,179 | $19,844 |
| College or Associate's Degree | $40,000 | $0 |
| Bachelor's Degree | $90,625 | $28,750 |
| Graduate Degree | - | - |
| Total | $40,234 | $20,625 |
Family Income in Rule
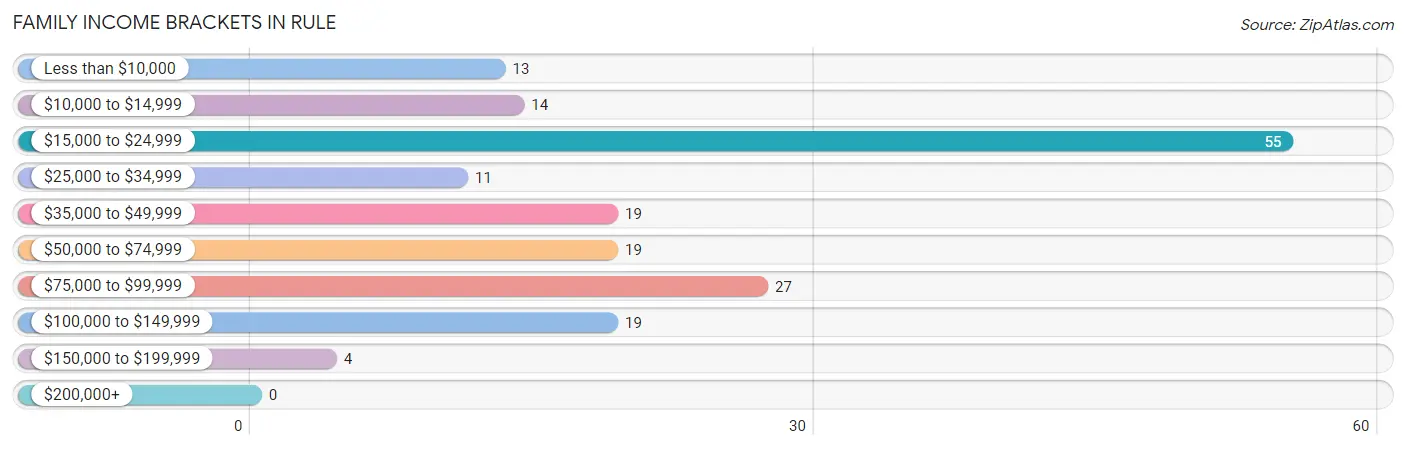
Family Income Brackets in Rule
According to the Rule family income data, there are 55 families falling into the $15,000 to $24,999 income range, which is the most common income bracket and makes up 30.4% of all families.
| Income Bracket | # Families | % Families |
| Less than $10,000 | 13 | 7.2% |
| $10,000 to $14,999 | 14 | 7.7% |
| $15,000 to $24,999 | 55 | 30.4% |
| $25,000 to $34,999 | 11 | 6.1% |
| $35,000 to $49,999 | 19 | 10.5% |
| $50,000 to $74,999 | 19 | 10.5% |
| $75,000 to $99,999 | 27 | 14.9% |
| $100,000 to $149,999 | 19 | 10.5% |
| $150,000 to $199,999 | 4 | 2.2% |
| $200,000+ | 0 | 0.0% |
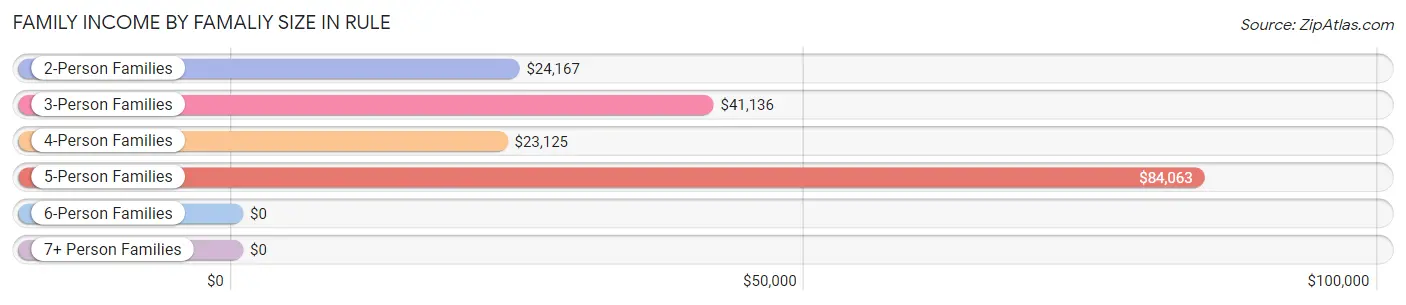
Family Income by Famaliy Size in Rule
5-person families (21 | 11.6%) account for the highest median family income in Rule with $84,063 per family, while 5-person families (21 | 11.6%) have the highest median income of $16,813 per family member.
| Income Bracket | # Families | Median Income |
| 2-Person Families | 112 (61.9%) | $24,167 |
| 3-Person Families | 20 (11.1%) | $41,136 |
| 4-Person Families | 27 (14.9%) | $23,125 |
| 5-Person Families | 21 (11.6%) | $84,063 |
| 6-Person Families | 1 (0.5%) | $0 |
| 7+ Person Families | 0 (0.0%) | $0 |
| Total | 181 (100.0%) | $32,083 |
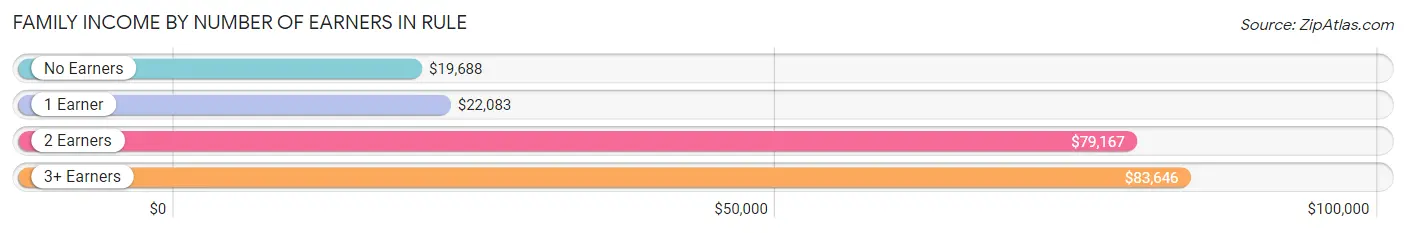
Family Income by Number of Earners in Rule
The median family income in Rule is $32,083, with families comprising 3+ earners (19) having the highest median family income of $83,646, while families with no earners (50) have the lowest median family income of $19,688, accounting for 10.5% and 27.6% of families, respectively.
| Number of Earners | # Families | Median Income |
| No Earners | 50 (27.6%) | $19,688 |
| 1 Earner | 54 (29.8%) | $22,083 |
| 2 Earners | 58 (32.0%) | $79,167 |
| 3+ Earners | 19 (10.5%) | $83,646 |
| Total | 181 (100.0%) | $32,083 |
Household Income in Rule
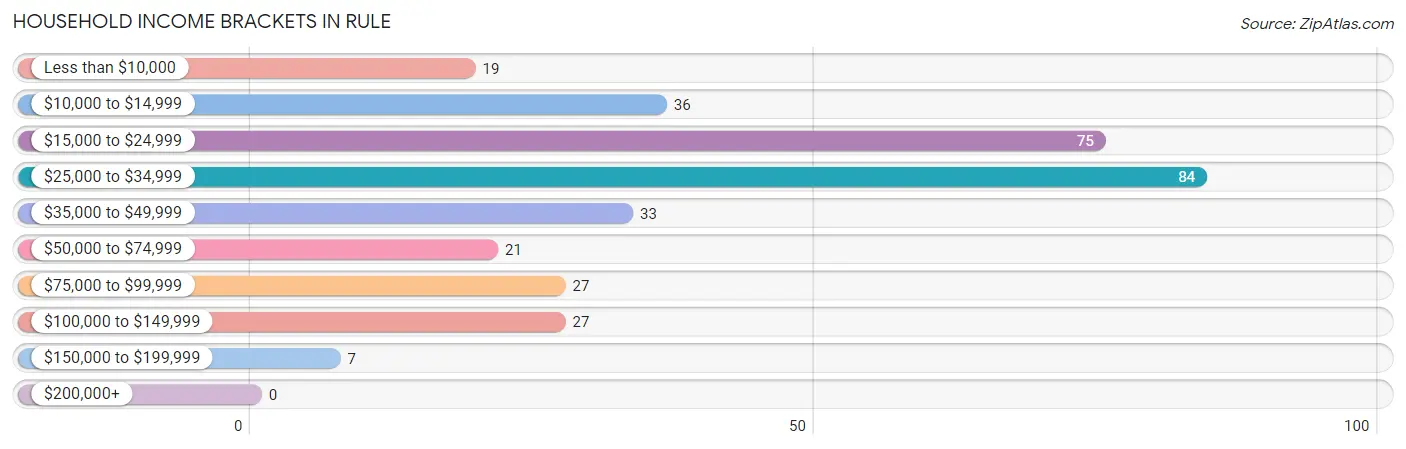
Household Income Brackets in Rule
With 84 households falling in the category, the $25,000 to $34,999 income range is the most frequent in Rule, accounting for 25.5% of all households.
| Income Bracket | # Households | % Households |
| Less than $10,000 | 19 | 5.8% |
| $10,000 to $14,999 | 36 | 10.9% |
| $15,000 to $24,999 | 75 | 22.8% |
| $25,000 to $34,999 | 84 | 25.5% |
| $35,000 to $49,999 | 33 | 10.0% |
| $50,000 to $74,999 | 21 | 6.4% |
| $75,000 to $99,999 | 27 | 8.2% |
| $100,000 to $149,999 | 27 | 8.2% |
| $150,000 to $199,999 | 7 | 2.1% |
| $200,000+ | 0 | 0.0% |
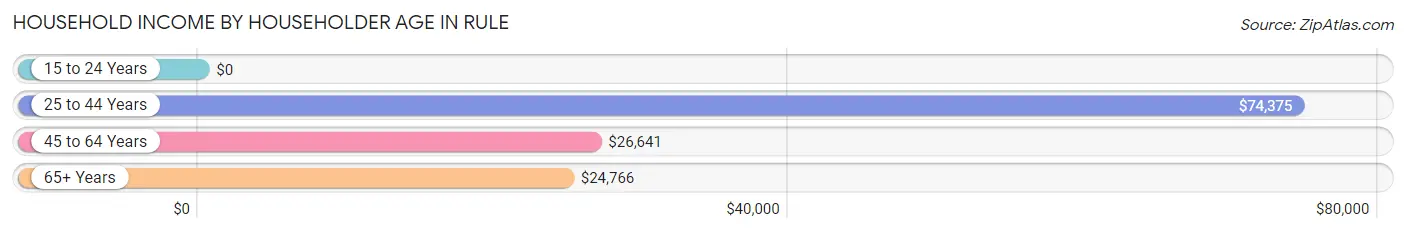
Household Income by Householder Age in Rule
The median household income in Rule is $26,797, with the highest median household income of $74,375 found in the 25 to 44 years age bracket for the primary householder. A total of 53 households (16.1%) fall into this category. Meanwhile, the 15 to 24 years age bracket for the primary householder has the lowest median household income of $0, with 8 households (2.4%) in this group.
| Income Bracket | # Households | Median Income |
| 15 to 24 Years | 8 (2.4%) | $0 |
| 25 to 44 Years | 53 (16.1%) | $74,375 |
| 45 to 64 Years | 125 (38.0%) | $26,641 |
| 65+ Years | 143 (43.5%) | $24,766 |
| Total | 329 (100.0%) | $26,797 |
Poverty in Rule
Income Below Poverty by Sex and Age in Rule
With 39.2% poverty level for males and 25.1% for females among the residents of Rule, 45 to 54 year old males and 35 to 44 year old females are the most vulnerable to poverty, with 61 males (88.4%) and 19 females (70.4%) in their respective age groups living below the poverty level.
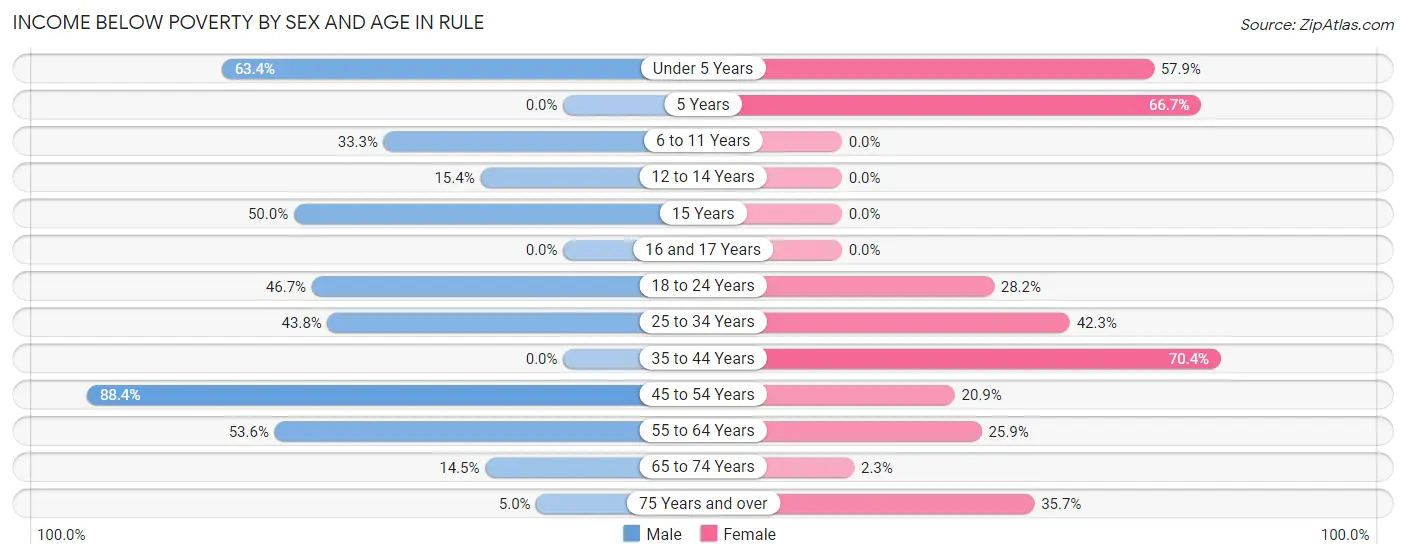
| Age Bracket | Male | Female |
| Under 5 Years | 26 (63.4%) | 11 (57.9%) |
| 5 Years | 0 (0.0%) | 2 (66.7%) |
| 6 to 11 Years | 5 (33.3%) | 0 (0.0%) |
| 12 to 14 Years | 2 (15.4%) | 0 (0.0%) |
| 15 Years | 4 (50.0%) | 0 (0.0%) |
| 16 and 17 Years | 0 (0.0%) | 0 (0.0%) |
| 18 to 24 Years | 7 (46.7%) | 11 (28.2%) |
| 25 to 34 Years | 7 (43.8%) | 22 (42.3%) |
| 35 to 44 Years | 0 (0.0%) | 19 (70.4%) |
| 45 to 54 Years | 61 (88.4%) | 18 (20.9%) |
| 55 to 64 Years | 15 (53.6%) | 7 (25.9%) |
| 65 to 74 Years | 10 (14.5%) | 2 (2.3%) |
| 75 Years and over | 2 (5.0%) | 5 (35.7%) |
| Total | 139 (39.2%) | 97 (25.1%) |
Income Above Poverty by Sex and Age in Rule
According to the poverty statistics in Rule, males aged 5 years and females aged 6 to 11 years are the age groups that are most secure financially, with 100.0% of males and 100.0% of females in these age groups living above the poverty line.
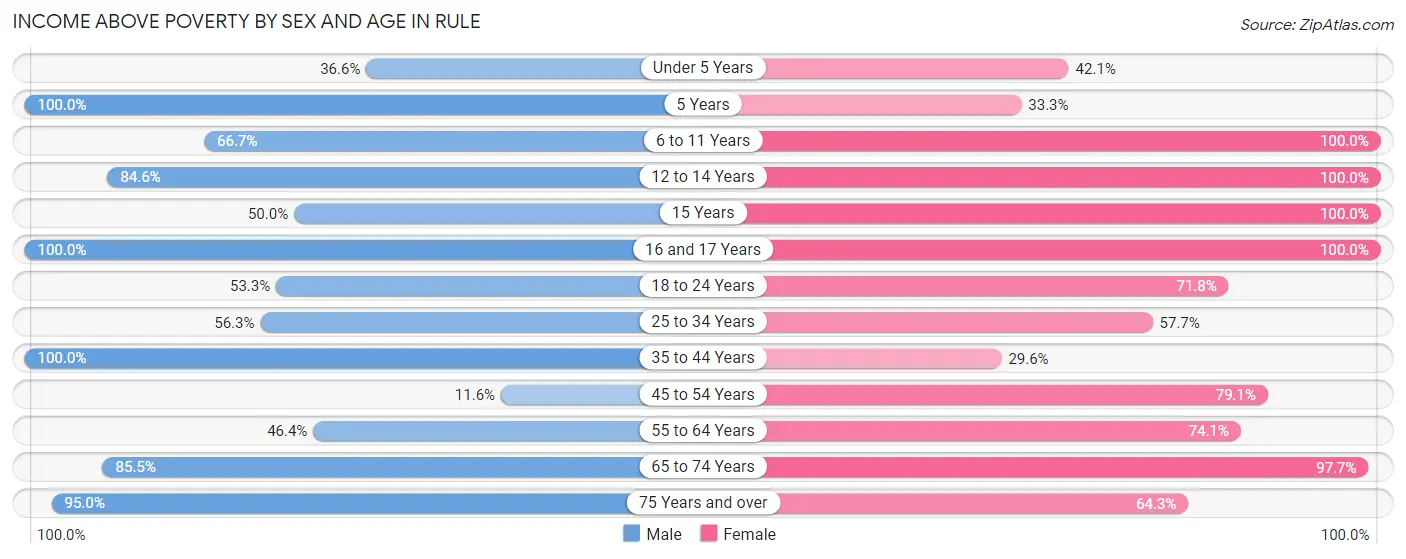
| Age Bracket | Male | Female |
| Under 5 Years | 15 (36.6%) | 8 (42.1%) |
| 5 Years | 6 (100.0%) | 1 (33.3%) |
| 6 to 11 Years | 10 (66.7%) | 16 (100.0%) |
| 12 to 14 Years | 11 (84.6%) | 11 (100.0%) |
| 15 Years | 4 (50.0%) | 1 (100.0%) |
| 16 and 17 Years | 2 (100.0%) | 4 (100.0%) |
| 18 to 24 Years | 8 (53.3%) | 28 (71.8%) |
| 25 to 34 Years | 9 (56.2%) | 30 (57.7%) |
| 35 to 44 Years | 33 (100.0%) | 8 (29.6%) |
| 45 to 54 Years | 8 (11.6%) | 68 (79.1%) |
| 55 to 64 Years | 13 (46.4%) | 20 (74.1%) |
| 65 to 74 Years | 59 (85.5%) | 86 (97.7%) |
| 75 Years and over | 38 (95.0%) | 9 (64.3%) |
| Total | 216 (60.9%) | 290 (74.9%) |
Income Below Poverty Among Married-Couple Families in Rule
The poverty statistics for married-couple families in Rule show that 19.9% or 26 of the total 131 families live below the poverty line. Families with no children have the highest poverty rate of 24.1%, comprising of 20 families. On the other hand, families with 3 or 4 children have the lowest poverty rate of 0.0%, which includes 0 families.
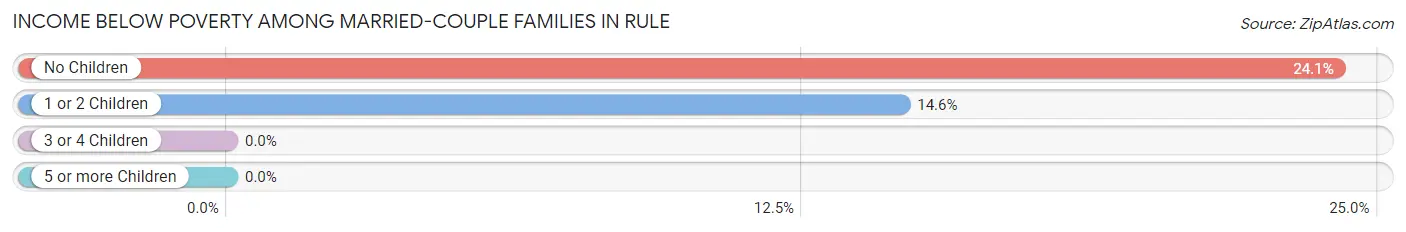
| Children | Above Poverty | Below Poverty |
| No Children | 63 (75.9%) | 20 (24.1%) |
| 1 or 2 Children | 35 (85.4%) | 6 (14.6%) |
| 3 or 4 Children | 7 (100.0%) | 0 (0.0%) |
| 5 or more Children | 0 (0.0%) | 0 (0.0%) |
| Total | 105 (80.1%) | 26 (19.9%) |
Income Below Poverty Among Single-Parent Households in Rule
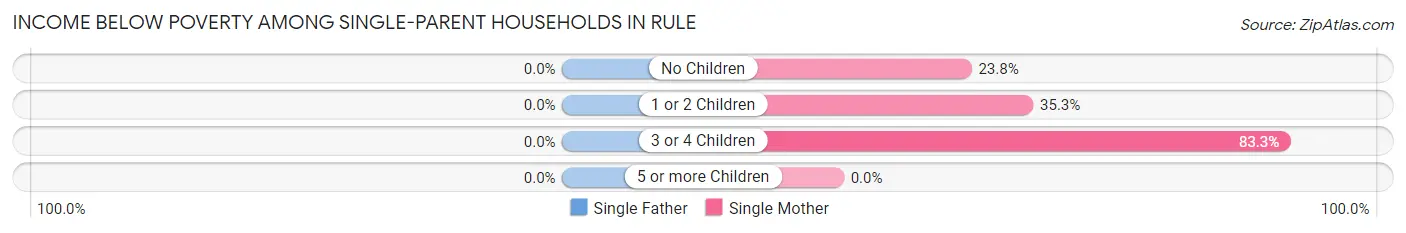
| Children | Single Father | Single Mother |
| No Children | 0 (0.0%) | 5 (23.8%) |
| 1 or 2 Children | 0 (0.0%) | 6 (35.3%) |
| 3 or 4 Children | 0 (0.0%) | 10 (83.3%) |
| 5 or more Children | 0 (0.0%) | 0 (0.0%) |
| Total | 0 (0.0%) | 21 (42.0%) |
Income Below Poverty Among Married-Couple vs Single-Parent Households in Rule
The poverty data for Rule shows that 26 of the married-couple family households (19.9%) and 21 of the single-parent households (42.0%) are living below the poverty level. Within the married-couple family households, those with no children have the highest poverty rate, with 20 households (24.1%) falling below the poverty line. Among the single-parent households, those with 3 or 4 children have the highest poverty rate, with 10 household (83.3%) living below poverty.
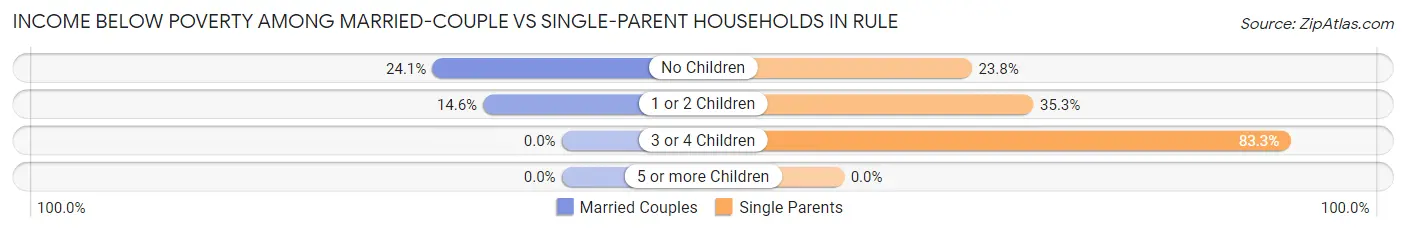
| Children | Married-Couple Families | Single-Parent Households |
| No Children | 20 (24.1%) | 5 (23.8%) |
| 1 or 2 Children | 6 (14.6%) | 6 (35.3%) |
| 3 or 4 Children | 0 (0.0%) | 10 (83.3%) |
| 5 or more Children | 0 (0.0%) | 0 (0.0%) |
| Total | 26 (19.9%) | 21 (42.0%) |
Race in Rule
The most populous races in Rule are White / Caucasian (544 | 73.3%), Hispanic or Latino (201 | 27.1%), and Two or more Races (99 | 13.3%).
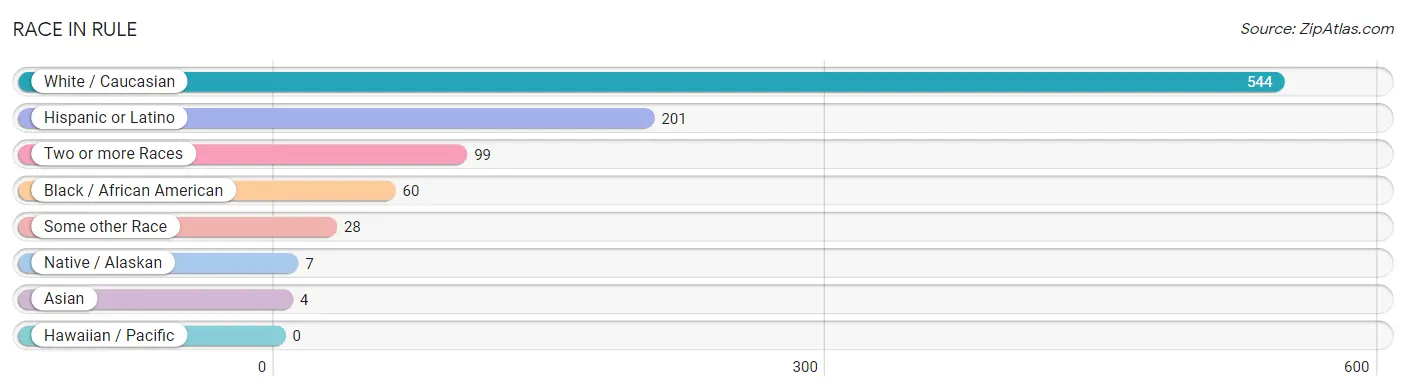
| Race | # Population | % Population |
| Asian | 4 | 0.5% |
| Black / African American | 60 | 8.1% |
| Hawaiian / Pacific | 0 | 0.0% |
| Hispanic or Latino | 201 | 27.1% |
| Native / Alaskan | 7 | 0.9% |
| White / Caucasian | 544 | 73.3% |
| Two or more Races | 99 | 13.3% |
| Some other Race | 28 | 3.8% |
| Total | 742 | 100.0% |
Ancestry in Rule
The most populous ancestries reported in Rule are Mexican (199 | 26.8%), English (101 | 13.6%), German (71 | 9.6%), Scotch-Irish (68 | 9.2%), and Irish (46 | 6.2%), together accounting for 65.4% of all Rule residents.
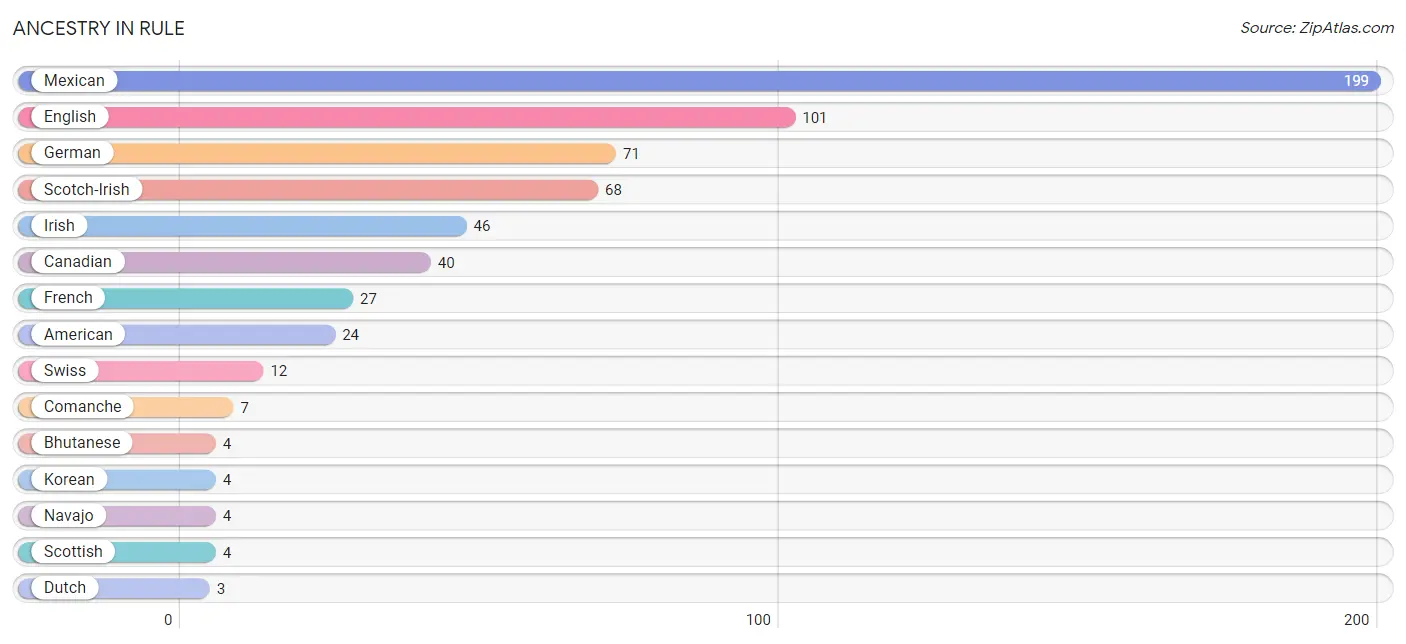
| Ancestry | # Population | % Population |
| American | 24 | 3.2% |
| Bhutanese | 4 | 0.5% |
| Canadian | 40 | 5.4% |
| Comanche | 7 | 0.9% |
| Dutch | 3 | 0.4% |
| Dutch West Indian | 2 | 0.3% |
| English | 101 | 13.6% |
| French | 27 | 3.6% |
| German | 71 | 9.6% |
| Irish | 46 | 6.2% |
| Korean | 4 | 0.5% |
| Mexican | 199 | 26.8% |
| Navajo | 4 | 0.5% |
| Scotch-Irish | 68 | 9.2% |
| Scottish | 4 | 0.5% |
| Spaniard | 2 | 0.3% |
| Swiss | 12 | 1.6% | View All 17 Rows |
Immigrants in Rule
The most numerous immigrant groups reported in Rule came from Central America (14 | 1.9%), Latin America (14 | 1.9%), Mexico (14 | 1.9%), Asia (4 | 0.5%), and Philippines (4 | 0.5%), together accounting for 6.8% of all Rule residents.
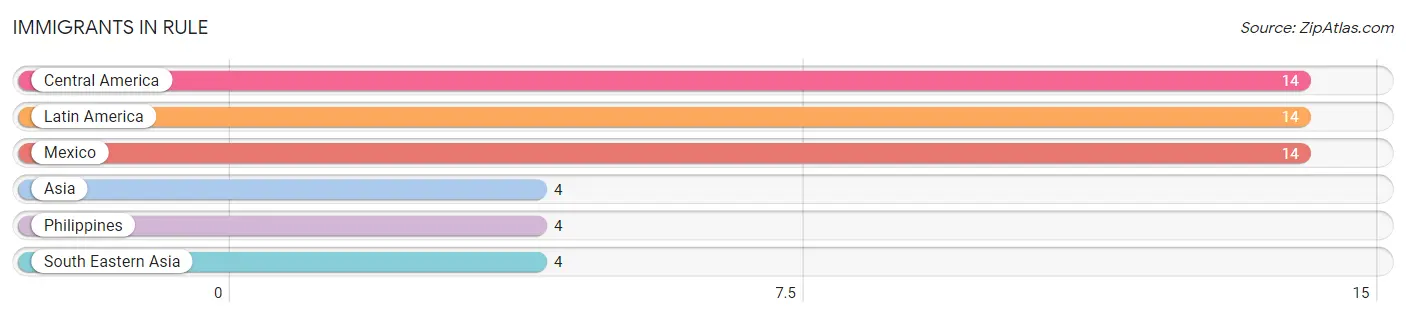
| Immigration Origin | # Population | % Population |
| Asia | 4 | 0.5% |
| Central America | 14 | 1.9% |
| Latin America | 14 | 1.9% |
| Mexico | 14 | 1.9% |
| Philippines | 4 | 0.5% |
| South Eastern Asia | 4 | 0.5% | View All 6 Rows |
Sex and Age in Rule
Sex and Age in Rule
The most populous age groups in Rule are 45 to 49 Years (58 | 16.3%) for men and 65 to 69 Years (51 | 13.2%) for women.
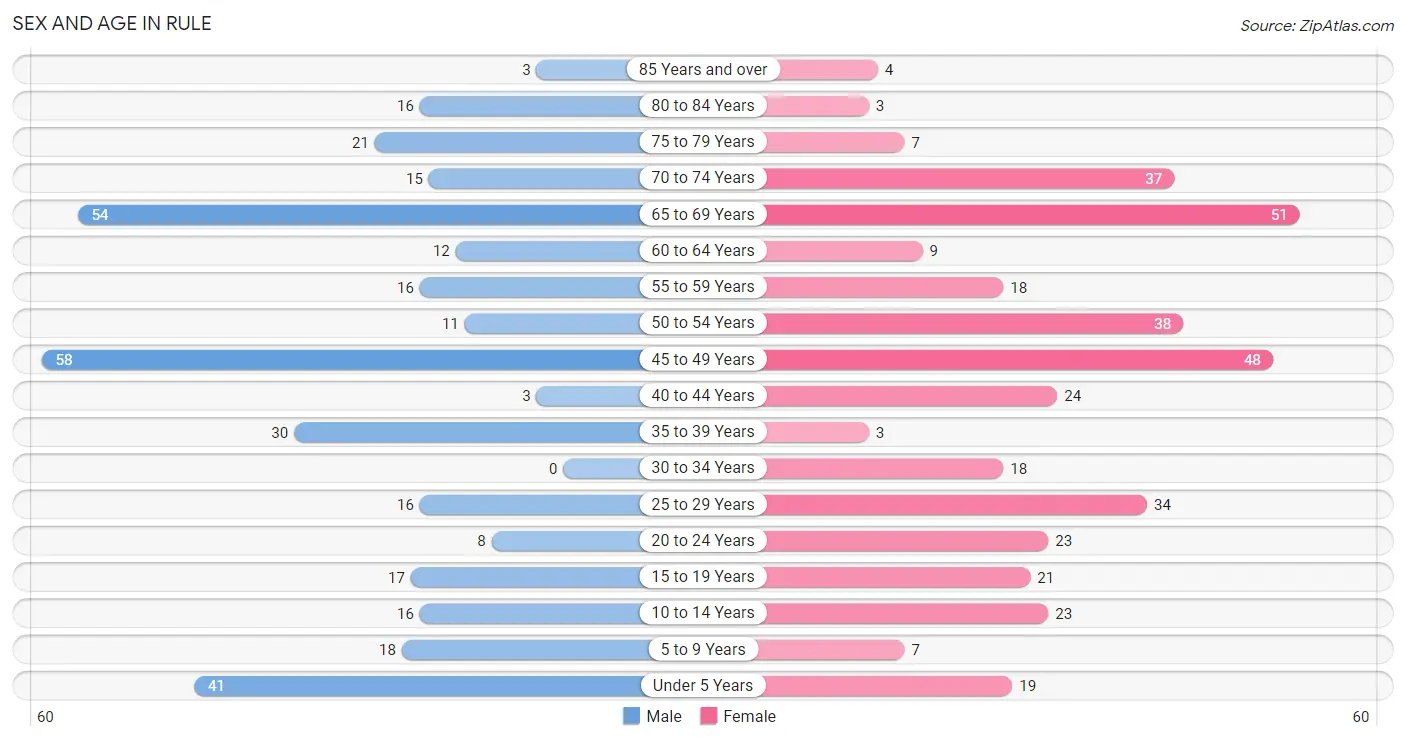
| Age Bracket | Male | Female |
| Under 5 Years | 41 (11.6%) | 19 (4.9%) |
| 5 to 9 Years | 18 (5.1%) | 7 (1.8%) |
| 10 to 14 Years | 16 (4.5%) | 23 (5.9%) |
| 15 to 19 Years | 17 (4.8%) | 21 (5.4%) |
| 20 to 24 Years | 8 (2.2%) | 23 (5.9%) |
| 25 to 29 Years | 16 (4.5%) | 34 (8.8%) |
| 30 to 34 Years | 0 (0.0%) | 18 (4.6%) |
| 35 to 39 Years | 30 (8.5%) | 3 (0.8%) |
| 40 to 44 Years | 3 (0.9%) | 24 (6.2%) |
| 45 to 49 Years | 58 (16.3%) | 48 (12.4%) |
| 50 to 54 Years | 11 (3.1%) | 38 (9.8%) |
| 55 to 59 Years | 16 (4.5%) | 18 (4.6%) |
| 60 to 64 Years | 12 (3.4%) | 9 (2.3%) |
| 65 to 69 Years | 54 (15.2%) | 51 (13.2%) |
| 70 to 74 Years | 15 (4.2%) | 37 (9.6%) |
| 75 to 79 Years | 21 (5.9%) | 7 (1.8%) |
| 80 to 84 Years | 16 (4.5%) | 3 (0.8%) |
| 85 Years and over | 3 (0.9%) | 4 (1.0%) |
| Total | 355 (100.0%) | 387 (100.0%) |
Families and Households in Rule
Median Family Size in Rule
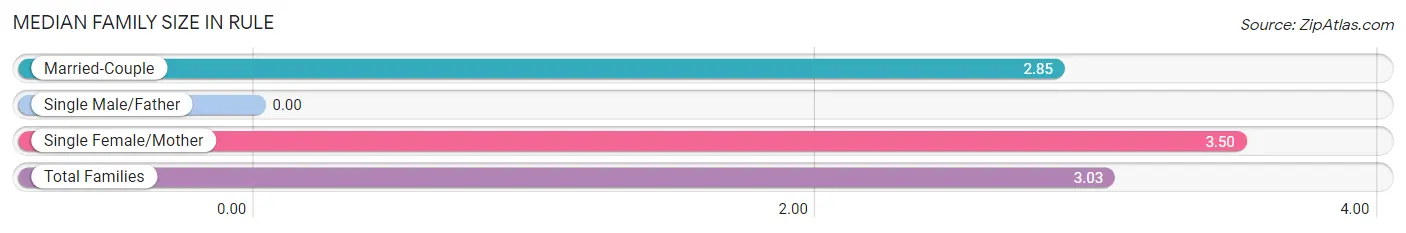
| Family Type | # Families | Family Size |
| Married-Couple | 131 (72.4%) | 2.85 |
| Single Male/Father | 0 (0.0%) | - |
| Single Female/Mother | 50 (27.6%) | 3.50 |
| Total Families | 181 (100.0%) | 3.03 |
Median Household Size in Rule
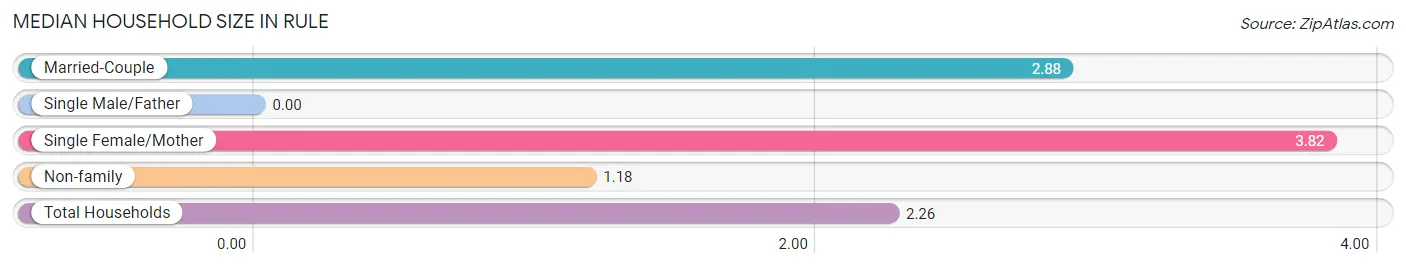
| Household Type | # Households | Household Size |
| Married-Couple | 131 (39.8%) | 2.88 |
| Single Male/Father | 0 (0.0%) | - |
| Single Female/Mother | 50 (15.2%) | 3.82 |
| Non-family | 148 (45.0%) | 1.18 |
| Total Households | 329 (100.0%) | 2.26 |
Household Size by Marriage Status in Rule
Out of a total of 329 households in Rule, 181 (55.0%) are family households, while 148 (45.0%) are nonfamily households. The most numerous type of family households are 2-person households, comprising 103, and the most common type of nonfamily households are 1-person households, comprising 86.
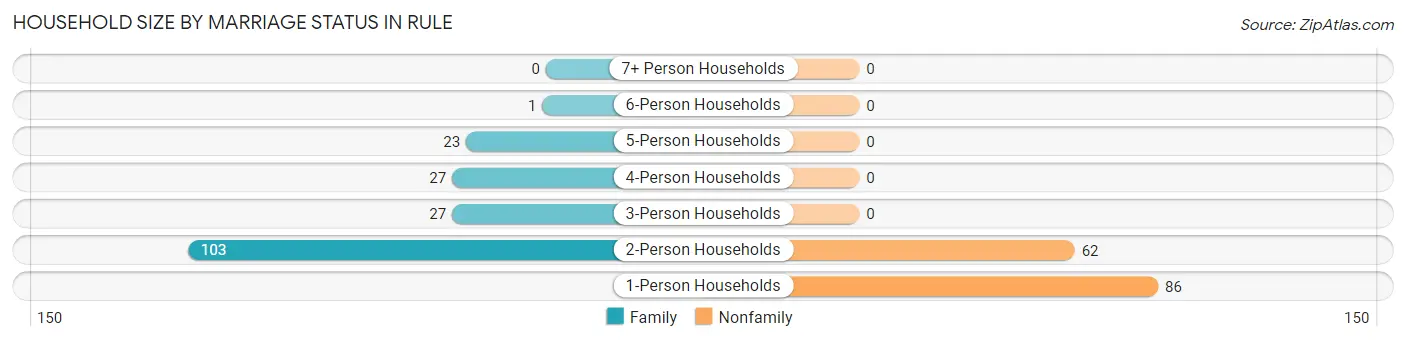
| Household Size | Family Households | Nonfamily Households |
| 1-Person Households | - | 86 (26.1%) |
| 2-Person Households | 103 (31.3%) | 62 (18.8%) |
| 3-Person Households | 27 (8.2%) | 0 (0.0%) |
| 4-Person Households | 27 (8.2%) | 0 (0.0%) |
| 5-Person Households | 23 (7.0%) | 0 (0.0%) |
| 6-Person Households | 1 (0.3%) | 0 (0.0%) |
| 7+ Person Households | 0 (0.0%) | 0 (0.0%) |
| Total | 181 (55.0%) | 148 (45.0%) |
Female Fertility in Rule
Fertility by Age in Rule
Average fertility rate in Rule is 135.0 births per 1,000 women. Women in the age bracket of 15 to 19 years have the highest fertility rate with 762.0 births per 1,000 women. Women in the age bracket of 15 to 19 years acount for 69.6% of all women with births.
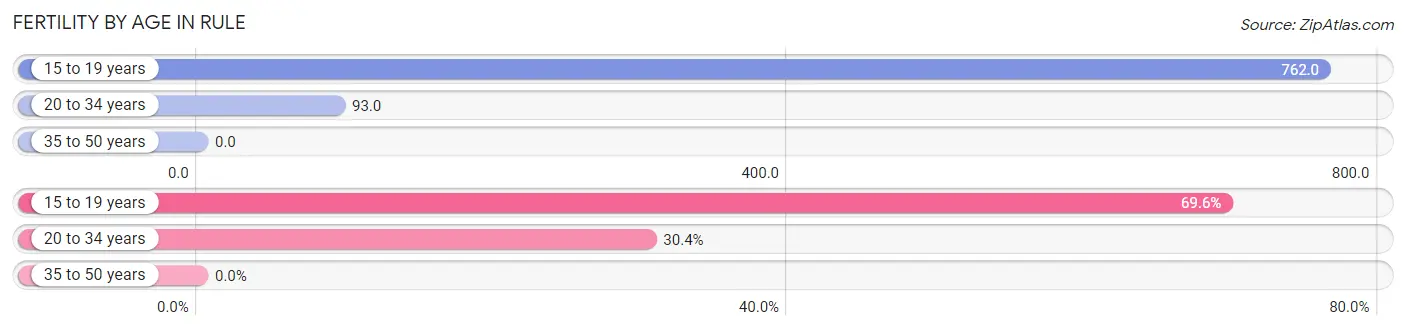
| Age Bracket | Women with Births | Births / 1,000 Women |
| 15 to 19 years | 16 (69.6%) | 762.0 |
| 20 to 34 years | 7 (30.4%) | 93.0 |
| 35 to 50 years | 0 (0.0%) | 0.0 |
| Total | 23 (100.0%) | 135.0 |
Fertility by Age by Marriage Status in Rule
30.4% of women with births (23) in Rule are married. The highest percentage of unmarried women with births falls into 15 to 19 years age bracket with 100.0% of them unmarried at the time of birth, while the lowest percentage of unmarried women with births belong to 20 to 34 years age bracket with 0.0% of them unmarried.
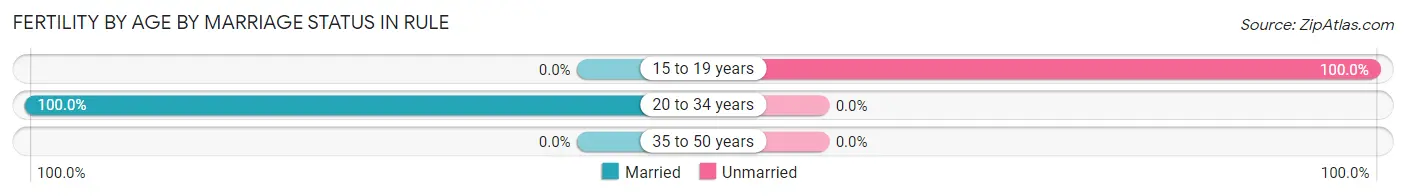
| Age Bracket | Married | Unmarried |
| 15 to 19 years | 0 (0.0%) | 16 (100.0%) |
| 20 to 34 years | 7 (100.0%) | 0 (0.0%) |
| 35 to 50 years | 0 (0.0%) | 0 (0.0%) |
| Total | 7 (30.4%) | 16 (69.6%) |
Fertility by Education in Rule
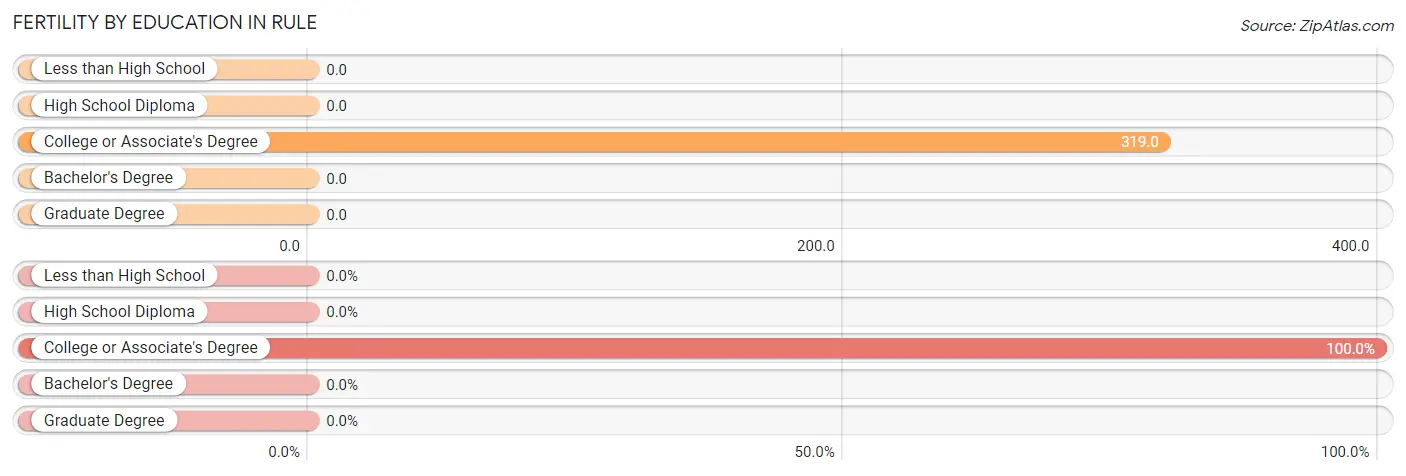
| Educational Attainment | Women with Births | Births / 1,000 Women |
| Less than High School | 0 (0.0%) | 0.0 |
| High School Diploma | 0 (0.0%) | 0.0 |
| College or Associate's Degree | 23 (100.0%) | 319.0 |
| Bachelor's Degree | 0 (0.0%) | 0.0 |
| Graduate Degree | 0 (0.0%) | 0.0 |
| Total | 23 (100.0%) | 135.0 |
Fertility by Education by Marriage Status in Rule
69.6% of women with births in Rule are unmarried. Women with the educational attainment of college or associate's degree are most likely to be married with 30.4% of them married at childbirth, while women with the educational attainment of college or associate's degree are least likely to be married with 69.6% of them unmarried at childbirth.
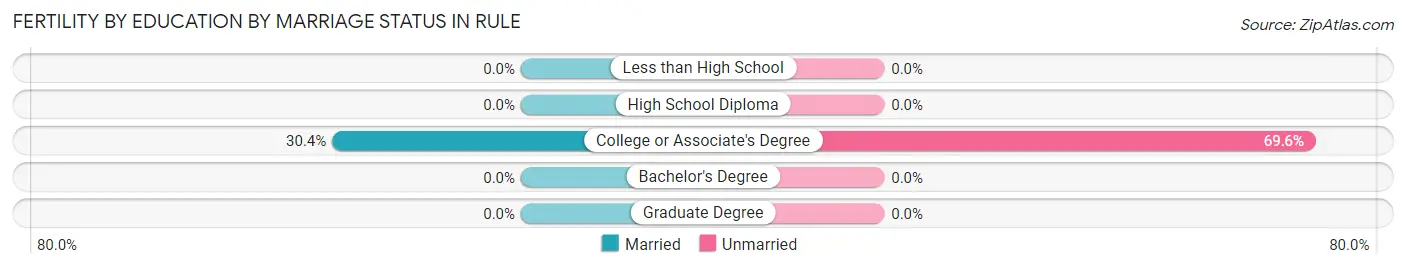
| Educational Attainment | Married | Unmarried |
| Less than High School | 0 (0.0%) | 0 (0.0%) |
| High School Diploma | 0 (0.0%) | 0 (0.0%) |
| College or Associate's Degree | 7 (30.4%) | 16 (69.6%) |
| Bachelor's Degree | 0 (0.0%) | 0 (0.0%) |
| Graduate Degree | 0 (0.0%) | 0 (0.0%) |
| Total | 7 (30.4%) | 16 (69.6%) |
Employment Characteristics in Rule
Employment by Class of Employer in Rule
Among the 255 employed individuals in Rule, private company employees (155 | 60.8%), self-employed (not incorporated) (38 | 14.9%), and state government employees (18 | 7.1%) make up the most common classes of employment.
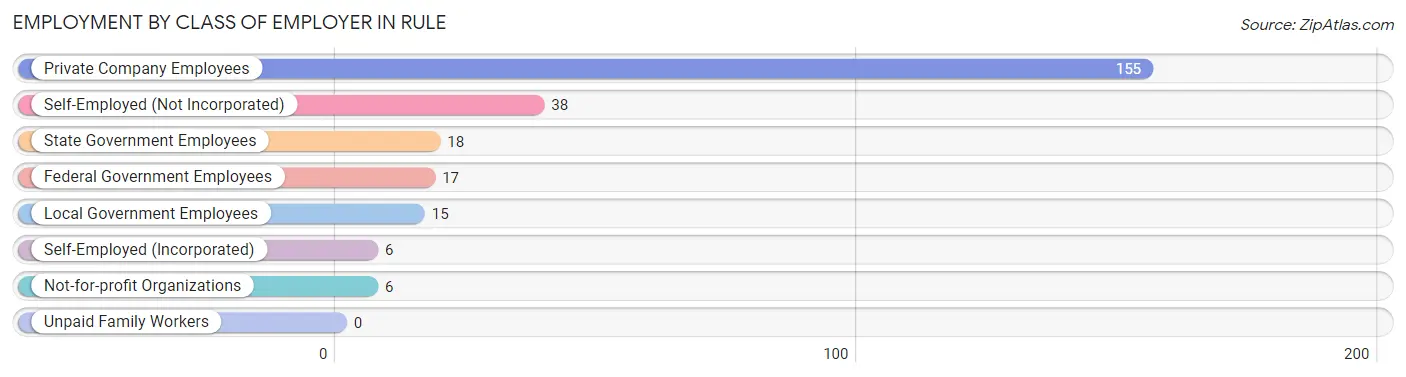
| Employer Class | # Employees | % Employees |
| Private Company Employees | 155 | 60.8% |
| Self-Employed (Incorporated) | 6 | 2.4% |
| Self-Employed (Not Incorporated) | 38 | 14.9% |
| Not-for-profit Organizations | 6 | 2.4% |
| Local Government Employees | 15 | 5.9% |
| State Government Employees | 18 | 7.1% |
| Federal Government Employees | 17 | 6.7% |
| Unpaid Family Workers | 0 | 0.0% |
| Total | 255 | 100.0% |
Employment Status by Age in Rule
According to the labor force statistics for Rule, out of the total population over 16 years of age (609), 42.9% or 261 individuals are in the labor force, with 2.3% or 6 of them unemployed. The age group with the highest labor force participation rate is 20 to 24 years, with 100.0% or 31 individuals in the labor force. Within the labor force, the 20 to 24 years age range has the highest percentage of unemployed individuals, with 9.7% or 3 of them being unemployed.
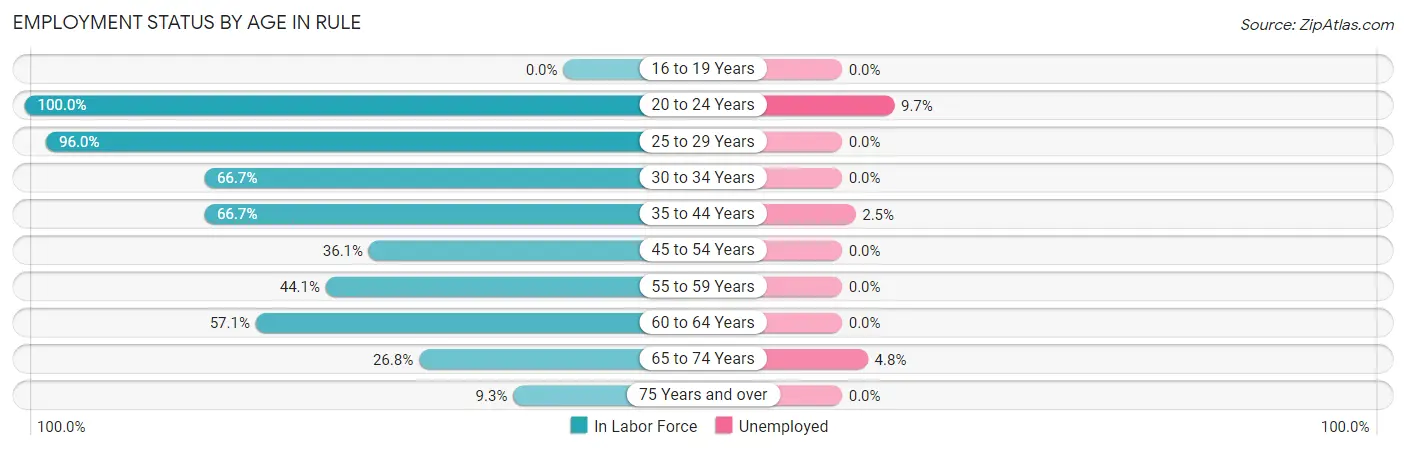
| Age Bracket | In Labor Force | Unemployed |
| 16 to 19 Years | 0 (0.0%) | 0 (0.0%) |
| 20 to 24 Years | 31 (100.0%) | 3 (9.7%) |
| 25 to 29 Years | 48 (96.0%) | 0 (0.0%) |
| 30 to 34 Years | 12 (66.7%) | 0 (0.0%) |
| 35 to 44 Years | 40 (66.7%) | 1 (2.5%) |
| 45 to 54 Years | 56 (36.1%) | 0 (0.0%) |
| 55 to 59 Years | 15 (44.1%) | 0 (0.0%) |
| 60 to 64 Years | 12 (57.1%) | 0 (0.0%) |
| 65 to 74 Years | 42 (26.8%) | 2 (4.8%) |
| 75 Years and over | 5 (9.3%) | 0 (0.0%) |
| Total | 261 (42.9%) | 6 (2.3%) |
Employment Status by Educational Attainment in Rule
According to labor force statistics for Rule, 54.1% of individuals (183) out of the total population between 25 and 64 years of age (338) are in the labor force, with 0.5% or 1 of them being unemployed. The group with the highest labor force participation rate are those with the educational attainment of college / associate degree, with 83.7% or 72 individuals in the labor force. Within the labor force, individuals with college / associate degree education have the highest percentage of unemployment, with 1.4% or 1 of them being unemployed.
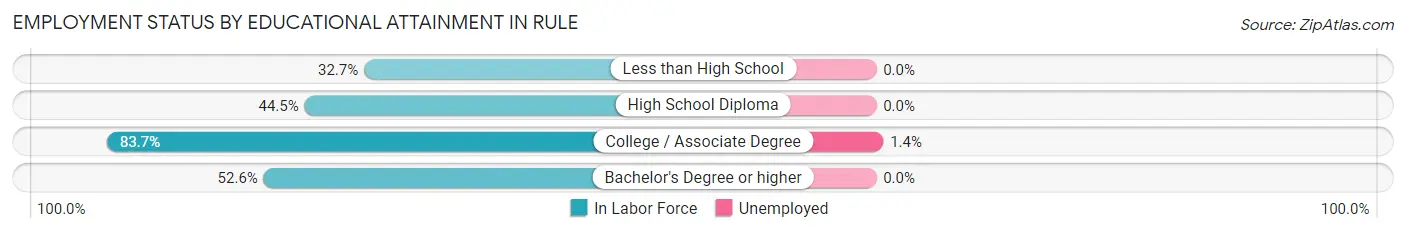
| Educational Attainment | In Labor Force | Unemployed |
| Less than High School | 16 (32.7%) | 0 (0.0%) |
| High School Diploma | 65 (44.5%) | 0 (0.0%) |
| College / Associate Degree | 72 (83.7%) | 1 (1.4%) |
| Bachelor's Degree or higher | 30 (52.6%) | 0 (0.0%) |
| Total | 183 (54.1%) | 2 (0.5%) |
Employment Occupations by Sex in Rule
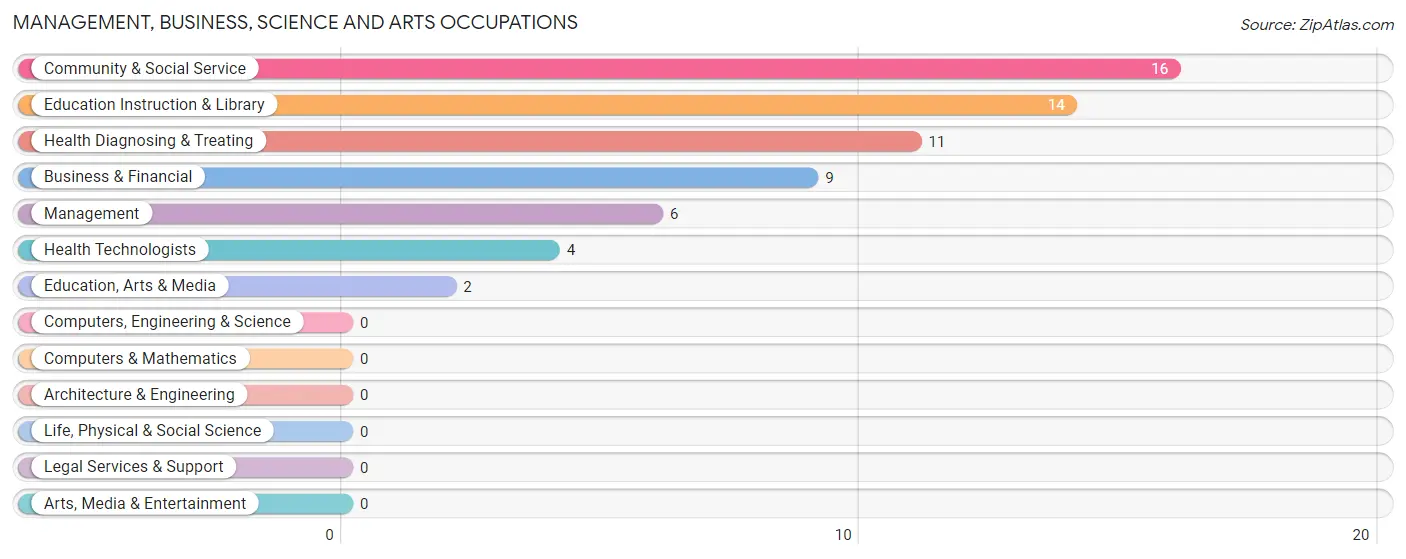
Management, Business, Science and Arts Occupations
The most common Management, Business, Science and Arts occupations in Rule are Community & Social Service (16 | 6.3%), Education Instruction & Library (14 | 5.5%), Health Diagnosing & Treating (11 | 4.3%), Business & Financial (9 | 3.5%), and Management (6 | 2.4%).
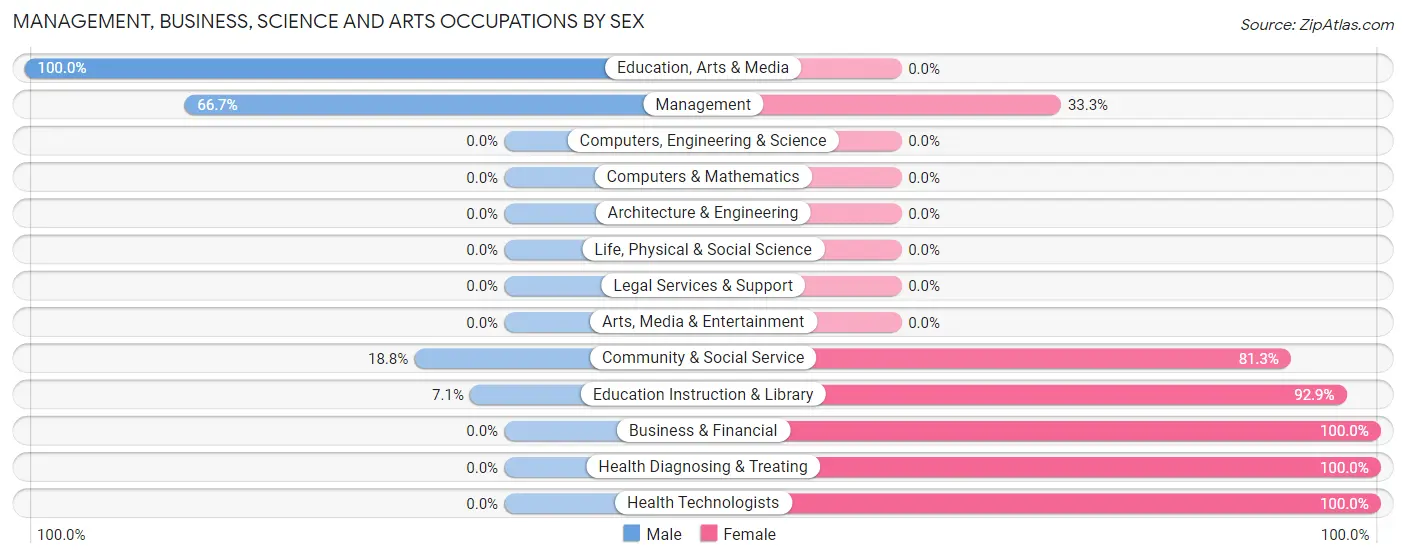
Management, Business, Science and Arts Occupations by Sex
Within the Management, Business, Science and Arts occupations in Rule, the most male-oriented occupations are Education, Arts & Media (100.0%), Management (66.7%), and Community & Social Service (18.8%), while the most female-oriented occupations are Business & Financial (100.0%), Health Diagnosing & Treating (100.0%), and Health Technologists (100.0%).
| Occupation | Male | Female |
| Management | 4 (66.7%) | 2 (33.3%) |
| Business & Financial | 0 (0.0%) | 9 (100.0%) |
| Computers, Engineering & Science | 0 (0.0%) | 0 (0.0%) |
| Computers & Mathematics | 0 (0.0%) | 0 (0.0%) |
| Architecture & Engineering | 0 (0.0%) | 0 (0.0%) |
| Life, Physical & Social Science | 0 (0.0%) | 0 (0.0%) |
| Community & Social Service | 3 (18.8%) | 13 (81.2%) |
| Education, Arts & Media | 2 (100.0%) | 0 (0.0%) |
| Legal Services & Support | 0 (0.0%) | 0 (0.0%) |
| Education Instruction & Library | 1 (7.1%) | 13 (92.9%) |
| Arts, Media & Entertainment | 0 (0.0%) | 0 (0.0%) |
| Health Diagnosing & Treating | 0 (0.0%) | 11 (100.0%) |
| Health Technologists | 0 (0.0%) | 4 (100.0%) |
| Total (Category) | 7 (16.7%) | 35 (83.3%) |
| Total (Overall) | 102 (40.0%) | 153 (60.0%) |
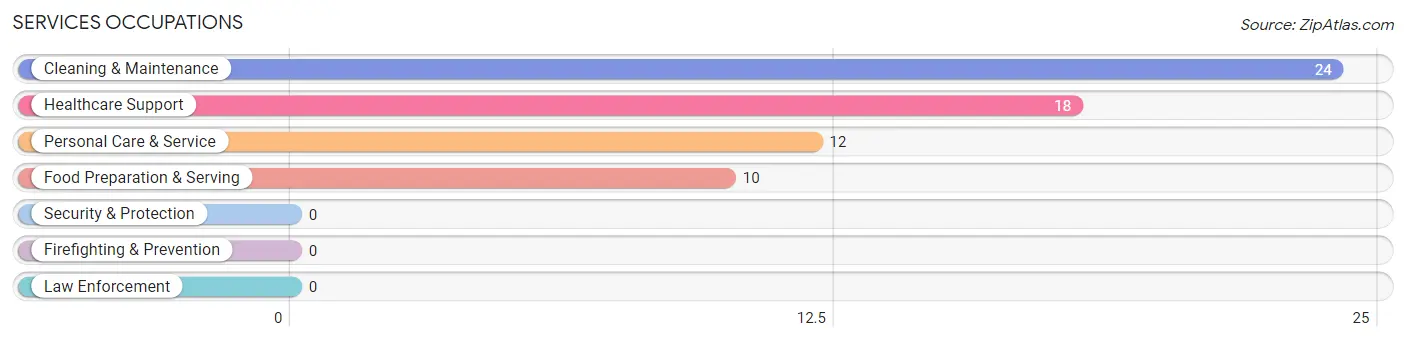
Services Occupations
The most common Services occupations in Rule are Cleaning & Maintenance (24 | 9.4%), Healthcare Support (18 | 7.1%), Personal Care & Service (12 | 4.7%), and Food Preparation & Serving (10 | 3.9%).
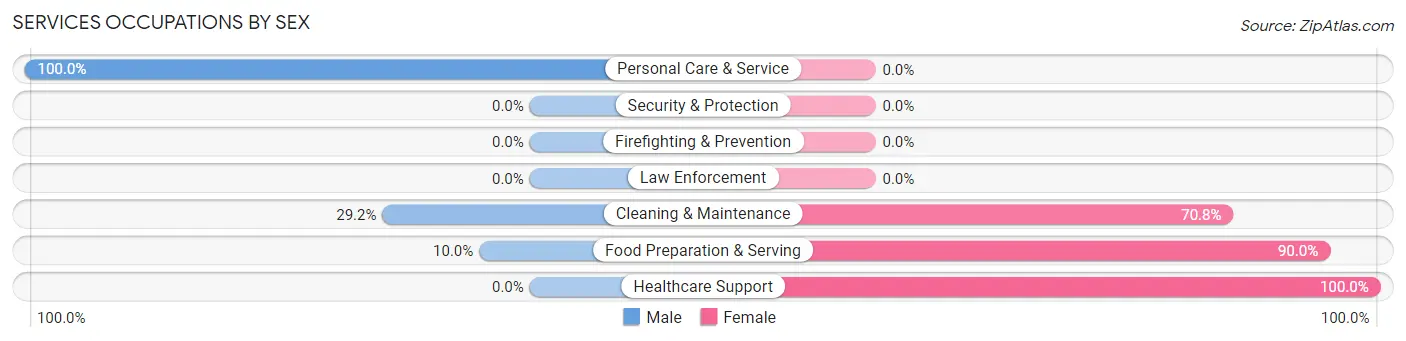
Services Occupations by Sex
Within the Services occupations in Rule, the most male-oriented occupations are Personal Care & Service (100.0%), Cleaning & Maintenance (29.2%), and Food Preparation & Serving (10.0%), while the most female-oriented occupations are Healthcare Support (100.0%), Food Preparation & Serving (90.0%), and Cleaning & Maintenance (70.8%).
| Occupation | Male | Female |
| Healthcare Support | 0 (0.0%) | 18 (100.0%) |
| Security & Protection | 0 (0.0%) | 0 (0.0%) |
| Firefighting & Prevention | 0 (0.0%) | 0 (0.0%) |
| Law Enforcement | 0 (0.0%) | 0 (0.0%) |
| Food Preparation & Serving | 1 (10.0%) | 9 (90.0%) |
| Cleaning & Maintenance | 7 (29.2%) | 17 (70.8%) |
| Personal Care & Service | 12 (100.0%) | 0 (0.0%) |
| Total (Category) | 20 (31.2%) | 44 (68.8%) |
| Total (Overall) | 102 (40.0%) | 153 (60.0%) |
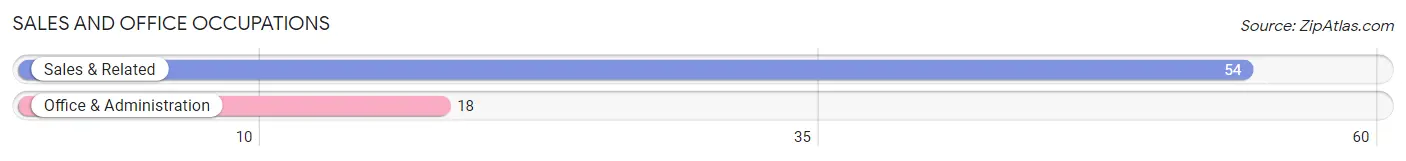
Sales and Office Occupations
The most common Sales and Office occupations in Rule are Sales & Related (54 | 21.2%), and Office & Administration (18 | 7.1%).
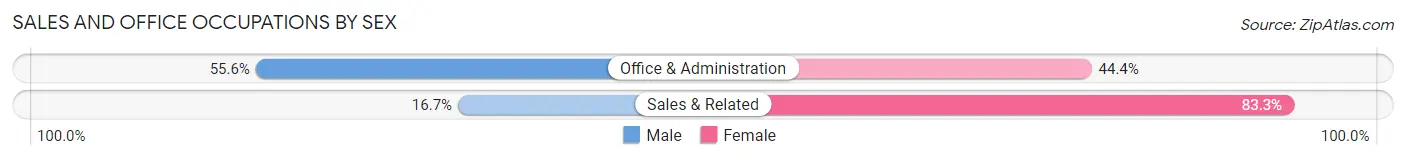
Sales and Office Occupations by Sex
| Occupation | Male | Female |
| Sales & Related | 9 (16.7%) | 45 (83.3%) |
| Office & Administration | 10 (55.6%) | 8 (44.4%) |
| Total (Category) | 19 (26.4%) | 53 (73.6%) |
| Total (Overall) | 102 (40.0%) | 153 (60.0%) |
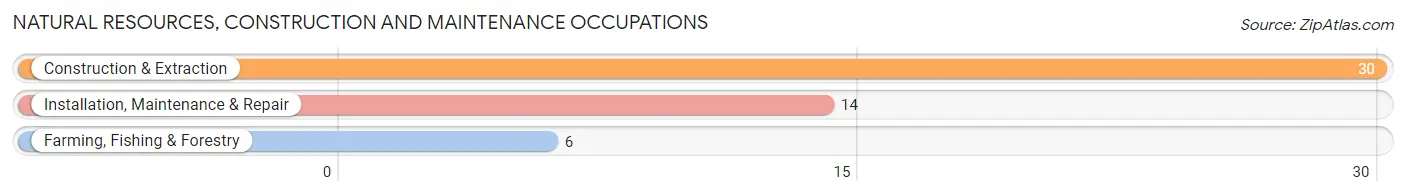
Natural Resources, Construction and Maintenance Occupations
The most common Natural Resources, Construction and Maintenance occupations in Rule are Construction & Extraction (30 | 11.8%), Installation, Maintenance & Repair (14 | 5.5%), and Farming, Fishing & Forestry (6 | 2.4%).
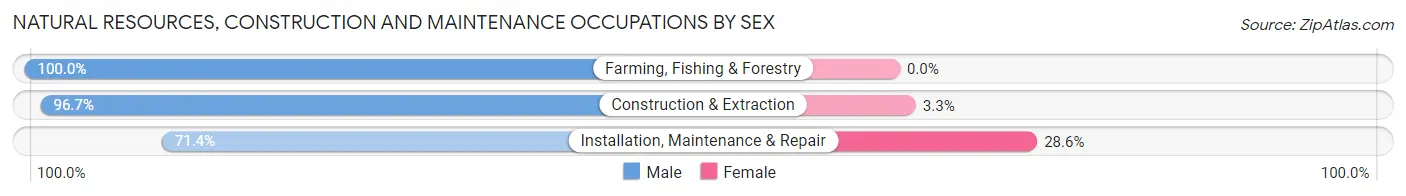
Natural Resources, Construction and Maintenance Occupations by Sex
| Occupation | Male | Female |
| Farming, Fishing & Forestry | 6 (100.0%) | 0 (0.0%) |
| Construction & Extraction | 29 (96.7%) | 1 (3.3%) |
| Installation, Maintenance & Repair | 10 (71.4%) | 4 (28.6%) |
| Total (Category) | 45 (90.0%) | 5 (10.0%) |
| Total (Overall) | 102 (40.0%) | 153 (60.0%) |
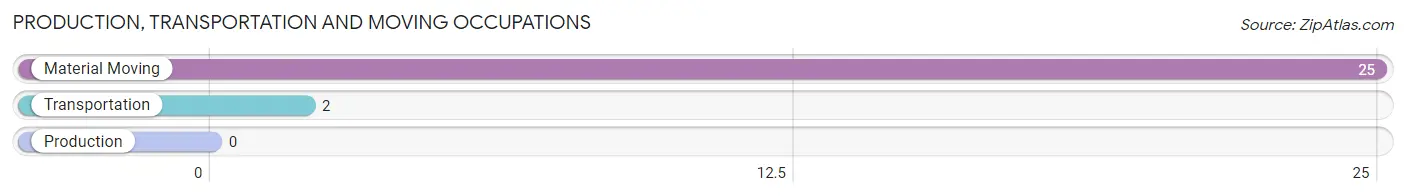
Production, Transportation and Moving Occupations
The most common Production, Transportation and Moving occupations in Rule are Material Moving (25 | 9.8%), and Transportation (2 | 0.8%).
Production, Transportation and Moving Occupations by Sex
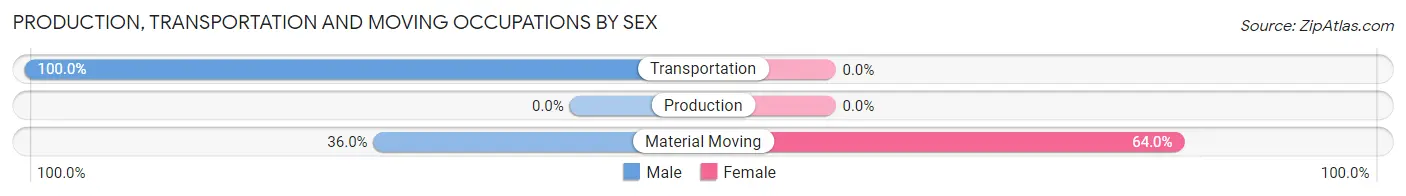
| Occupation | Male | Female |
| Production | 0 (0.0%) | 0 (0.0%) |
| Transportation | 2 (100.0%) | 0 (0.0%) |
| Material Moving | 9 (36.0%) | 16 (64.0%) |
| Total (Category) | 11 (40.7%) | 16 (59.3%) |
| Total (Overall) | 102 (40.0%) | 153 (60.0%) |
Employment Industries by Sex in Rule
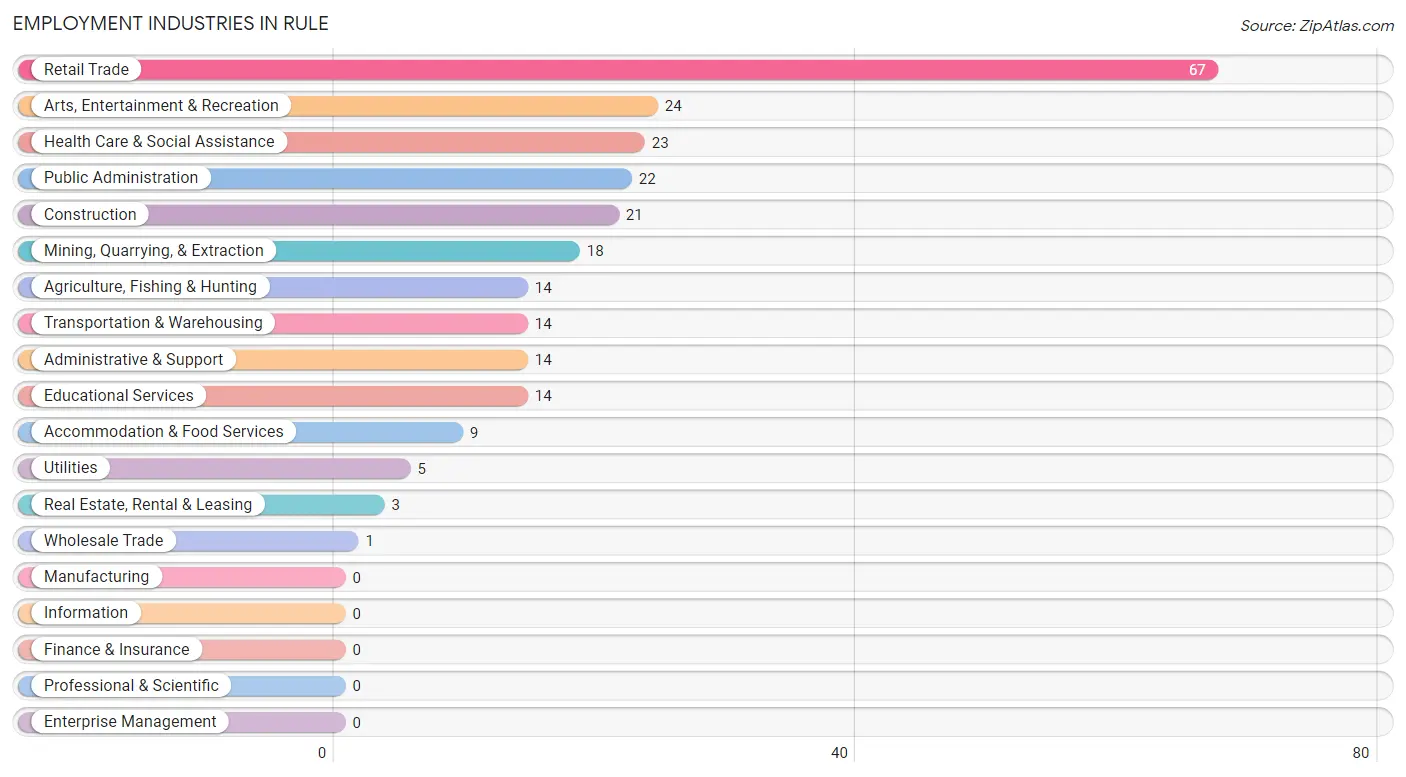
Employment Industries in Rule
The major employment industries in Rule include Retail Trade (67 | 26.3%), Arts, Entertainment & Recreation (24 | 9.4%), Health Care & Social Assistance (23 | 9.0%), Public Administration (22 | 8.6%), and Construction (21 | 8.2%).
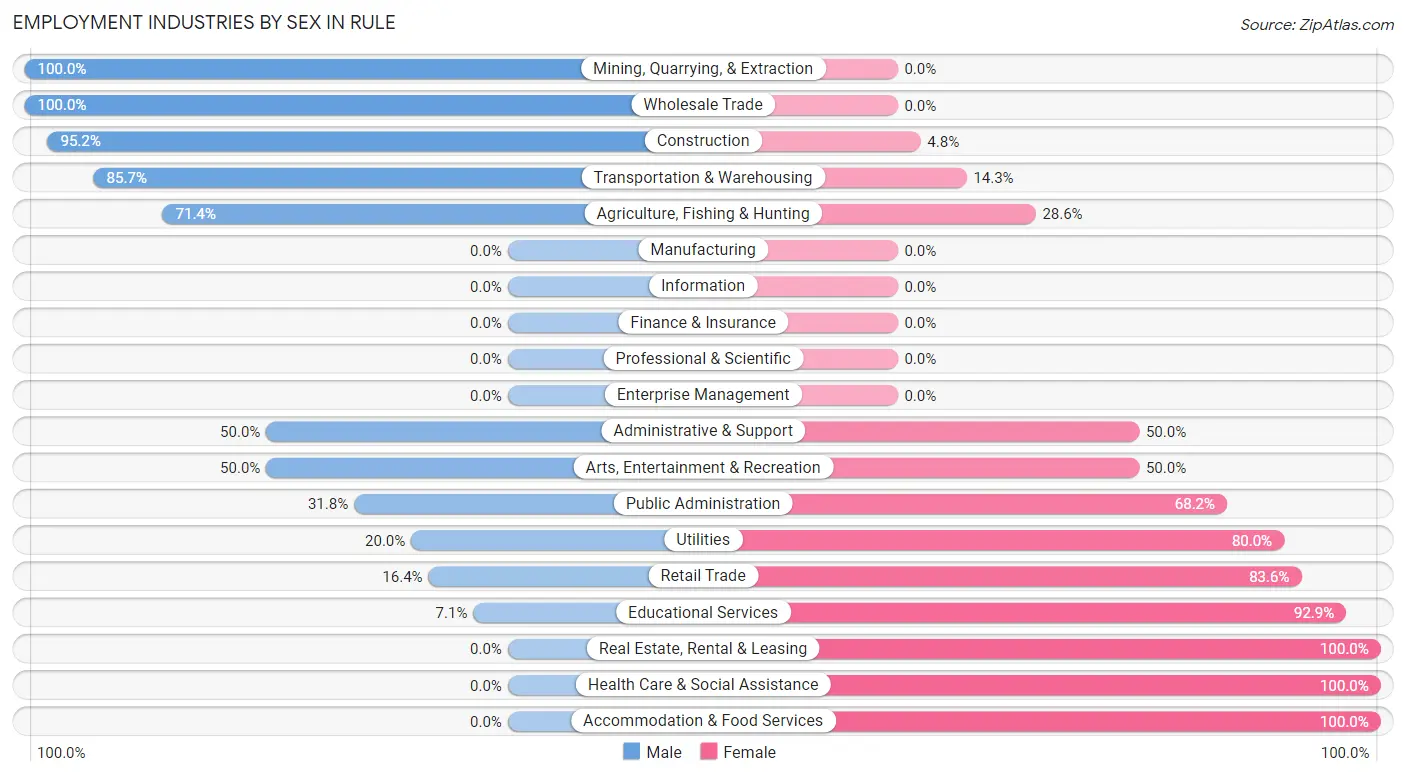
Employment Industries by Sex in Rule
The Rule industries that see more men than women are Mining, Quarrying, & Extraction (100.0%), Wholesale Trade (100.0%), and Construction (95.2%), whereas the industries that tend to have a higher number of women are Real Estate, Rental & Leasing (100.0%), Health Care & Social Assistance (100.0%), and Accommodation & Food Services (100.0%).
| Industry | Male | Female |
| Agriculture, Fishing & Hunting | 10 (71.4%) | 4 (28.6%) |
| Mining, Quarrying, & Extraction | 18 (100.0%) | 0 (0.0%) |
| Construction | 20 (95.2%) | 1 (4.8%) |
| Manufacturing | 0 (0.0%) | 0 (0.0%) |
| Wholesale Trade | 1 (100.0%) | 0 (0.0%) |
| Retail Trade | 11 (16.4%) | 56 (83.6%) |
| Transportation & Warehousing | 12 (85.7%) | 2 (14.3%) |
| Utilities | 1 (20.0%) | 4 (80.0%) |
| Information | 0 (0.0%) | 0 (0.0%) |
| Finance & Insurance | 0 (0.0%) | 0 (0.0%) |
| Real Estate, Rental & Leasing | 0 (0.0%) | 3 (100.0%) |
| Professional & Scientific | 0 (0.0%) | 0 (0.0%) |
| Enterprise Management | 0 (0.0%) | 0 (0.0%) |
| Administrative & Support | 7 (50.0%) | 7 (50.0%) |
| Educational Services | 1 (7.1%) | 13 (92.9%) |
| Health Care & Social Assistance | 0 (0.0%) | 23 (100.0%) |
| Arts, Entertainment & Recreation | 12 (50.0%) | 12 (50.0%) |
| Accommodation & Food Services | 0 (0.0%) | 9 (100.0%) |
| Public Administration | 7 (31.8%) | 15 (68.2%) |
| Total | 102 (40.0%) | 153 (60.0%) |
Education in Rule
School Enrollment in Rule
The most common levels of schooling among the 100 students in Rule are middle school (35 | 35.0%), high school (22 | 22.0%), and elementary school (19 | 19.0%).
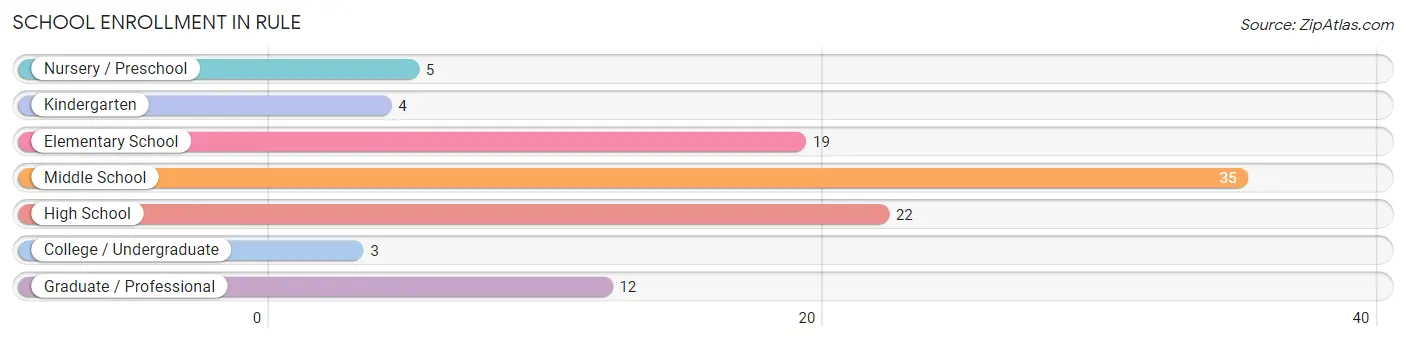
| School Level | # Students | % Students |
| Nursery / Preschool | 5 | 5.0% |
| Kindergarten | 4 | 4.0% |
| Elementary School | 19 | 19.0% |
| Middle School | 35 | 35.0% |
| High School | 22 | 22.0% |
| College / Undergraduate | 3 | 3.0% |
| Graduate / Professional | 12 | 12.0% |
| Total | 100 | 100.0% |
School Enrollment by Age by Funding Source in Rule
Out of a total of 100 students who are enrolled in schools in Rule, 4 (4.0%) attend a private institution, while the remaining 96 (96.0%) are enrolled in public schools. The age group of 5 to 9 year old has the highest likelihood of being enrolled in private schools, with 2 (8.0% in the age bracket) enrolled. Conversely, the age group of 15 to 17 year olds has the lowest likelihood of being enrolled in a private school, with 15 (100.0% in the age bracket) attending a public institution.
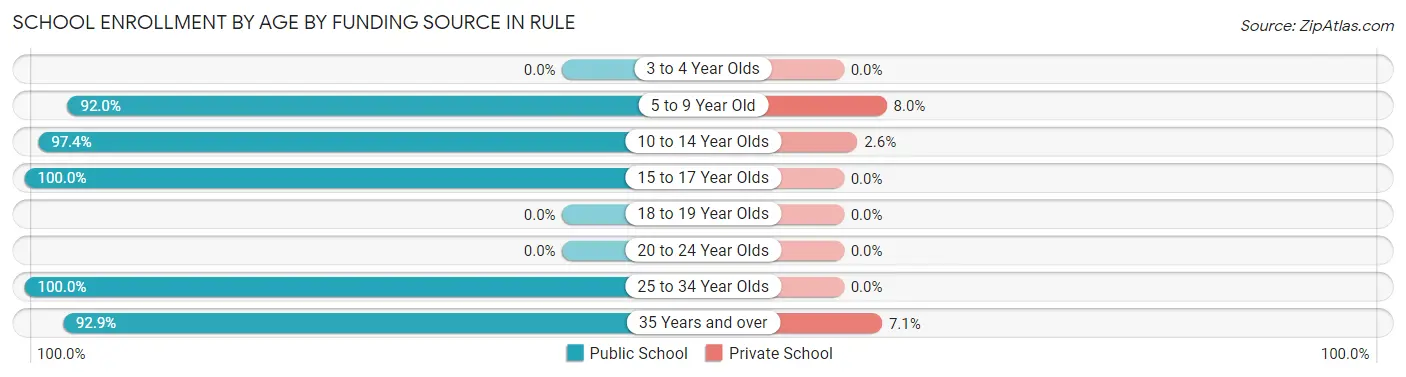
| Age Bracket | Public School | Private School |
| 3 to 4 Year Olds | 0 (0.0%) | 0 (0.0%) |
| 5 to 9 Year Old | 23 (92.0%) | 2 (8.0%) |
| 10 to 14 Year Olds | 38 (97.4%) | 1 (2.6%) |
| 15 to 17 Year Olds | 15 (100.0%) | 0 (0.0%) |
| 18 to 19 Year Olds | 0 (0.0%) | 0 (0.0%) |
| 20 to 24 Year Olds | 0 (0.0%) | 0 (0.0%) |
| 25 to 34 Year Olds | 7 (100.0%) | 0 (0.0%) |
| 35 Years and over | 13 (92.9%) | 1 (7.1%) |
| Total | 96 (96.0%) | 4 (4.0%) |
Educational Attainment by Field of Study in Rule
Visual & performing arts (31 | 41.3%), physical & health sciences (11 | 14.7%), education (11 | 14.7%), science & technology (7 | 9.3%), and business (7 | 9.3%) are the most common fields of study among 75 individuals in Rule who have obtained a bachelor's degree or higher.
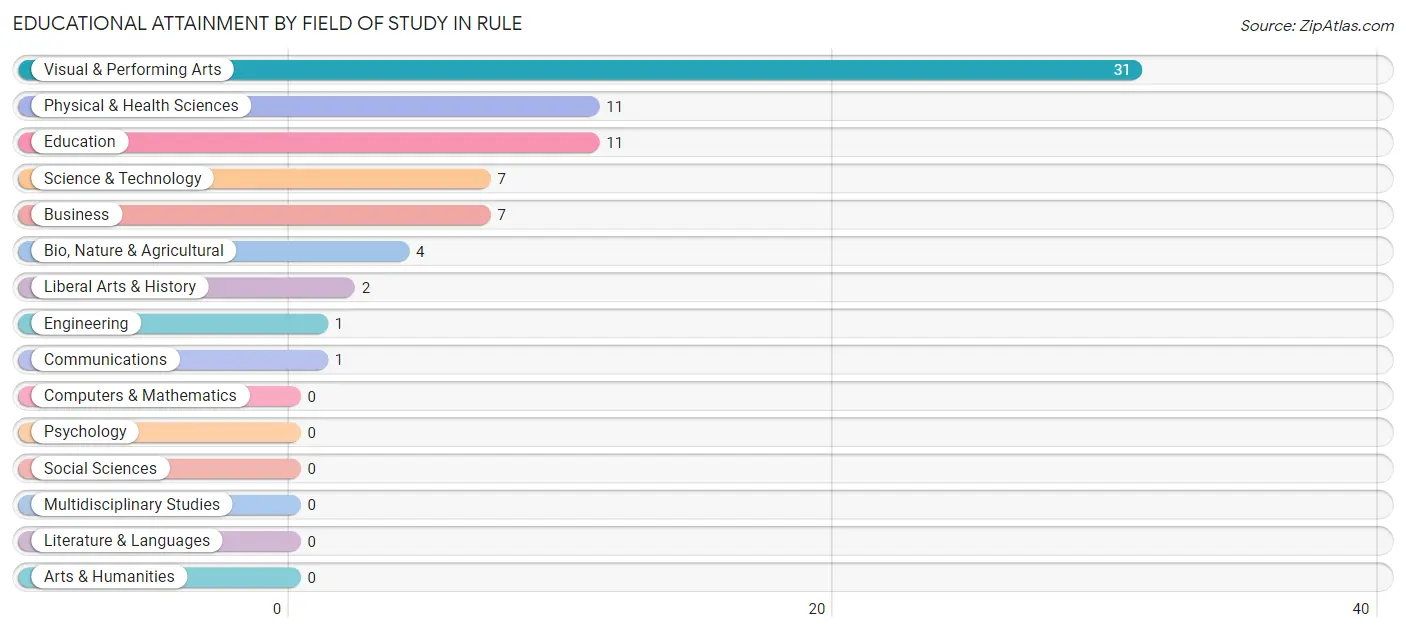
| Field of Study | # Graduates | % Graduates |
| Computers & Mathematics | 0 | 0.0% |
| Bio, Nature & Agricultural | 4 | 5.3% |
| Physical & Health Sciences | 11 | 14.7% |
| Psychology | 0 | 0.0% |
| Social Sciences | 0 | 0.0% |
| Engineering | 1 | 1.3% |
| Multidisciplinary Studies | 0 | 0.0% |
| Science & Technology | 7 | 9.3% |
| Business | 7 | 9.3% |
| Education | 11 | 14.7% |
| Literature & Languages | 0 | 0.0% |
| Liberal Arts & History | 2 | 2.7% |
| Visual & Performing Arts | 31 | 41.3% |
| Communications | 1 | 1.3% |
| Arts & Humanities | 0 | 0.0% |
| Total | 75 | 100.0% |
Transportation & Commute in Rule
Vehicle Availability by Sex in Rule
The most prevalent vehicle ownership categories in Rule are males with 3 vehicles (48, accounting for 47.1%) and females with 3 vehicles (54, making up 31.4%).
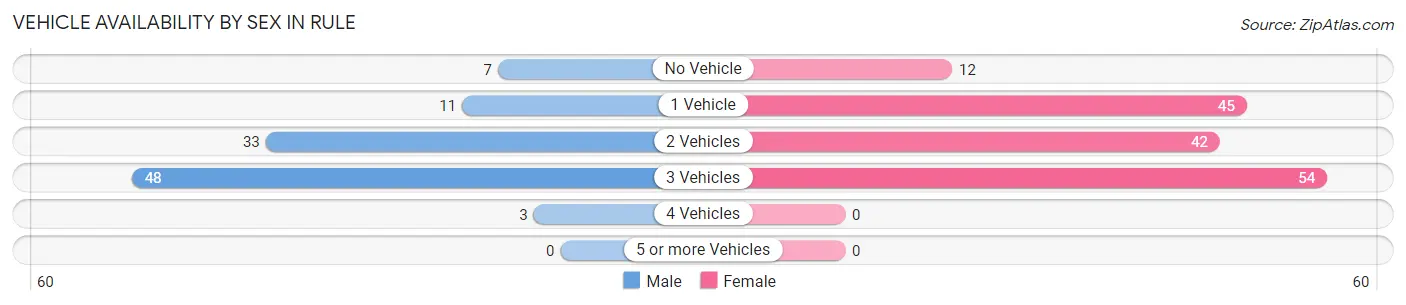
| Vehicles Available | Male | Female |
| No Vehicle | 7 (6.9%) | 12 (7.8%) |
| 1 Vehicle | 11 (10.8%) | 45 (29.4%) |
| 2 Vehicles | 33 (32.4%) | 42 (27.5%) |
| 3 Vehicles | 48 (47.1%) | 54 (35.3%) |
| 4 Vehicles | 3 (2.9%) | 0 (0.0%) |
| 5 or more Vehicles | 0 (0.0%) | 0 (0.0%) |
| Total | 102 (100.0%) | 153 (100.0%) |
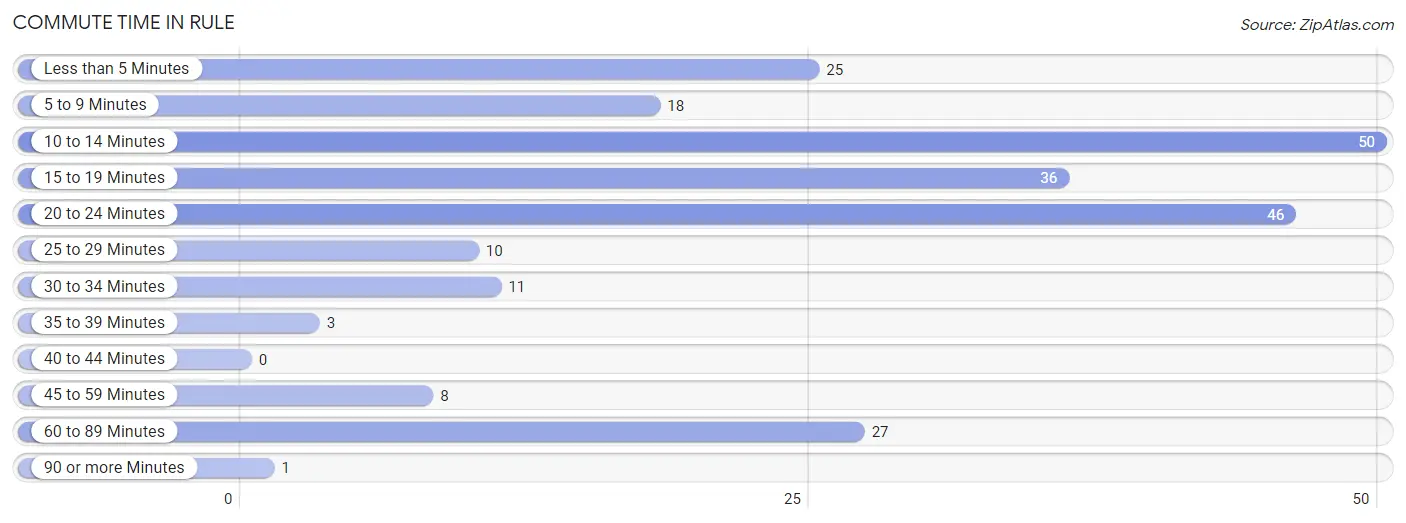
Commute Time in Rule
The most frequently occuring commute durations in Rule are 10 to 14 minutes (50 commuters, 21.3%), 20 to 24 minutes (46 commuters, 19.6%), and 15 to 19 minutes (36 commuters, 15.3%).
| Commute Time | # Commuters | % Commuters |
| Less than 5 Minutes | 25 | 10.6% |
| 5 to 9 Minutes | 18 | 7.7% |
| 10 to 14 Minutes | 50 | 21.3% |
| 15 to 19 Minutes | 36 | 15.3% |
| 20 to 24 Minutes | 46 | 19.6% |
| 25 to 29 Minutes | 10 | 4.3% |
| 30 to 34 Minutes | 11 | 4.7% |
| 35 to 39 Minutes | 3 | 1.3% |
| 40 to 44 Minutes | 0 | 0.0% |
| 45 to 59 Minutes | 8 | 3.4% |
| 60 to 89 Minutes | 27 | 11.5% |
| 90 or more Minutes | 1 | 0.4% |
Commute Time by Sex in Rule
The most common commute times in Rule are 15 to 19 minutes (26 commuters, 25.5%) for males and 20 to 24 minutes (37 commuters, 27.8%) for females.
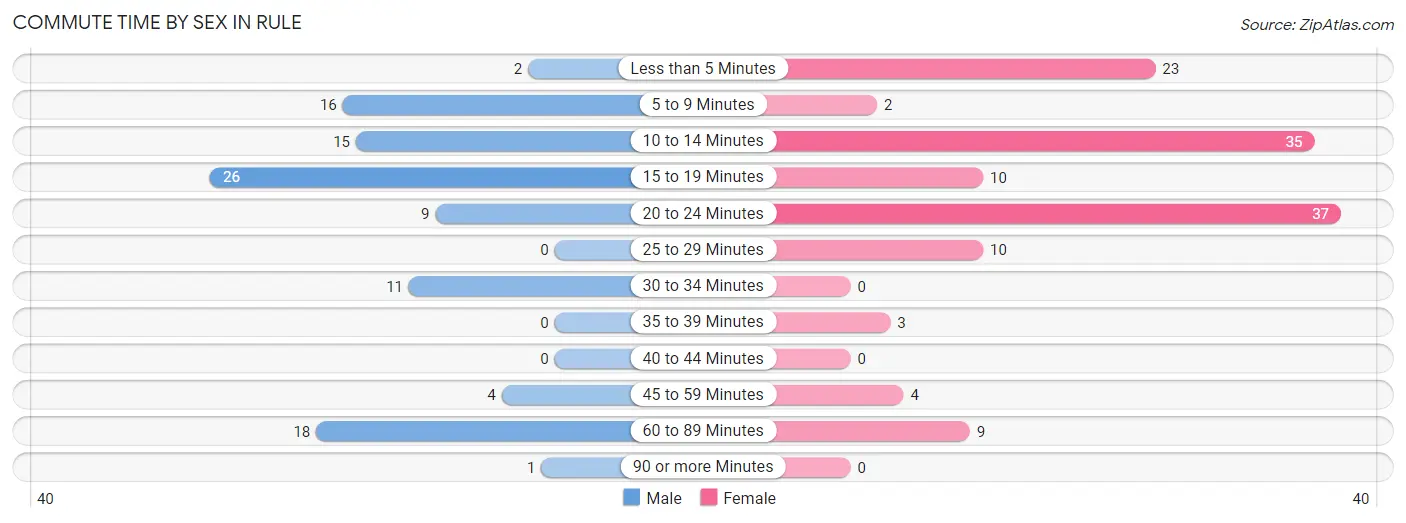
| Commute Time | Male | Female |
| Less than 5 Minutes | 2 (2.0%) | 23 (17.3%) |
| 5 to 9 Minutes | 16 (15.7%) | 2 (1.5%) |
| 10 to 14 Minutes | 15 (14.7%) | 35 (26.3%) |
| 15 to 19 Minutes | 26 (25.5%) | 10 (7.5%) |
| 20 to 24 Minutes | 9 (8.8%) | 37 (27.8%) |
| 25 to 29 Minutes | 0 (0.0%) | 10 (7.5%) |
| 30 to 34 Minutes | 11 (10.8%) | 0 (0.0%) |
| 35 to 39 Minutes | 0 (0.0%) | 3 (2.3%) |
| 40 to 44 Minutes | 0 (0.0%) | 0 (0.0%) |
| 45 to 59 Minutes | 4 (3.9%) | 4 (3.0%) |
| 60 to 89 Minutes | 18 (17.6%) | 9 (6.8%) |
| 90 or more Minutes | 1 (1.0%) | 0 (0.0%) |
Time of Departure to Work by Sex in Rule
The most frequent times of departure to work in Rule are 7:00 AM to 7:29 AM (23, 22.6%) for males and 6:30 AM to 6:59 AM (41, 30.8%) for females.
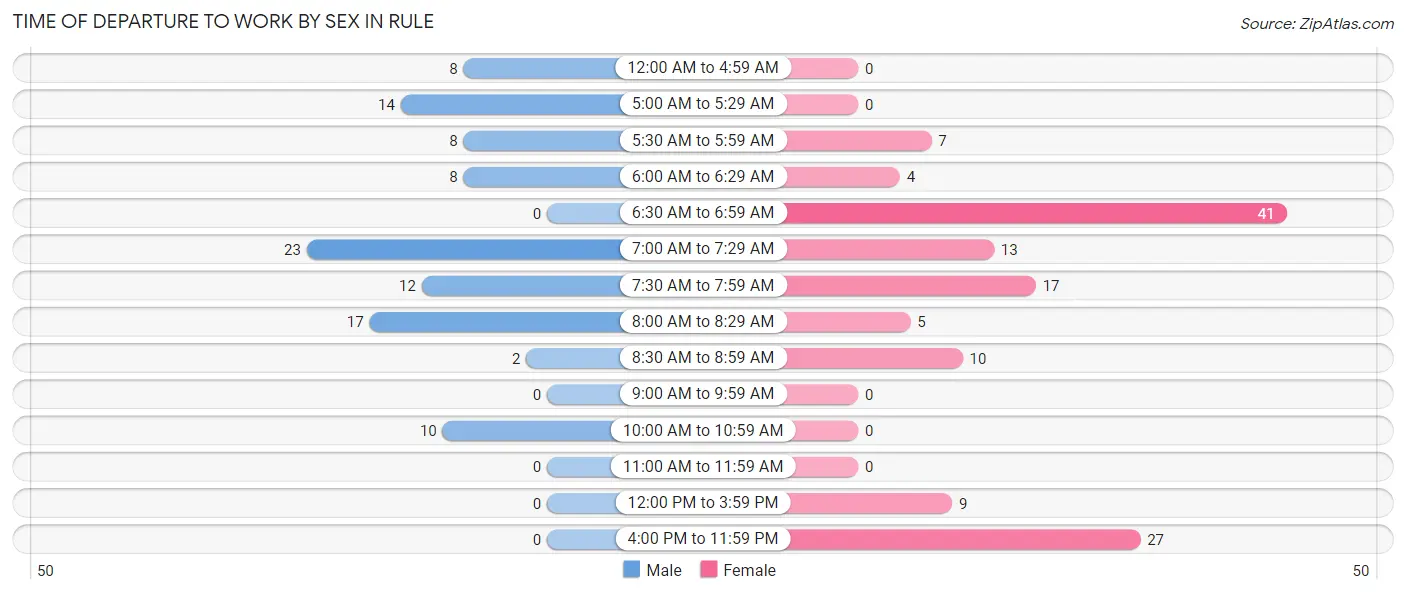
| Time of Departure | Male | Female |
| 12:00 AM to 4:59 AM | 8 (7.8%) | 0 (0.0%) |
| 5:00 AM to 5:29 AM | 14 (13.7%) | 0 (0.0%) |
| 5:30 AM to 5:59 AM | 8 (7.8%) | 7 (5.3%) |
| 6:00 AM to 6:29 AM | 8 (7.8%) | 4 (3.0%) |
| 6:30 AM to 6:59 AM | 0 (0.0%) | 41 (30.8%) |
| 7:00 AM to 7:29 AM | 23 (22.6%) | 13 (9.8%) |
| 7:30 AM to 7:59 AM | 12 (11.8%) | 17 (12.8%) |
| 8:00 AM to 8:29 AM | 17 (16.7%) | 5 (3.8%) |
| 8:30 AM to 8:59 AM | 2 (2.0%) | 10 (7.5%) |
| 9:00 AM to 9:59 AM | 0 (0.0%) | 0 (0.0%) |
| 10:00 AM to 10:59 AM | 10 (9.8%) | 0 (0.0%) |
| 11:00 AM to 11:59 AM | 0 (0.0%) | 0 (0.0%) |
| 12:00 PM to 3:59 PM | 0 (0.0%) | 9 (6.8%) |
| 4:00 PM to 11:59 PM | 0 (0.0%) | 27 (20.3%) |
| Total | 102 (100.0%) | 133 (100.0%) |
Housing Occupancy in Rule
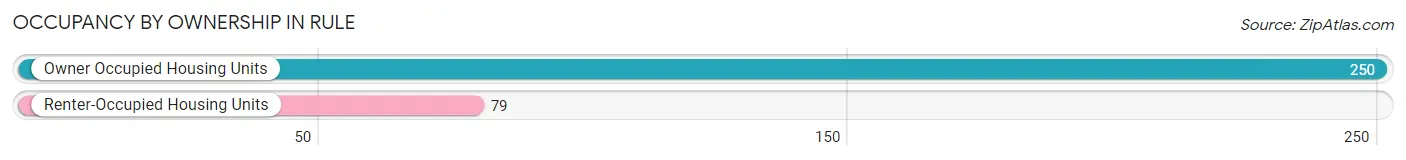
Occupancy by Ownership in Rule
Of the total 329 dwellings in Rule, owner-occupied units account for 250 (76.0%), while renter-occupied units make up 79 (24.0%).
| Occupancy | # Housing Units | % Housing Units |
| Owner Occupied Housing Units | 250 | 76.0% |
| Renter-Occupied Housing Units | 79 | 24.0% |
| Total Occupied Housing Units | 329 | 100.0% |
Occupancy by Household Size in Rule
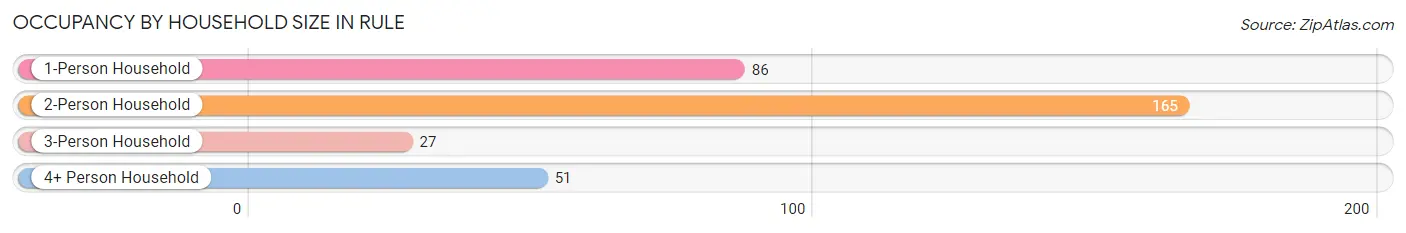
| Household Size | # Housing Units | % Housing Units |
| 1-Person Household | 86 | 26.1% |
| 2-Person Household | 165 | 50.1% |
| 3-Person Household | 27 | 8.2% |
| 4+ Person Household | 51 | 15.5% |
| Total Housing Units | 329 | 100.0% |
Occupancy by Ownership by Household Size in Rule
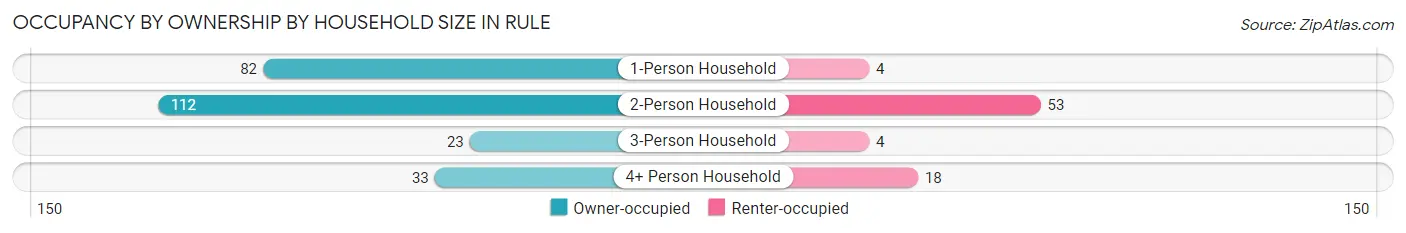
| Household Size | Owner-occupied | Renter-occupied |
| 1-Person Household | 82 (95.4%) | 4 (4.6%) |
| 2-Person Household | 112 (67.9%) | 53 (32.1%) |
| 3-Person Household | 23 (85.2%) | 4 (14.8%) |
| 4+ Person Household | 33 (64.7%) | 18 (35.3%) |
| Total Housing Units | 250 (76.0%) | 79 (24.0%) |
Occupancy by Educational Attainment in Rule
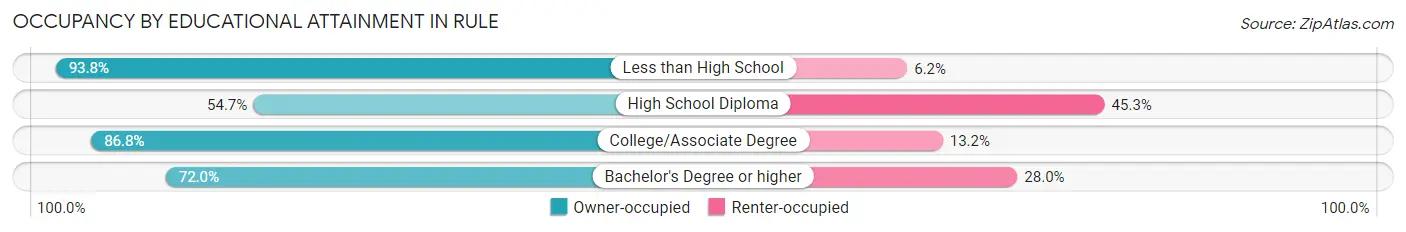
| Household Size | Owner-occupied | Renter-occupied |
| Less than High School | 76 (93.8%) | 5 (6.2%) |
| High School Diploma | 64 (54.7%) | 53 (45.3%) |
| College/Associate Degree | 92 (86.8%) | 14 (13.2%) |
| Bachelor's Degree or higher | 18 (72.0%) | 7 (28.0%) |
Occupancy by Age of Householder in Rule
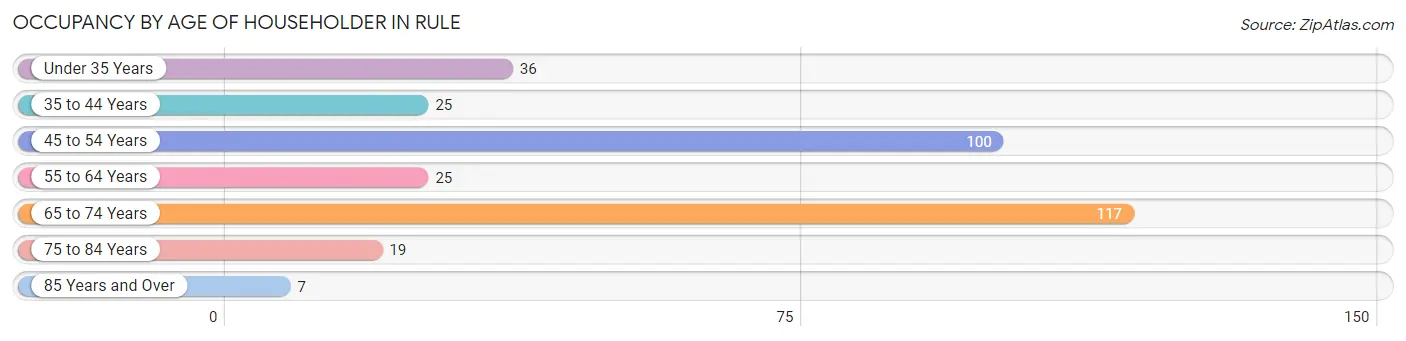
| Age Bracket | # Households | % Households |
| Under 35 Years | 36 | 10.9% |
| 35 to 44 Years | 25 | 7.6% |
| 45 to 54 Years | 100 | 30.4% |
| 55 to 64 Years | 25 | 7.6% |
| 65 to 74 Years | 117 | 35.6% |
| 75 to 84 Years | 19 | 5.8% |
| 85 Years and Over | 7 | 2.1% |
| Total | 329 | 100.0% |
Housing Finances in Rule
Median Income by Occupancy in Rule
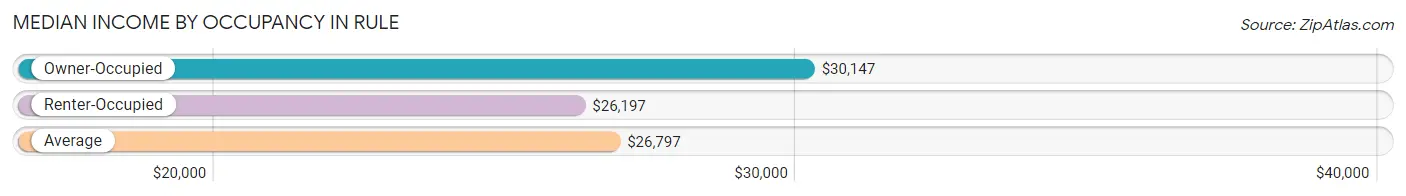
| Occupancy Type | # Households | Median Income |
| Owner-Occupied | 250 (76.0%) | $30,147 |
| Renter-Occupied | 79 (24.0%) | $26,197 |
| Average | 329 (100.0%) | $26,797 |
Occupancy by Householder Income Bracket in Rule
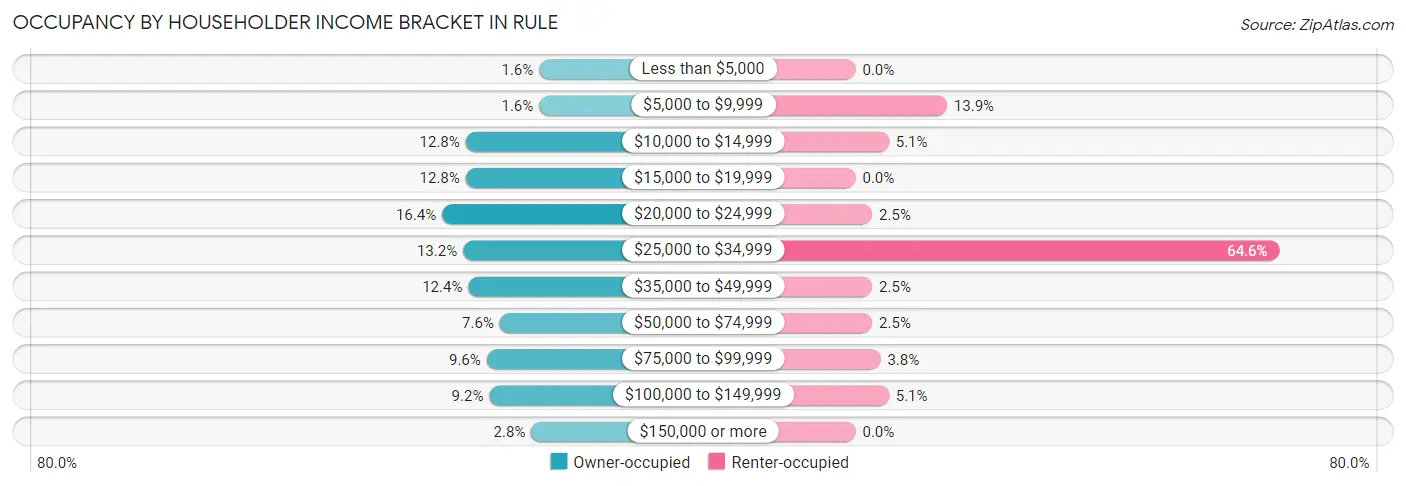
| Income Bracket | Owner-occupied | Renter-occupied |
| Less than $5,000 | 4 (1.6%) | 0 (0.0%) |
| $5,000 to $9,999 | 4 (1.6%) | 11 (13.9%) |
| $10,000 to $14,999 | 32 (12.8%) | 4 (5.1%) |
| $15,000 to $19,999 | 32 (12.8%) | 0 (0.0%) |
| $20,000 to $24,999 | 41 (16.4%) | 2 (2.5%) |
| $25,000 to $34,999 | 33 (13.2%) | 51 (64.6%) |
| $35,000 to $49,999 | 31 (12.4%) | 2 (2.5%) |
| $50,000 to $74,999 | 19 (7.6%) | 2 (2.5%) |
| $75,000 to $99,999 | 24 (9.6%) | 3 (3.8%) |
| $100,000 to $149,999 | 23 (9.2%) | 4 (5.1%) |
| $150,000 or more | 7 (2.8%) | 0 (0.0%) |
| Total | 250 (100.0%) | 79 (100.0%) |
Monthly Housing Cost Tiers in Rule
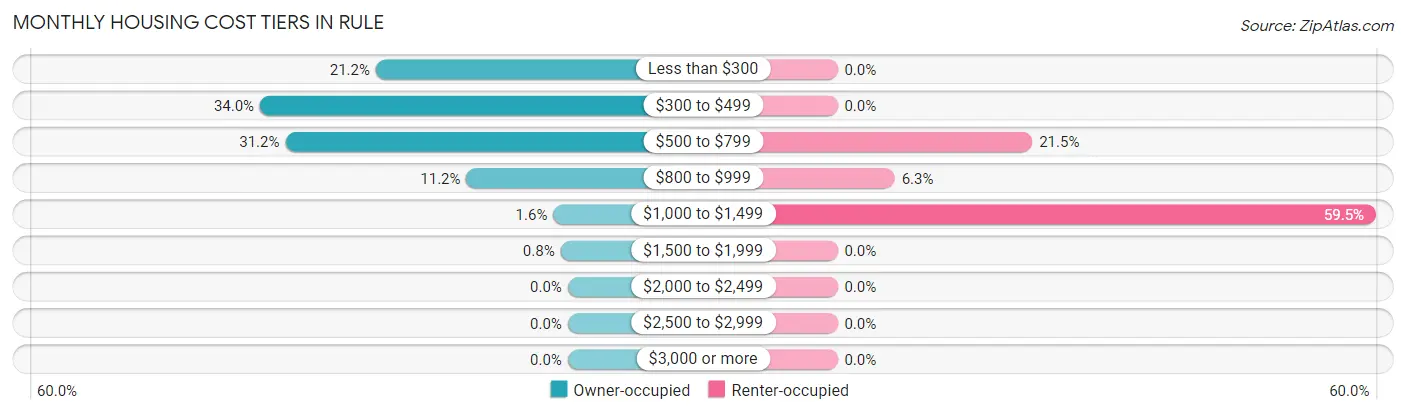
| Monthly Cost | Owner-occupied | Renter-occupied |
| Less than $300 | 53 (21.2%) | 0 (0.0%) |
| $300 to $499 | 85 (34.0%) | 0 (0.0%) |
| $500 to $799 | 78 (31.2%) | 17 (21.5%) |
| $800 to $999 | 28 (11.2%) | 5 (6.3%) |
| $1,000 to $1,499 | 4 (1.6%) | 47 (59.5%) |
| $1,500 to $1,999 | 2 (0.8%) | 0 (0.0%) |
| $2,000 to $2,499 | 0 (0.0%) | 0 (0.0%) |
| $2,500 to $2,999 | 0 (0.0%) | 0 (0.0%) |
| $3,000 or more | 0 (0.0%) | 0 (0.0%) |
| Total | 250 (100.0%) | 79 (100.0%) |
Physical Housing Characteristics in Rule
Housing Structures in Rule
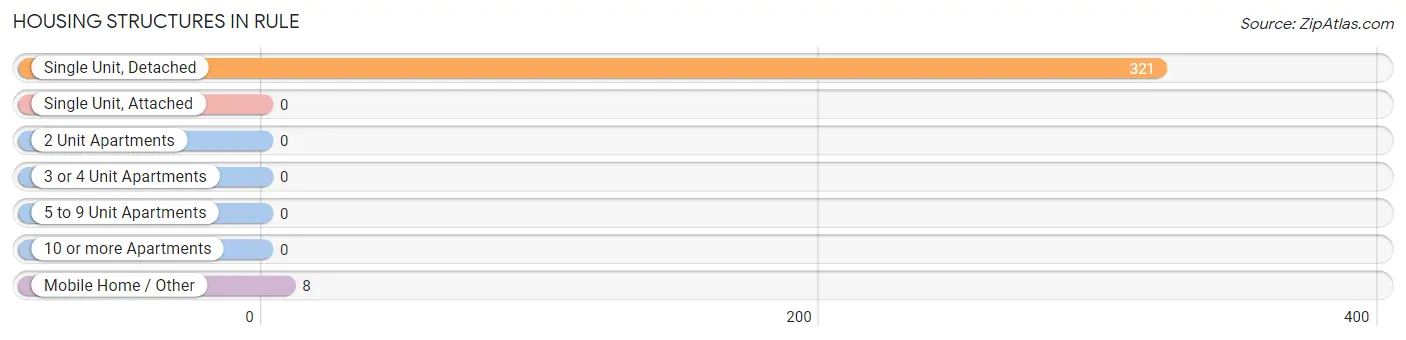
| Structure Type | # Housing Units | % Housing Units |
| Single Unit, Detached | 321 | 97.6% |
| Single Unit, Attached | 0 | 0.0% |
| 2 Unit Apartments | 0 | 0.0% |
| 3 or 4 Unit Apartments | 0 | 0.0% |
| 5 to 9 Unit Apartments | 0 | 0.0% |
| 10 or more Apartments | 0 | 0.0% |
| Mobile Home / Other | 8 | 2.4% |
| Total | 329 | 100.0% |
Housing Structures by Occupancy in Rule
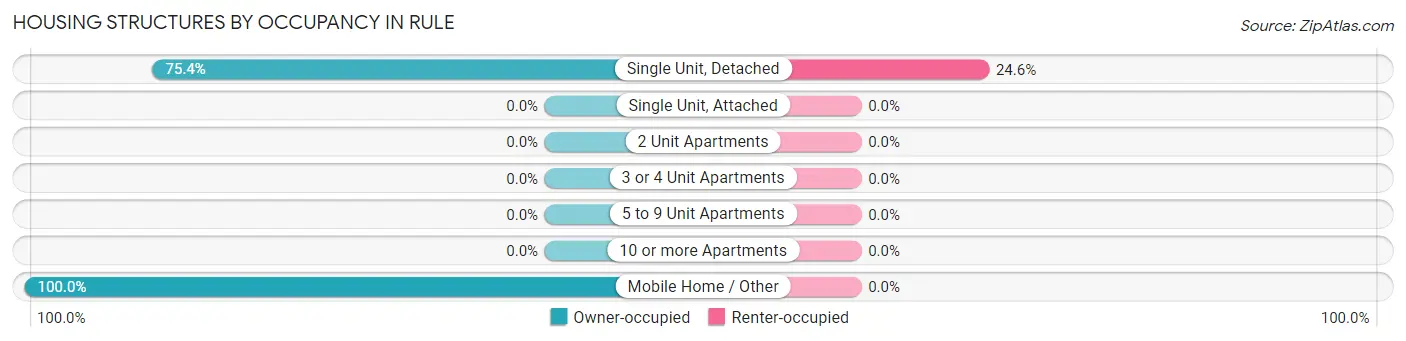
| Structure Type | Owner-occupied | Renter-occupied |
| Single Unit, Detached | 242 (75.4%) | 79 (24.6%) |
| Single Unit, Attached | 0 (0.0%) | 0 (0.0%) |
| 2 Unit Apartments | 0 (0.0%) | 0 (0.0%) |
| 3 or 4 Unit Apartments | 0 (0.0%) | 0 (0.0%) |
| 5 to 9 Unit Apartments | 0 (0.0%) | 0 (0.0%) |
| 10 or more Apartments | 0 (0.0%) | 0 (0.0%) |
| Mobile Home / Other | 8 (100.0%) | 0 (0.0%) |
| Total | 250 (76.0%) | 79 (24.0%) |
Housing Structures by Number of Rooms in Rule
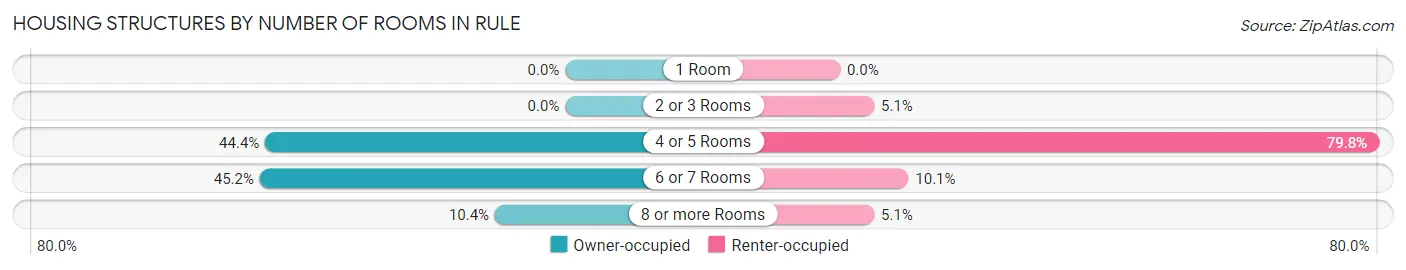
| Number of Rooms | Owner-occupied | Renter-occupied |
| 1 Room | 0 (0.0%) | 0 (0.0%) |
| 2 or 3 Rooms | 0 (0.0%) | 4 (5.1%) |
| 4 or 5 Rooms | 111 (44.4%) | 63 (79.7%) |
| 6 or 7 Rooms | 113 (45.2%) | 8 (10.1%) |
| 8 or more Rooms | 26 (10.4%) | 4 (5.1%) |
| Total | 250 (100.0%) | 79 (100.0%) |
Housing Structure by Heating Type in Rule
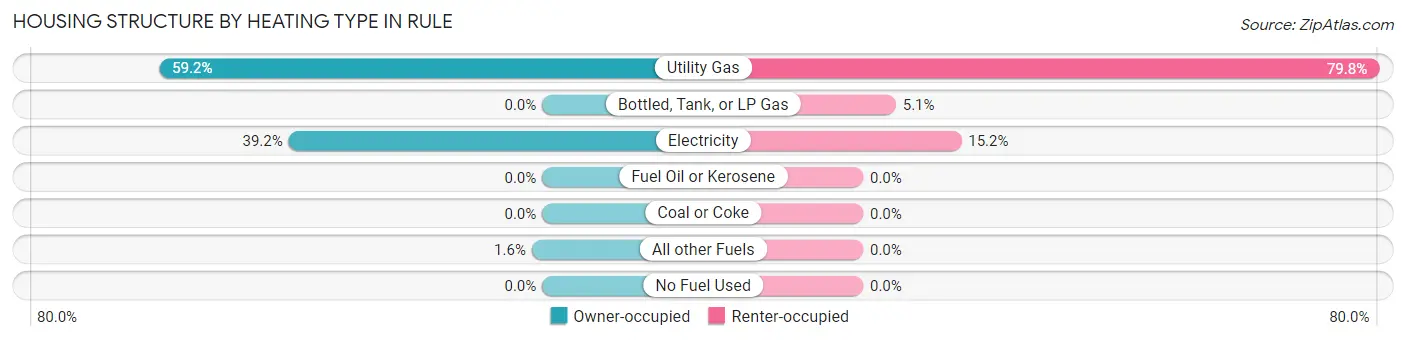
| Heating Type | Owner-occupied | Renter-occupied |
| Utility Gas | 148 (59.2%) | 63 (79.7%) |
| Bottled, Tank, or LP Gas | 0 (0.0%) | 4 (5.1%) |
| Electricity | 98 (39.2%) | 12 (15.2%) |
| Fuel Oil or Kerosene | 0 (0.0%) | 0 (0.0%) |
| Coal or Coke | 0 (0.0%) | 0 (0.0%) |
| All other Fuels | 4 (1.6%) | 0 (0.0%) |
| No Fuel Used | 0 (0.0%) | 0 (0.0%) |
| Total | 250 (100.0%) | 79 (100.0%) |
Household Vehicle Usage in Rule
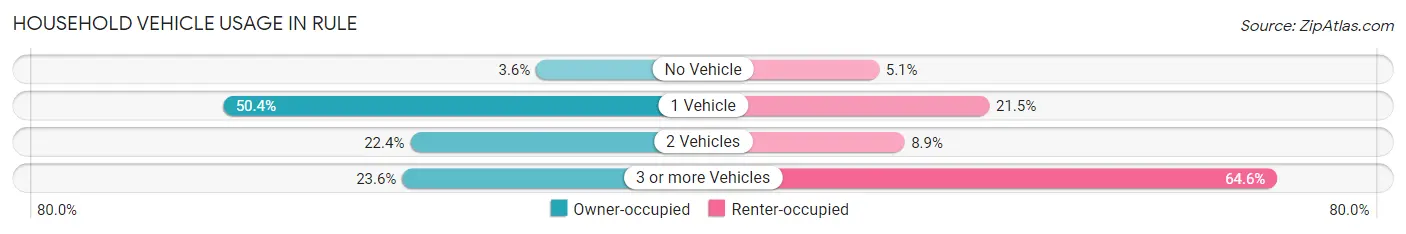
| Vehicles per Household | Owner-occupied | Renter-occupied |
| No Vehicle | 9 (3.6%) | 4 (5.1%) |
| 1 Vehicle | 126 (50.4%) | 17 (21.5%) |
| 2 Vehicles | 56 (22.4%) | 7 (8.9%) |
| 3 or more Vehicles | 59 (23.6%) | 51 (64.6%) |
| Total | 250 (100.0%) | 79 (100.0%) |
Real Estate & Mortgages in Rule
Real Estate and Mortgage Overview in Rule
| Characteristic | Without Mortgage | With Mortgage |
| Housing Units | 165 | 85 |
| Median Property Value | $46,900 | $42,900 |
| Median Household Income | $31,250 | $0 |
| Monthly Housing Costs | $351 | $0 |
| Real Estate Taxes | $473 | $0 |
Property Value by Mortgage Status in Rule
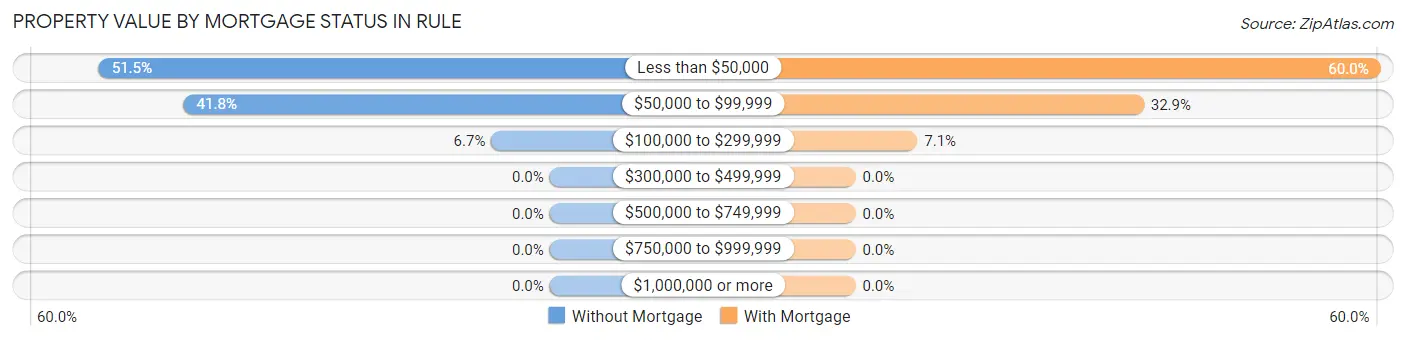
| Property Value | Without Mortgage | With Mortgage |
| Less than $50,000 | 85 (51.5%) | 51 (60.0%) |
| $50,000 to $99,999 | 69 (41.8%) | 28 (32.9%) |
| $100,000 to $299,999 | 11 (6.7%) | 6 (7.1%) |
| $300,000 to $499,999 | 0 (0.0%) | 0 (0.0%) |
| $500,000 to $749,999 | 0 (0.0%) | 0 (0.0%) |
| $750,000 to $999,999 | 0 (0.0%) | 0 (0.0%) |
| $1,000,000 or more | 0 (0.0%) | 0 (0.0%) |
| Total | 165 (100.0%) | 85 (100.0%) |
Household Income by Mortgage Status in Rule
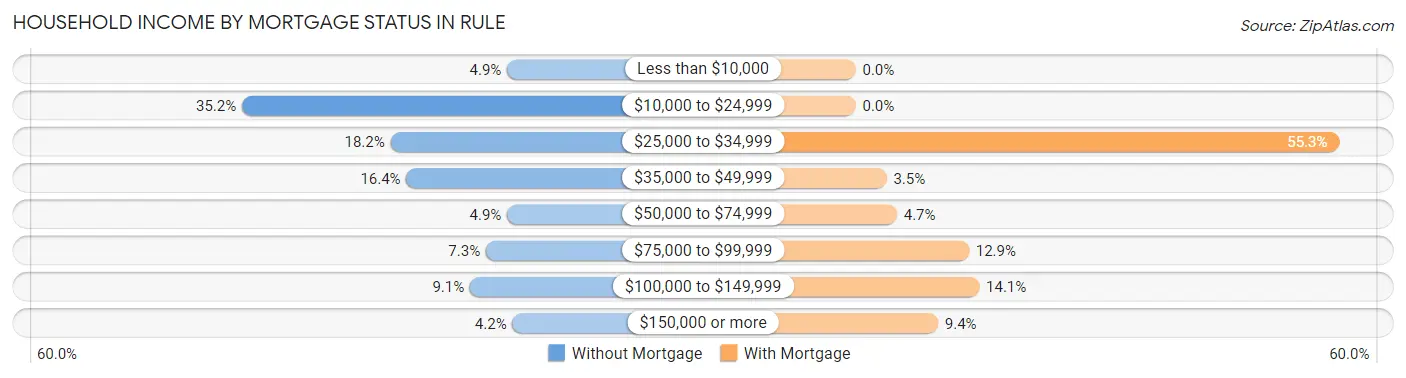
| Household Income | Without Mortgage | With Mortgage |
| Less than $10,000 | 8 (4.9%) | 0 (0.0%) |
| $10,000 to $24,999 | 58 (35.1%) | 0 (0.0%) |
| $25,000 to $34,999 | 30 (18.2%) | 47 (55.3%) |
| $35,000 to $49,999 | 27 (16.4%) | 3 (3.5%) |
| $50,000 to $74,999 | 8 (4.9%) | 4 (4.7%) |
| $75,000 to $99,999 | 12 (7.3%) | 11 (12.9%) |
| $100,000 to $149,999 | 15 (9.1%) | 12 (14.1%) |
| $150,000 or more | 7 (4.2%) | 8 (9.4%) |
| Total | 165 (100.0%) | 85 (100.0%) |
Property Value to Household Income Ratio in Rule
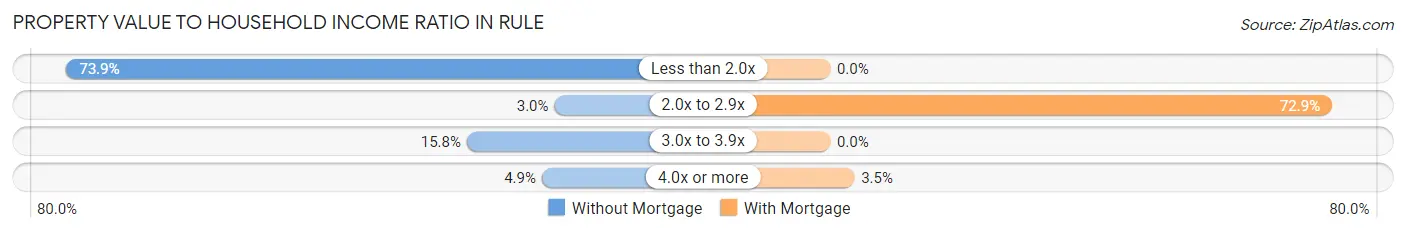
| Value-to-Income Ratio | Without Mortgage | With Mortgage |
| Less than 2.0x | 122 (73.9%) | 0 (0.0%) |
| 2.0x to 2.9x | 5 (3.0%) | 62 (72.9%) |
| 3.0x to 3.9x | 26 (15.8%) | 0 (0.0%) |
| 4.0x or more | 8 (4.9%) | 3 (3.5%) |
| Total | 165 (100.0%) | 85 (100.0%) |
Real Estate Taxes by Mortgage Status in Rule
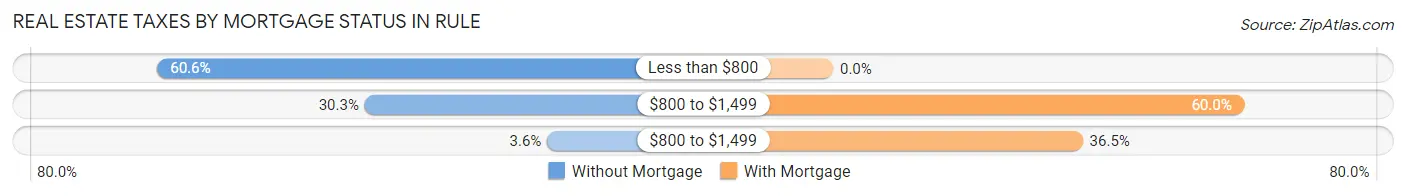
| Property Taxes | Without Mortgage | With Mortgage |
| Less than $800 | 100 (60.6%) | 0 (0.0%) |
| $800 to $1,499 | 50 (30.3%) | 51 (60.0%) |
| $800 to $1,499 | 6 (3.6%) | 31 (36.5%) |
| Total | 165 (100.0%) | 85 (100.0%) |
Health & Disability in Rule
Health Insurance Coverage by Age in Rule
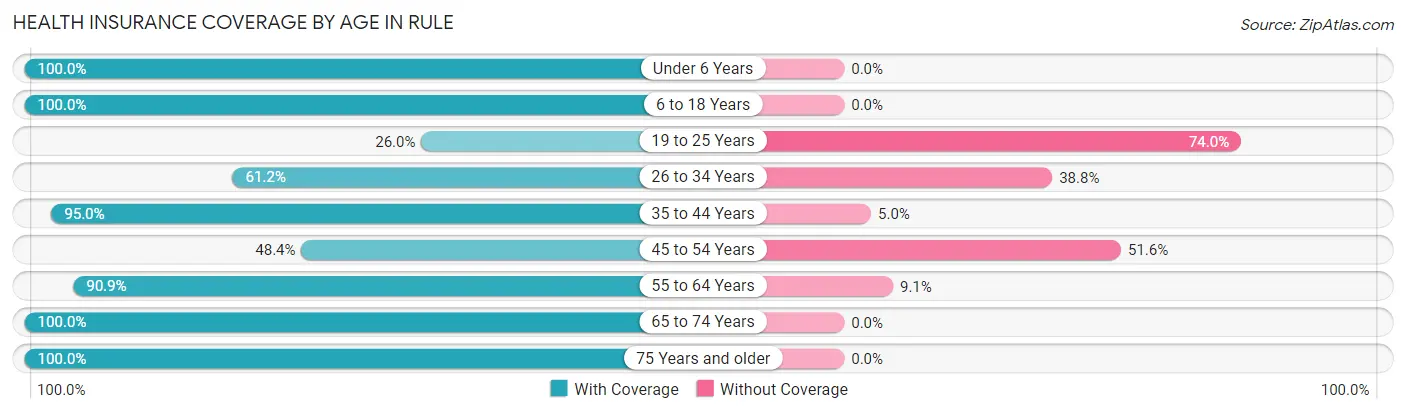
| Age Bracket | With Coverage | Without Coverage |
| Under 6 Years | 69 (100.0%) | 0 (0.0%) |
| 6 to 18 Years | 70 (100.0%) | 0 (0.0%) |
| 19 to 25 Years | 19 (26.0%) | 54 (74.0%) |
| 26 to 34 Years | 30 (61.2%) | 19 (38.8%) |
| 35 to 44 Years | 57 (95.0%) | 3 (5.0%) |
| 45 to 54 Years | 75 (48.4%) | 80 (51.6%) |
| 55 to 64 Years | 50 (90.9%) | 5 (9.1%) |
| 65 to 74 Years | 157 (100.0%) | 0 (0.0%) |
| 75 Years and older | 54 (100.0%) | 0 (0.0%) |
| Total | 581 (78.3%) | 161 (21.7%) |
Health Insurance Coverage by Citizenship Status in Rule
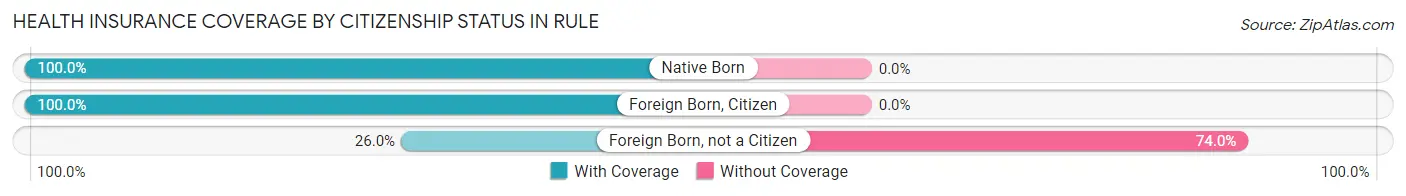
| Citizenship Status | With Coverage | Without Coverage |
| Native Born | 69 (100.0%) | 0 (0.0%) |
| Foreign Born, Citizen | 70 (100.0%) | 0 (0.0%) |
| Foreign Born, not a Citizen | 19 (26.0%) | 54 (74.0%) |
Health Insurance Coverage by Household Income in Rule
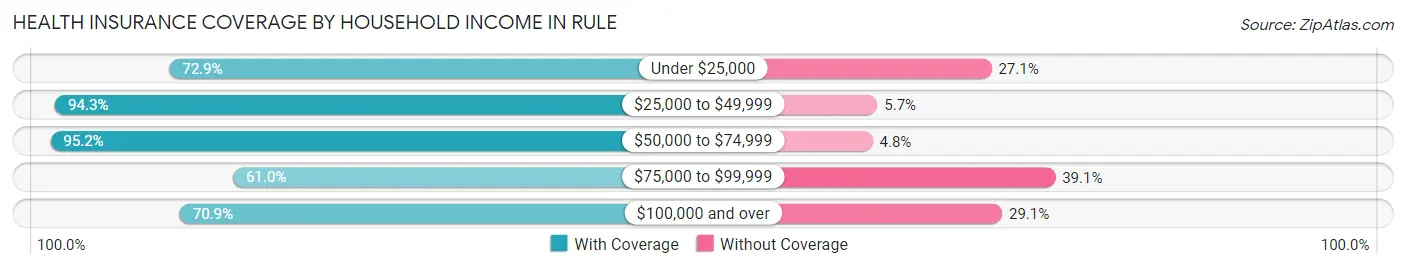
| Household Income | With Coverage | Without Coverage |
| Under $25,000 | 199 (72.9%) | 74 (27.1%) |
| $25,000 to $49,999 | 181 (94.3%) | 11 (5.7%) |
| $50,000 to $74,999 | 59 (95.2%) | 3 (4.8%) |
| $75,000 to $99,999 | 64 (61.0%) | 41 (39.1%) |
| $100,000 and over | 78 (70.9%) | 32 (29.1%) |
Public vs Private Health Insurance Coverage by Age in Rule
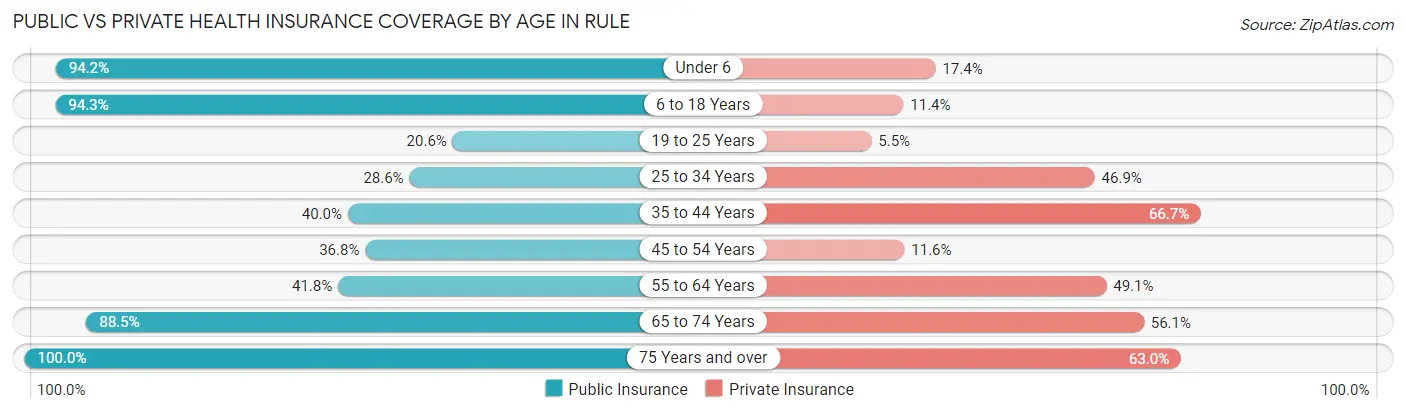
| Age Bracket | Public Insurance | Private Insurance |
| Under 6 | 65 (94.2%) | 12 (17.4%) |
| 6 to 18 Years | 66 (94.3%) | 8 (11.4%) |
| 19 to 25 Years | 15 (20.5%) | 4 (5.5%) |
| 25 to 34 Years | 14 (28.6%) | 23 (46.9%) |
| 35 to 44 Years | 24 (40.0%) | 40 (66.7%) |
| 45 to 54 Years | 57 (36.8%) | 18 (11.6%) |
| 55 to 64 Years | 23 (41.8%) | 27 (49.1%) |
| 65 to 74 Years | 139 (88.5%) | 88 (56.0%) |
| 75 Years and over | 54 (100.0%) | 34 (63.0%) |
| Total | 457 (61.6%) | 254 (34.2%) |
Disability Status by Sex by Age in Rule
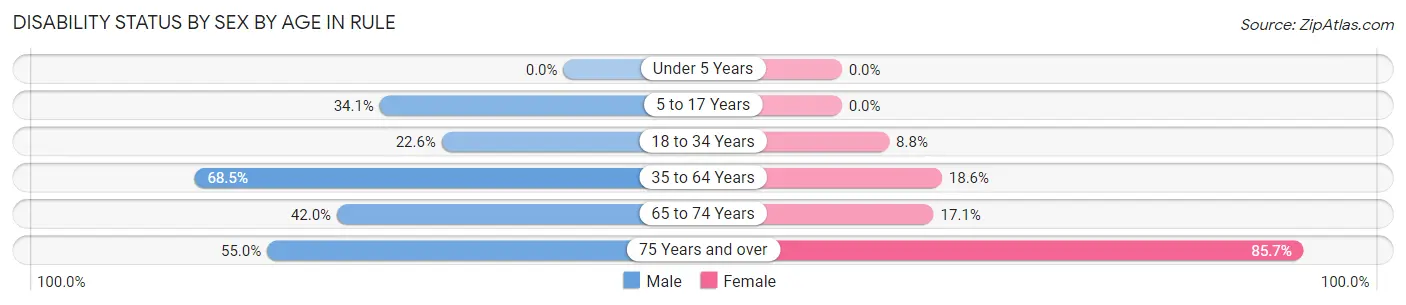
| Age Bracket | Male | Female |
| Under 5 Years | 0 (0.0%) | 0 (0.0%) |
| 5 to 17 Years | 15 (34.1%) | 0 (0.0%) |
| 18 to 34 Years | 7 (22.6%) | 8 (8.8%) |
| 35 to 64 Years | 89 (68.5%) | 26 (18.6%) |
| 65 to 74 Years | 29 (42.0%) | 15 (17.1%) |
| 75 Years and over | 22 (55.0%) | 12 (85.7%) |
Disability Class by Sex by Age in Rule
Disability Class: Hearing Difficulty
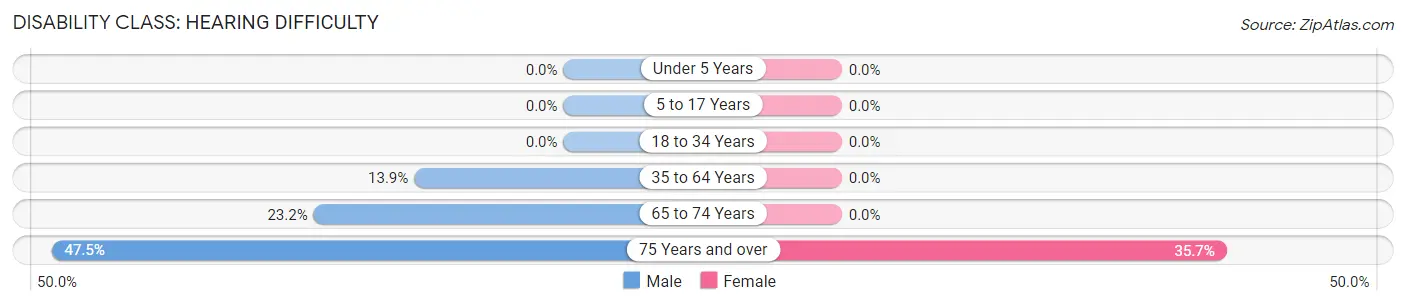
| Age Bracket | Male | Female |
| Under 5 Years | 0 (0.0%) | 0 (0.0%) |
| 5 to 17 Years | 0 (0.0%) | 0 (0.0%) |
| 18 to 34 Years | 0 (0.0%) | 0 (0.0%) |
| 35 to 64 Years | 18 (13.9%) | 0 (0.0%) |
| 65 to 74 Years | 16 (23.2%) | 0 (0.0%) |
| 75 Years and over | 19 (47.5%) | 5 (35.7%) |
Disability Class: Vision Difficulty
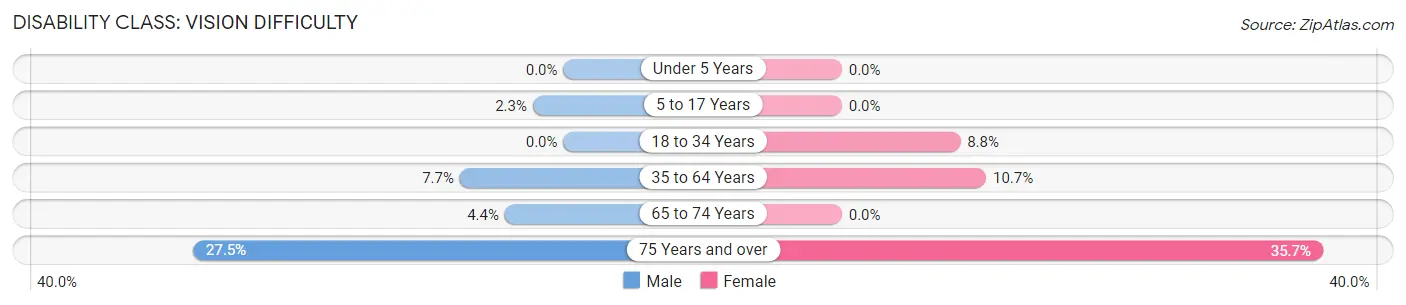
| Age Bracket | Male | Female |
| Under 5 Years | 0 (0.0%) | 0 (0.0%) |
| 5 to 17 Years | 1 (2.3%) | 0 (0.0%) |
| 18 to 34 Years | 0 (0.0%) | 8 (8.8%) |
| 35 to 64 Years | 10 (7.7%) | 15 (10.7%) |
| 65 to 74 Years | 3 (4.3%) | 0 (0.0%) |
| 75 Years and over | 11 (27.5%) | 5 (35.7%) |
Disability Class: Cognitive Difficulty
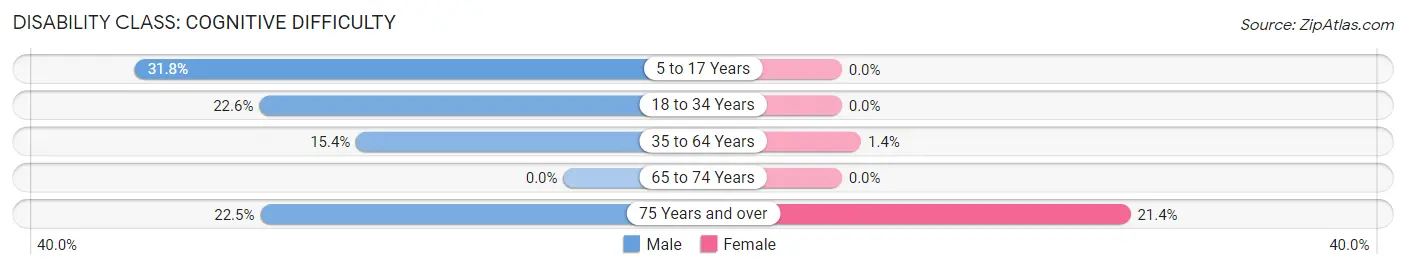
| Age Bracket | Male | Female |
| 5 to 17 Years | 14 (31.8%) | 0 (0.0%) |
| 18 to 34 Years | 7 (22.6%) | 0 (0.0%) |
| 35 to 64 Years | 20 (15.4%) | 2 (1.4%) |
| 65 to 74 Years | 0 (0.0%) | 0 (0.0%) |
| 75 Years and over | 9 (22.5%) | 3 (21.4%) |
Disability Class: Ambulatory Difficulty
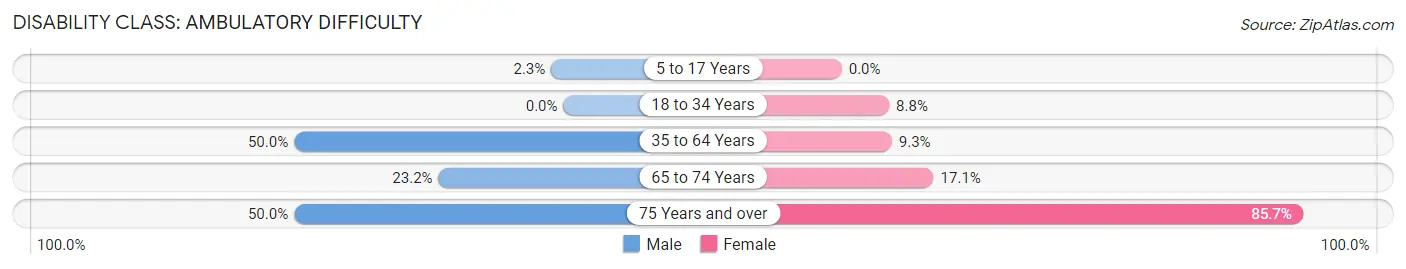
| Age Bracket | Male | Female |
| 5 to 17 Years | 1 (2.3%) | 0 (0.0%) |
| 18 to 34 Years | 0 (0.0%) | 8 (8.8%) |
| 35 to 64 Years | 65 (50.0%) | 13 (9.3%) |
| 65 to 74 Years | 16 (23.2%) | 15 (17.1%) |
| 75 Years and over | 20 (50.0%) | 12 (85.7%) |
Disability Class: Self-Care Difficulty
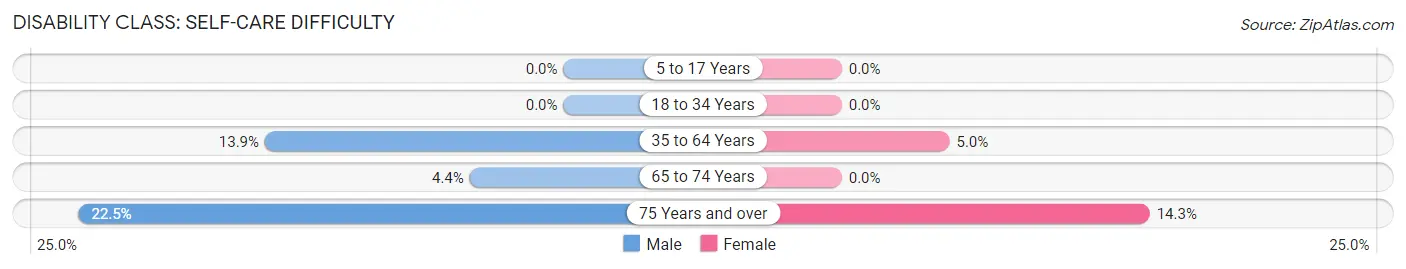
| Age Bracket | Male | Female |
| 5 to 17 Years | 0 (0.0%) | 0 (0.0%) |
| 18 to 34 Years | 0 (0.0%) | 0 (0.0%) |
| 35 to 64 Years | 18 (13.9%) | 7 (5.0%) |
| 65 to 74 Years | 3 (4.3%) | 0 (0.0%) |
| 75 Years and over | 9 (22.5%) | 2 (14.3%) |
Technology Access in Rule
Computing Device Access in Rule
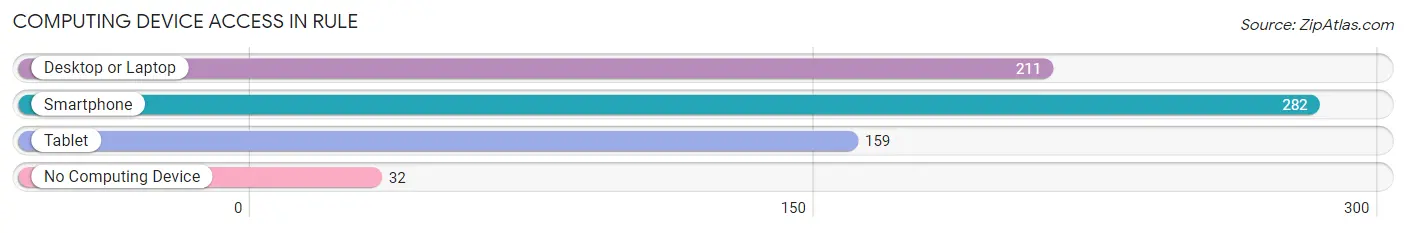
| Device Type | # Households | % Households |
| Desktop or Laptop | 211 | 64.1% |
| Smartphone | 282 | 85.7% |
| Tablet | 159 | 48.3% |
| No Computing Device | 32 | 9.7% |
| Total | 329 | 100.0% |
Internet Access in Rule
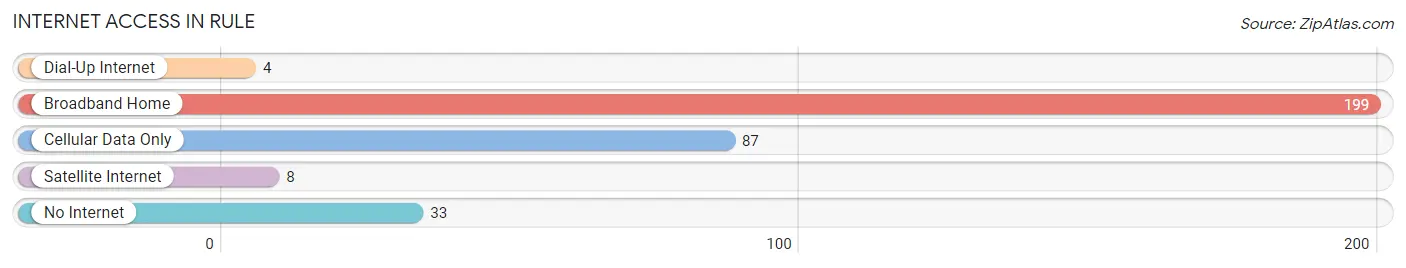
| Internet Type | # Households | % Households |
| Dial-Up Internet | 4 | 1.2% |
| Broadband Home | 199 | 60.5% |
| Cellular Data Only | 87 | 26.4% |
| Satellite Internet | 8 | 2.4% |
| No Internet | 33 | 10.0% |
| Total | 329 | 100.0% |
Rule Summary
Texas is a state located in the south-central region of the United States. It is the second largest state in the country, both in terms of population and land area. Texas has a rich and diverse history, geography, economy, and demographics.
History
The history of Texas dates back to the 16th century when Spanish explorers first arrived in the region. The area was then claimed by Mexico in 1821, and Texas declared its independence in 1836. After a brief period of independence, Texas was annexed by the United States in 1845. During the Civil War, Texas seceded from the Union and joined the Confederate States of America. After the war, Texas was readmitted to the Union in 1870.
Throughout the 19th and 20th centuries, Texas experienced rapid population growth and economic development. The state was a major producer of oil and gas, and the discovery of oil in the early 20th century helped to fuel the state’s economy. In the late 20th century, Texas became a major center for technology and aerospace industries.
Geography
Texas is located in the south-central region of the United States. It is bordered by Oklahoma to the north, Arkansas and Louisiana to the east, and Mexico to the south. The state has a total area of 268,820 square miles, making it the second largest state in the country.
Texas is divided into four distinct geographic regions: the Gulf Coastal Plains, the Great Plains, the Edwards Plateau, and the Basin and Range Province. The Gulf Coastal Plains are located along the Gulf of Mexico and are characterized by flat terrain and sandy beaches. The Great Plains are located in the northern part of the state and are characterized by rolling hills and grasslands. The Edwards Plateau is located in the central part of the state and is characterized by limestone hills and canyons. The Basin and Range Province is located in the western part of the state and is characterized by mountains and desert.
Economy
The economy of Texas is one of the largest and most diverse in the United States. The state is a major producer of oil and gas, and the discovery of oil in the early 20th century helped to fuel the state’s economy. In addition to oil and gas, Texas is also a major producer of agricultural products, including cotton, cattle, and wheat.
The state is also a major center for technology and aerospace industries. Texas is home to several major technology companies, including Dell, Texas Instruments, and Samsung. The state is also home to several major aerospace companies, including Lockheed Martin and Boeing.
Demographics
As of 2020, the population of Texas was estimated to be 29.1 million. The state is one of the most populous in the country, and it is the second most populous state in the United States.
The majority of the population of Texas is of European descent, with the largest ethnic group being German. Other major ethnic groups include Mexican, African American, and Native American. The state is also home to a large Hispanic population, with nearly 40% of the population identifying as Hispanic or Latino.
Texas is also one of the most diverse states in the country. The state is home to a variety of religious groups, including Christianity, Judaism, Islam, and Hinduism. The state is also home to a variety of languages, including English, Spanish, and German.
Common Questions
What is Per Capita Income in Rule?
Per Capita income in Rule is $19,333.
What is the Median Family Income in Rule?
Median Family Income in Rule is $32,083.
What is the Median Household income in Rule?
Median Household Income in Rule is $26,797.
What is Income or Wage Gap in Rule?
Income or Wage Gap in Rule is 41.2%.
Women in Rule earn 58.8 cents for every dollar earned by a man.
What is Family Income Deficit in Rule?
Family Income Deficit in Rule is $10,536.
Families that are below poverty line in Rule earn $10,536 less on average than the poverty threshold level.
What is Inequality or Gini Index in Rule?
Inequality or Gini Index in Rule is 0.44.
What is the Total Population of Rule?
Total Population of Rule is 742.
What is the Total Male Population of Rule?
Total Male Population of Rule is 355.
What is the Total Female Population of Rule?
Total Female Population of Rule is 387.
What is the Ratio of Males per 100 Females in Rule?
There are 91.73 Males per 100 Females in Rule.
What is the Ratio of Females per 100 Males in Rule?
There are 109.01 Females per 100 Males in Rule.
What is the Median Population Age in Rule?
Median Population Age in Rule is 45.5 Years.
What is the Average Family Size in Rule
Average Family Size in Rule is 3.0 People.
What is the Average Household Size in Rule
Average Household Size in Rule is 2.3 People.
How Large is the Labor Force in Rule?
There are 261 People in the Labor Forcein in Rule.
What is the Percentage of People in the Labor Force in Rule?
42.9% of People are in the Labor Force in Rule.
What is the Unemployment Rate in Rule?
Unemployment Rate in Rule is 2.3%.