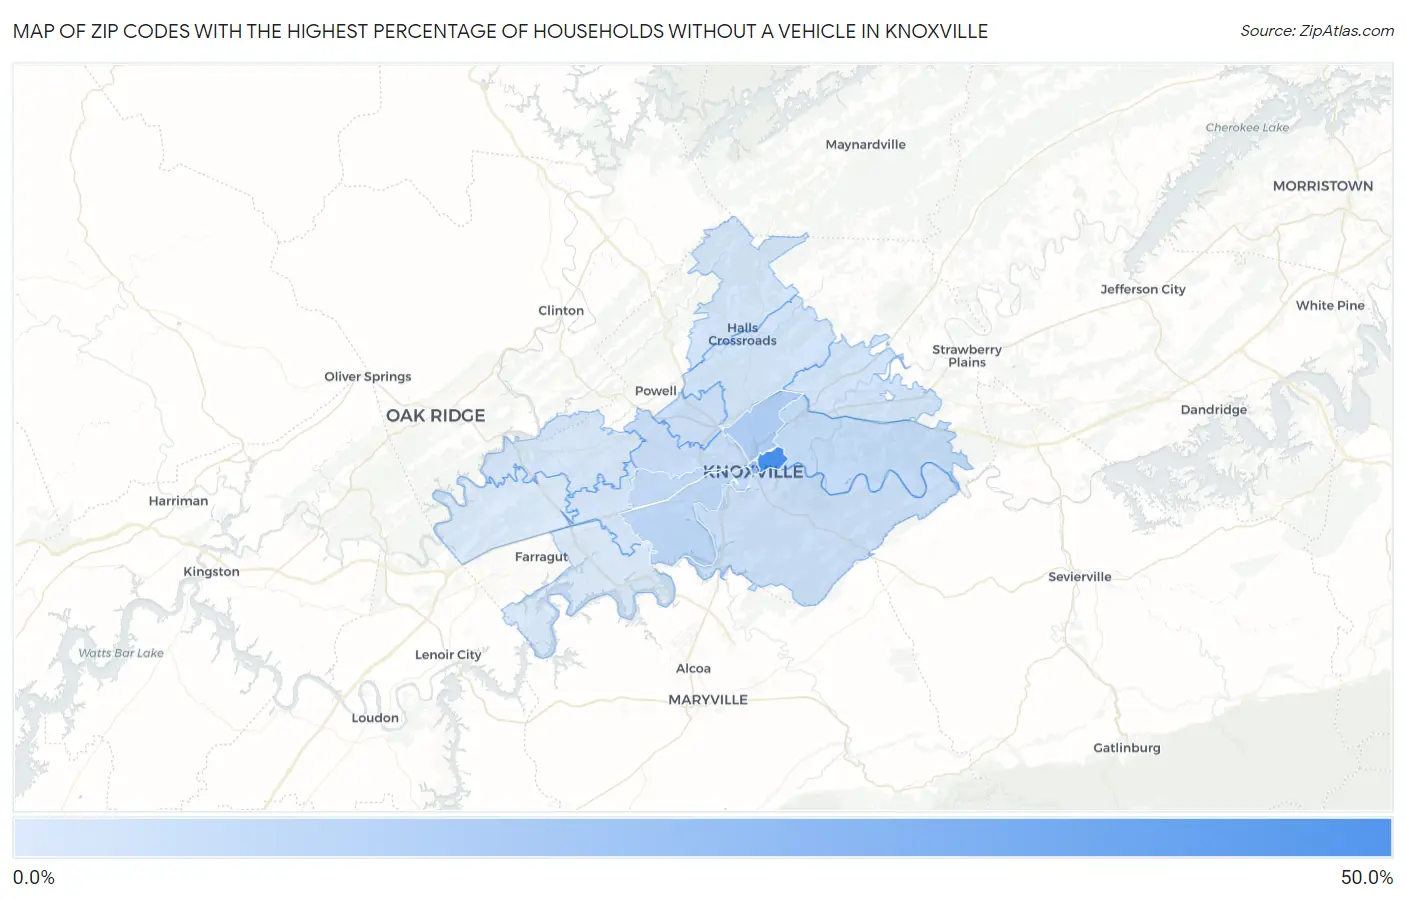
Zip Codes with the Highest Percentage of Households Without a Vehicle in Knoxville, TN
RELATED REPORTS & OPTIONS
Households without a Cars
Knoxville
Compare Zip Codes
Map of Zip Codes with the Highest Percentage of Households Without a Vehicle in Knoxville
1.8%
40.6%

Zip Codes with the Highest Percentage of Households Without a Vehicle in Knoxville, TN
| Zip Code | Housholds Without a Car | vs State | vs National | |
| 1. | 37915 | 40.6% | 5.3%(+35.3)#3 | 8.3%(+32.3)#500 |
| 2. | 37902 | 20.1% | 5.3%(+14.8)#12 | 8.3%(+11.8)#1,495 |
| 3. | 37917 | 12.7% | 5.3%(+7.40)#45 | 8.3%(+4.40)#3,223 |
| 4. | 37919 | 8.6% | 5.3%(+3.30)#90 | 8.3%(+0.300)#6,178 |
| 5. | 37916 | 8.4% | 5.3%(+3.10)#96 | 8.3%(+0.100)#6,448 |
| 6. | 37909 | 7.5% | 5.3%(+2.20)#126 | 8.3%(-0.800)#7,724 |
| 7. | 37914 | 7.1% | 5.3%(+1.80)#141 | 8.3%(-1.20)#8,397 |
| 8. | 37921 | 5.9% | 5.3%(+0.600)#187 | 8.3%(-2.40)#10,684 |
| 9. | 37912 | 5.5% | 5.3%(+0.200)#202 | 8.3%(-2.80)#11,643 |
| 10. | 37920 | 5.2% | 5.3%(-0.100)#220 | 8.3%(-3.10)#12,322 |
| 11. | 37924 | 4.0% | 5.3%(-1.30)#297 | 8.3%(-4.30)#15,765 |
| 12. | 37918 | 3.9% | 5.3%(-1.40)#305 | 8.3%(-4.40)#15,983 |
| 13. | 37923 | 3.1% | 5.3%(-2.20)#360 | 8.3%(-5.20)#18,723 |
| 14. | 37938 | 3.1% | 5.3%(-2.20)#361 | 8.3%(-5.20)#18,771 |
| 15. | 37931 | 3.0% | 5.3%(-2.30)#367 | 8.3%(-5.30)#19,067 |
| 16. | 37922 | 1.9% | 5.3%(-3.40)#454 | 8.3%(-6.40)#22,759 |
| 17. | 37932 | 1.8% | 5.3%(-3.50)#463 | 8.3%(-6.50)#23,143 |
1
Common Questions
What are the Top 10 Zip Codes with the Highest Percentage of Households Without a Vehicle in Knoxville, TN?
Top 10 Zip Codes with the Highest Percentage of Households Without a Vehicle in Knoxville, TN are:
What zip code has the Highest Percentage of Households Without a Vehicle in Knoxville, TN?
37915 has the Highest Percentage of Households Without a Vehicle in Knoxville, TN with 40.6%.
What is the Percentage of Households Without a Vehicle in Knoxville, TN?
Percentage of Households Without a Vehicle in Knoxville is 9.7%.
What is the Percentage of Households Without a Vehicle in Tennessee?
Percentage of Households Without a Vehicle in Tennessee is 5.3%.
What is the Percentage of Households Without a Vehicle in the United States?
Percentage of Households Without a Vehicle in the United States is 8.3%.