Puerto Rican No Vehicles in Household
COMPARE
Puerto Rican
Select to Compare
No Vehicles in Household
Puerto Rican No Vehicles in Household
15.5%
NO VEHICLES AVAILABLE
0.0/ 100
METRIC RATING
309th/ 347
METRIC RANK
Puerto Rican No Vehicles in Household Correlation Chart
The statistical analysis conducted on geographies consisting of 525,427,776 people shows no correlation between the proportion of Puerto Ricans and percentage of households with no vehicle available in the United States with a correlation coefficient (R) of 0.001 and weighted average of 15.5%. On average, for every 1% (one percent) increase in Puerto Ricans within a typical geography, there is an increase of 0.00031% in percentage of households with no vehicle available.
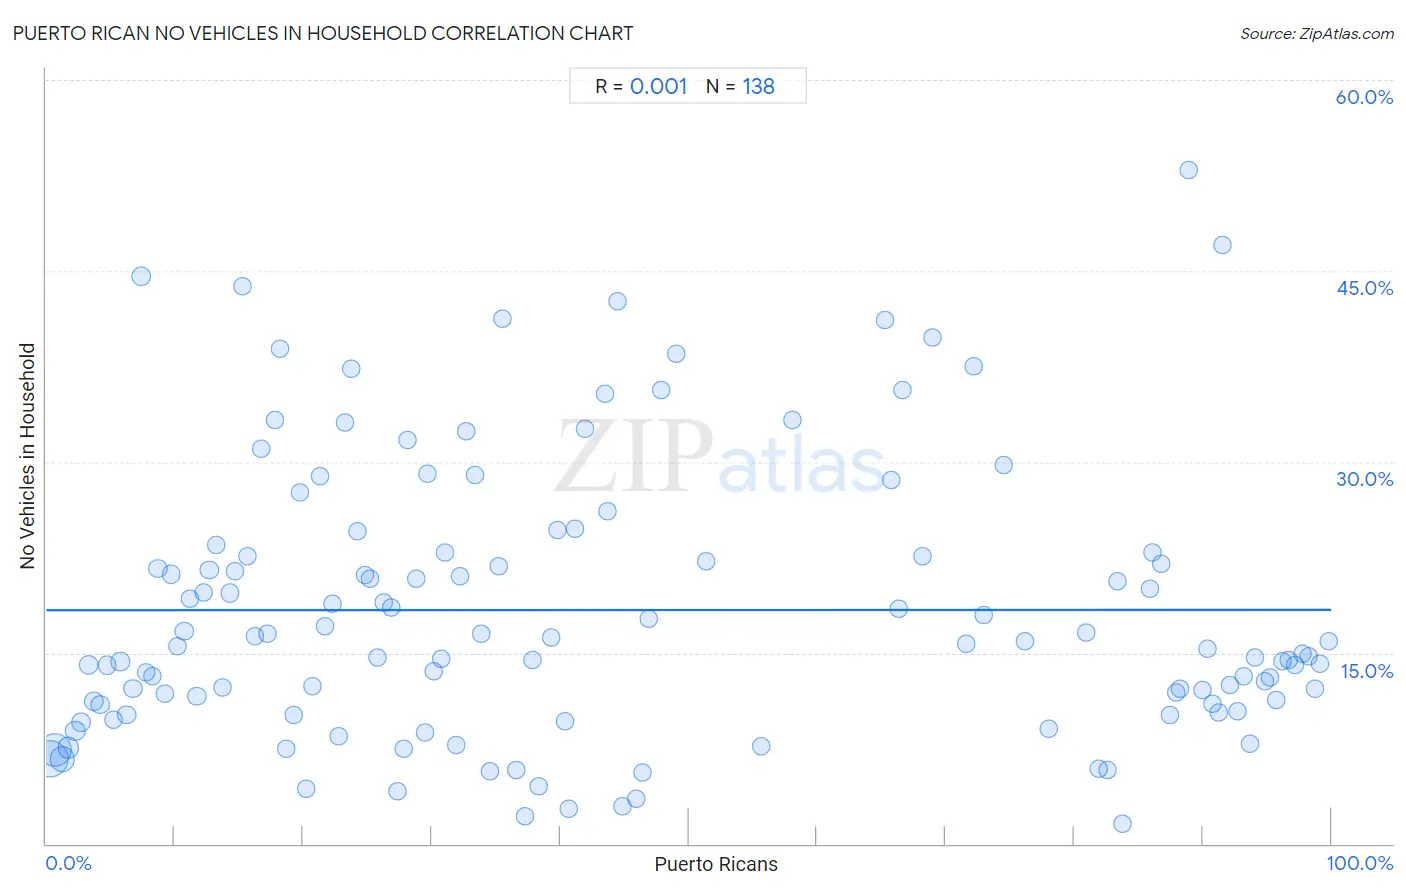
It is essential to understand that the correlation between the percentage of Puerto Ricans and percentage of households with no vehicle available does not imply a direct cause-and-effect relationship. It remains uncertain whether the presence of Puerto Ricans influences an upward or downward trend in the level of percentage of households with no vehicle available within an area, or if Puerto Ricans simply ended up residing in those areas with higher or lower levels of percentage of households with no vehicle available due to other factors.
Demographics Similar to Puerto Ricans by No Vehicles in Household
In terms of no vehicles in household, the demographic groups most similar to Puerto Ricans are Cape Verdean (15.6%, a difference of 0.56%), Immigrants from Israel (15.6%, a difference of 0.57%), U.S. Virgin Islander (15.4%, a difference of 0.65%), Immigrants from Haiti (15.4%, a difference of 0.69%), and Alaskan Athabascan (15.6%, a difference of 0.72%).
| Demographics | Rating | Rank | No Vehicles in Household |
| Haitians | 0.0 /100 | #302 | Tragic 14.9% |
| Immigrants from Western Africa | 0.0 /100 | #303 | Tragic 15.0% |
| Immigrants from Russia | 0.0 /100 | #304 | Tragic 15.1% |
| Immigrants from China | 0.0 /100 | #305 | Tragic 15.2% |
| Immigrants from Belize | 0.0 /100 | #306 | Tragic 15.4% |
| Immigrants from Haiti | 0.0 /100 | #307 | Tragic 15.4% |
| U.S. Virgin Islanders | 0.0 /100 | #308 | Tragic 15.4% |
| Puerto Ricans | 0.0 /100 | #309 | Tragic 15.5% |
| Cape Verdeans | 0.0 /100 | #310 | Tragic 15.6% |
| Immigrants from Israel | 0.0 /100 | #311 | Tragic 15.6% |
| Alaskan Athabascans | 0.0 /100 | #312 | Tragic 15.6% |
| Tohono O'odham | 0.0 /100 | #313 | Tragic 15.6% |
| Albanians | 0.0 /100 | #314 | Tragic 15.6% |
| Cypriots | 0.0 /100 | #315 | Tragic 15.7% |
| Ghanaians | 0.0 /100 | #316 | Tragic 16.4% |
Puerto Rican No Vehicles in Household Correlation Summary
| Measurement | Puerto Rican Data | No Vehicles in Household Data |
| Minimum | 0.28% | 1.5% |
| Maximum | 99.8% | 53.0% |
| Range | 99.5% | 51.4% |
| Mean | 44.1% | 18.4% |
| Median | 34.9% | 15.6% |
| Interquartile 25% (IQ1) | 17.3% | 10.9% |
| Interquartile 75% (IQ3) | 76.2% | 22.8% |
| Interquartile Range (IQR) | 58.9% | 11.9% |
| Standard Deviation (Sample) | 32.0% | 10.8% |
| Standard Deviation (Population) | 31.9% | 10.8% |
Correlation Details
| Puerto Rican Percentile | Sample Size | No Vehicles in Household |
[ 0.0% - 0.5% ] 0.28% | 168,447,020 | 6.6% |
[ 0.5% - 1.0% ] 0.72% | 136,173,646 | 7.4% |
[ 1.0% - 1.5% ] 1.22% | 60,501,116 | 6.6% |
[ 1.5% - 2.0% ] 1.73% | 30,048,977 | 7.5% |
[ 2.0% - 2.5% ] 2.23% | 17,709,186 | 8.9% |
[ 2.5% - 3.0% ] 2.74% | 14,042,073 | 9.6% |
[ 3.0% - 3.5% ] 3.30% | 12,867,648 | 14.0% |
[ 3.5% - 4.0% ] 3.72% | 10,064,335 | 11.2% |
[ 4.0% - 4.5% ] 4.23% | 7,259,439 | 10.9% |
[ 4.5% - 5.0% ] 4.75% | 6,927,173 | 14.1% |
[ 5.0% - 5.5% ] 5.22% | 4,664,166 | 9.8% |
[ 5.5% - 6.0% ] 5.75% | 4,745,961 | 14.3% |
[ 6.0% - 6.5% ] 6.26% | 3,486,468 | 10.2% |
[ 6.5% - 7.0% ] 6.76% | 3,429,264 | 12.2% |
[ 7.0% - 7.5% ] 7.43% | 11,167,889 | 44.6% |
[ 7.5% - 8.0% ] 7.78% | 2,239,308 | 13.4% |
[ 8.0% - 8.5% ] 8.25% | 2,083,420 | 13.2% |
[ 8.5% - 9.0% ] 8.68% | 3,951,429 | 21.6% |
[ 9.0% - 9.5% ] 9.25% | 2,110,376 | 11.8% |
[ 9.5% - 10.0% ] 9.71% | 1,967,603 | 21.2% |
[ 10.0% - 10.5% ] 10.24% | 853,930 | 15.5% |
[ 10.5% - 11.0% ] 10.75% | 1,509,303 | 16.7% |
[ 11.0% - 11.5% ] 11.21% | 870,143 | 19.3% |
[ 11.5% - 12.0% ] 11.72% | 807,207 | 11.5% |
[ 12.0% - 12.5% ] 12.21% | 631,186 | 19.8% |
[ 12.5% - 13.0% ] 12.69% | 759,288 | 21.5% |
[ 13.0% - 13.5% ] 13.21% | 578,995 | 23.4% |
[ 13.5% - 14.0% ] 13.68% | 434,646 | 12.2% |
[ 14.0% - 14.5% ] 14.31% | 779,606 | 19.7% |
[ 14.5% - 15.0% ] 14.70% | 822,580 | 21.4% |
[ 15.0% - 15.5% ] 15.31% | 148,142 | 43.8% |
[ 15.5% - 16.0% ] 15.70% | 877,189 | 22.6% |
[ 16.0% - 16.5% ] 16.25% | 429,039 | 16.3% |
[ 16.5% - 17.0% ] 16.77% | 527,094 | 31.0% |
[ 17.0% - 17.5% ] 17.25% | 241,785 | 16.5% |
[ 17.5% - 18.0% ] 17.82% | 305,601 | 33.3% |
[ 18.0% - 18.5% ] 18.16% | 368,623 | 38.9% |
[ 18.5% - 19.0% ] 18.64% | 189,205 | 7.5% |
[ 19.0% - 19.5% ] 19.26% | 192,381 | 10.1% |
[ 19.5% - 20.0% ] 19.76% | 218,922 | 27.6% |
[ 20.0% - 20.5% ] 20.23% | 91,182 | 4.3% |
[ 20.5% - 21.0% ] 20.69% | 355,124 | 12.4% |
[ 21.0% - 21.5% ] 21.28% | 322,377 | 28.8% |
[ 21.5% - 22.0% ] 21.70% | 147,601 | 17.1% |
[ 22.0% - 22.5% ] 22.25% | 72,418 | 18.9% |
[ 22.5% - 23.0% ] 22.78% | 156,354 | 8.4% |
[ 23.0% - 23.5% ] 23.26% | 259,518 | 33.1% |
[ 23.5% - 24.0% ] 23.76% | 53,772 | 37.3% |
[ 24.0% - 24.5% ] 24.21% | 192,848 | 24.6% |
[ 24.5% - 25.0% ] 24.78% | 41,372 | 21.1% |
[ 25.0% - 25.5% ] 25.17% | 74,666 | 20.8% |
[ 25.5% - 26.0% ] 25.78% | 294,946 | 14.7% |
[ 26.0% - 26.5% ] 26.24% | 113,185 | 18.9% |
[ 26.5% - 27.0% ] 26.82% | 211,727 | 18.5% |
[ 27.0% - 27.5% ] 27.29% | 115,892 | 4.2% |
[ 27.5% - 28.0% ] 27.85% | 84,009 | 7.4% |
[ 28.0% - 28.5% ] 28.10% | 207,807 | 31.8% |
[ 28.5% - 29.0% ] 28.75% | 138,085 | 20.8% |
[ 29.0% - 29.5% ] 29.43% | 90,149 | 8.7% |
[ 29.5% - 30.0% ] 29.70% | 120,128 | 29.1% |
[ 30.0% - 30.5% ] 30.13% | 50,636 | 13.6% |
[ 30.5% - 31.0% ] 30.79% | 28,965 | 14.5% |
[ 31.0% - 31.5% ] 31.05% | 50,450 | 22.8% |
[ 31.5% - 32.0% ] 31.94% | 127,342 | 7.8% |
[ 32.0% - 32.5% ] 32.18% | 64,650 | 21.0% |
[ 32.5% - 33.0% ] 32.66% | 154,688 | 32.4% |
[ 33.0% - 33.5% ] 33.32% | 121,057 | 29.0% |
[ 33.5% - 34.0% ] 33.83% | 74,212 | 16.5% |
[ 34.5% - 35.0% ] 34.58% | 60,995 | 5.7% |
[ 35.0% - 35.5% ] 35.17% | 39,166 | 21.8% |
[ 35.5% - 36.0% ] 35.53% | 13,479 | 41.2% |
[ 36.5% - 37.0% ] 36.60% | 68,321 | 5.8% |
[ 37.0% - 37.5% ] 37.23% | 19,353 | 2.1% |
[ 37.5% - 38.0% ] 37.86% | 9,467 | 14.4% |
[ 38.0% - 38.5% ] 38.35% | 16,024 | 4.5% |
[ 39.0% - 39.5% ] 39.30% | 194,833 | 16.2% |
[ 39.5% - 40.0% ] 39.75% | 51,640 | 24.7% |
[ 40.0% - 40.5% ] 40.34% | 76,094 | 9.6% |
[ 40.5% - 41.0% ] 40.69% | 69,343 | 2.8% |
[ 41.0% - 41.5% ] 41.13% | 44,030 | 24.7% |
[ 41.5% - 42.0% ] 41.93% | 62,474 | 32.6% |
[ 43.0% - 43.5% ] 43.47% | 8,418 | 35.3% |
[ 43.5% - 44.0% ] 43.72% | 70,222 | 26.1% |
[ 44.0% - 44.5% ] 44.43% | 25,642 | 42.6% |
[ 44.5% - 45.0% ] 44.86% | 43,330 | 3.0% |
[ 45.5% - 46.0% ] 45.93% | 34,257 | 3.5% |
[ 46.0% - 46.5% ] 46.38% | 1,022 | 5.6% |
[ 46.5% - 47.0% ] 46.89% | 77,830 | 17.7% |
[ 47.5% - 48.0% ] 47.85% | 466 | 35.7% |
[ 48.5% - 49.0% ] 49.00% | 549 | 38.5% |
[ 51.0% - 51.5% ] 51.41% | 22,606 | 22.2% |
[ 55.5% - 56.0% ] 55.67% | 697 | 7.6% |
[ 58.0% - 58.5% ] 58.07% | 12,443 | 33.3% |
[ 65.0% - 65.5% ] 65.24% | 12,045 | 41.1% |
[ 65.5% - 66.0% ] 65.76% | 257 | 28.6% |
[ 66.0% - 66.5% ] 66.33% | 781 | 18.5% |
[ 66.5% - 67.0% ] 66.65% | 17,941 | 35.6% |
[ 68.0% - 68.5% ] 68.15% | 7,087 | 22.6% |
[ 68.5% - 69.0% ] 68.99% | 8,220 | 39.8% |
[ 71.5% - 72.0% ] 71.61% | 701 | 15.8% |
[ 72.0% - 72.5% ] 72.22% | 24,713 | 37.5% |
[ 72.5% - 73.0% ] 72.96% | 5,955 | 18.0% |
[ 74.5% - 75.0% ] 74.52% | 5,260 | 29.8% |
[ 76.0% - 76.5% ] 76.20% | 17,293 | 15.9% |
[ 77.5% - 78.0% ] 77.98% | 16,890 | 9.1% |
[ 80.5% - 81.0% ] 80.95% | 16,607 | 16.6% |
[ 81.5% - 82.0% ] 81.92% | 553 | 5.9% |
[ 82.5% - 83.0% ] 82.54% | 590 | 5.8% |
[ 83.0% - 83.5% ] 83.33% | 3,233 | 20.6% |
[ 83.5% - 84.0% ] 83.71% | 2,492 | 1.5% |
[ 85.5% - 86.0% ] 85.92% | 38,239 | 20.0% |
[ 86.0% - 86.5% ] 86.12% | 341,160 | 22.9% |
[ 86.5% - 87.0% ] 86.74% | 40,064 | 22.0% |
[ 87.0% - 87.5% ] 87.45% | 16,451 | 10.1% |
[ 87.5% - 88.0% ] 87.90% | 4,562 | 11.9% |
[ 88.0% - 88.5% ] 88.19% | 40,300 | 12.2% |
[ 88.5% - 89.0% ] 88.88% | 7,068 | 53.0% |
[ 89.5% - 90.0% ] 89.97% | 13,876 | 12.1% |
[ 90.0% - 90.5% ] 90.35% | 147,165 | 15.4% |
[ 90.5% - 91.0% ] 90.80% | 32,781 | 11.0% |
[ 91.0% - 91.5% ] 91.25% | 189,184 | 10.3% |
[ 91.5% - 92.0% ] 91.58% | 606 | 47.0% |
[ 92.0% - 92.5% ] 92.08% | 51,852 | 12.5% |
[ 92.5% - 93.0% ] 92.66% | 25,965 | 10.4% |
[ 93.0% - 93.5% ] 93.15% | 110,548 | 13.1% |
[ 93.5% - 94.0% ] 93.63% | 30,160 | 7.9% |
[ 94.0% - 94.5% ] 94.10% | 281,717 | 14.7% |
[ 94.5% - 95.0% ] 94.81% | 234,866 | 12.8% |
[ 95.0% - 95.5% ] 95.25% | 309,124 | 13.1% |
[ 95.5% - 96.0% ] 95.73% | 149,189 | 11.3% |
[ 96.0% - 96.5% ] 96.18% | 329,088 | 14.4% |
[ 96.5% - 97.0% ] 96.73% | 352,386 | 14.4% |
[ 97.0% - 97.5% ] 97.19% | 192,134 | 14.0% |
[ 97.5% - 98.0% ] 97.73% | 522,283 | 15.0% |
[ 98.0% - 98.5% ] 98.27% | 376,077 | 14.8% |
[ 98.5% - 99.0% ] 98.78% | 508,516 | 12.1% |
[ 99.0% - 99.5% ] 99.17% | 450,589 | 14.1% |
[ 99.5% - 100.0% ] 99.81% | 221,985 | 15.9% |