Puerto Rican vs Sudanese Wage/Income Gap
COMPARE
Puerto Rican
Sudanese
Wage/Income Gap
Wage/Income Gap Comparison
Puerto Ricans
Sudanese
18.7%
WAGE/INCOME GAP
100.0/ 100
METRIC RATING
7th/ 347
METRIC RANK
24.0%
WAGE/INCOME GAP
98.6/ 100
METRIC RATING
106th/ 347
METRIC RANK
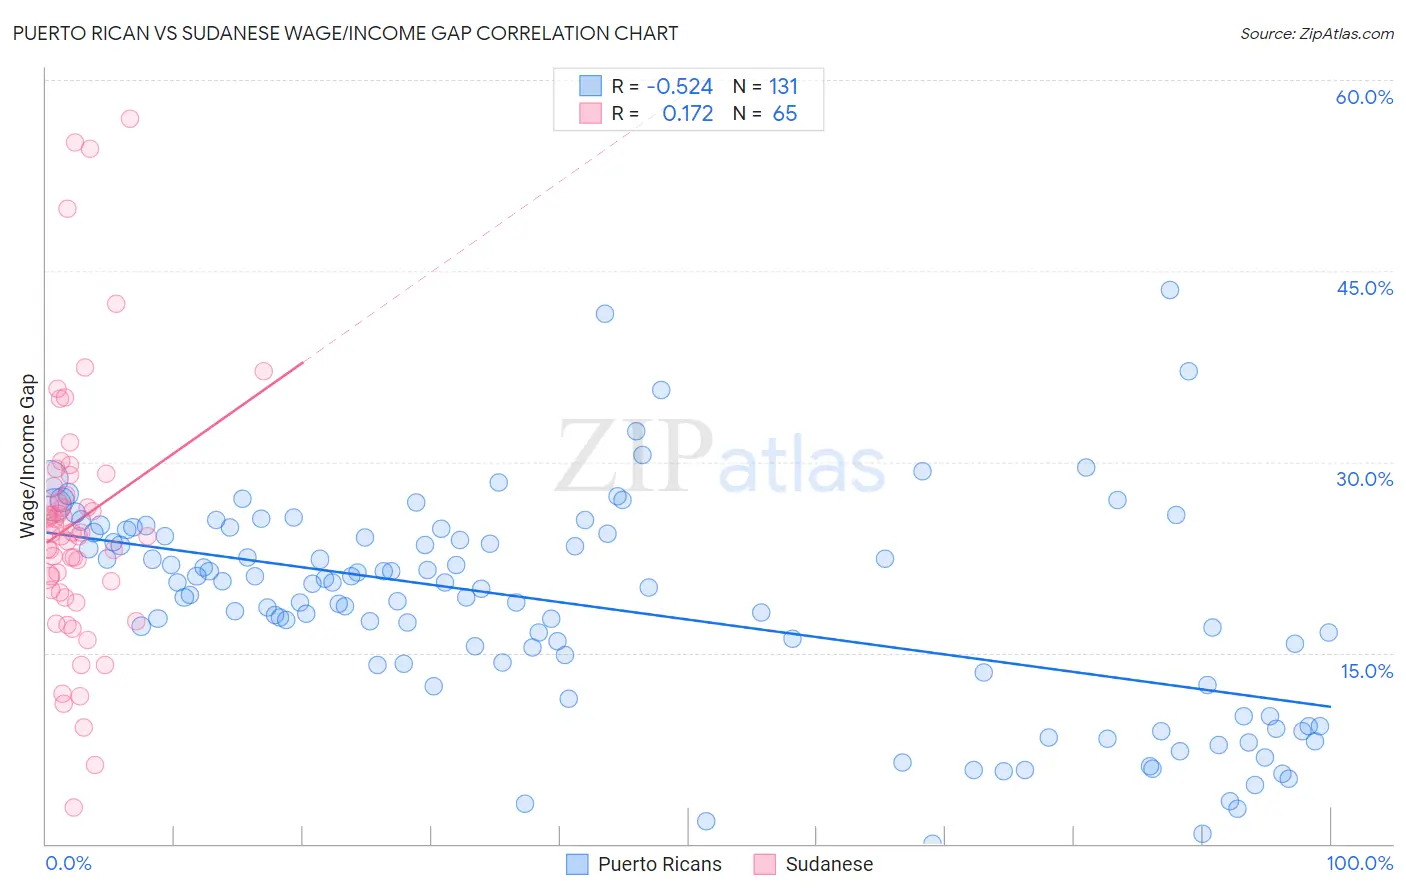
Puerto Rican vs Sudanese Wage/Income Gap Correlation Chart
The statistical analysis conducted on geographies consisting of 527,155,694 people shows a substantial negative correlation between the proportion of Puerto Ricans and wage/income gap percentage in the United States with a correlation coefficient (R) of -0.524 and weighted average of 18.7%. Similarly, the statistical analysis conducted on geographies consisting of 110,137,657 people shows a poor positive correlation between the proportion of Sudanese and wage/income gap percentage in the United States with a correlation coefficient (R) of 0.172 and weighted average of 24.0%, a difference of 28.1%.
Wage/Income Gap Correlation Summary
| Measurement | Puerto Rican | Sudanese |
| Minimum | 0.0036% | 2.9% |
| Maximum | 43.5% | 56.9% |
| Range | 43.5% | 54.1% |
| Mean | 18.6% | 25.2% |
| Median | 20.0% | 24.4% |
| Interquartile 25% (IQ1) | 13.4% | 19.8% |
| Interquartile 75% (IQ3) | 24.3% | 28.6% |
| Interquartile Range (IQR) | 10.9% | 8.8% |
| Standard Deviation (Sample) | 8.4% | 10.4% |
| Standard Deviation (Population) | 8.3% | 10.3% |
Similar Demographics by Wage/Income Gap
Demographics Similar to Puerto Ricans by Wage/Income Gap
In terms of wage/income gap, the demographic groups most similar to Puerto Ricans are Immigrants from Jamaica (18.8%, a difference of 0.63%), Barbadian (19.0%, a difference of 1.3%), Crow (19.1%, a difference of 1.8%), Immigrants from Guyana (18.4%, a difference of 2.0%), and Guyanese (18.3%, a difference of 2.3%).
| Demographics | Rating | Rank | Wage/Income Gap |
| Immigrants | Grenada | 100.0 /100 | #1 | Exceptional 16.2% |
| Immigrants | St. Vincent and the Grenadines | 100.0 /100 | #2 | Exceptional 16.4% |
| Immigrants | Barbados | 100.0 /100 | #3 | Exceptional 17.8% |
| British West Indians | 100.0 /100 | #4 | Exceptional 18.0% |
| Guyanese | 100.0 /100 | #5 | Exceptional 18.3% |
| Immigrants | Guyana | 100.0 /100 | #6 | Exceptional 18.4% |
| Puerto Ricans | 100.0 /100 | #7 | Exceptional 18.7% |
| Immigrants | Jamaica | 100.0 /100 | #8 | Exceptional 18.8% |
| Barbadians | 100.0 /100 | #9 | Exceptional 19.0% |
| Crow | 100.0 /100 | #10 | Exceptional 19.1% |
| Immigrants | Haiti | 100.0 /100 | #11 | Exceptional 19.2% |
| Immigrants | West Indies | 100.0 /100 | #12 | Exceptional 19.2% |
| Trinidadians and Tobagonians | 100.0 /100 | #13 | Exceptional 19.3% |
| Immigrants | Trinidad and Tobago | 100.0 /100 | #14 | Exceptional 19.3% |
| West Indians | 100.0 /100 | #15 | Exceptional 19.6% |
Demographics Similar to Sudanese by Wage/Income Gap
In terms of wage/income gap, the demographic groups most similar to Sudanese are Moroccan (24.0%, a difference of 0.0%), Tlingit-Haida (24.0%, a difference of 0.060%), Yaqui (24.0%, a difference of 0.30%), Immigrants from Albania (24.0%, a difference of 0.31%), and Ugandan (24.1%, a difference of 0.36%).
| Demographics | Rating | Rank | Wage/Income Gap |
| Aleuts | 99.2 /100 | #99 | Exceptional 23.7% |
| Yakama | 99.2 /100 | #100 | Exceptional 23.7% |
| Japanese | 99.1 /100 | #101 | Exceptional 23.8% |
| Immigrants | Laos | 99.0 /100 | #102 | Exceptional 23.8% |
| Tsimshian | 98.9 /100 | #103 | Exceptional 23.9% |
| Tlingit-Haida | 98.7 /100 | #104 | Exceptional 24.0% |
| Moroccans | 98.6 /100 | #105 | Exceptional 24.0% |
| Sudanese | 98.6 /100 | #106 | Exceptional 24.0% |
| Yaqui | 98.4 /100 | #107 | Exceptional 24.0% |
| Immigrants | Albania | 98.4 /100 | #108 | Exceptional 24.0% |
| Ugandans | 98.3 /100 | #109 | Exceptional 24.1% |
| Immigrants | Morocco | 98.1 /100 | #110 | Exceptional 24.1% |
| Soviet Union | 97.6 /100 | #111 | Exceptional 24.2% |
| Immigrants | Colombia | 97.0 /100 | #112 | Exceptional 24.3% |
| Sioux | 96.9 /100 | #113 | Exceptional 24.3% |