Puerto Rican vs Lebanese Wage/Income Gap
COMPARE
Puerto Rican
Lebanese
Wage/Income Gap
Wage/Income Gap Comparison
Puerto Ricans
Lebanese
18.7%
WAGE/INCOME GAP
100.0/ 100
METRIC RATING
7th/ 347
METRIC RANK
27.9%
WAGE/INCOME GAP
0.7/ 100
METRIC RATING
276th/ 347
METRIC RANK
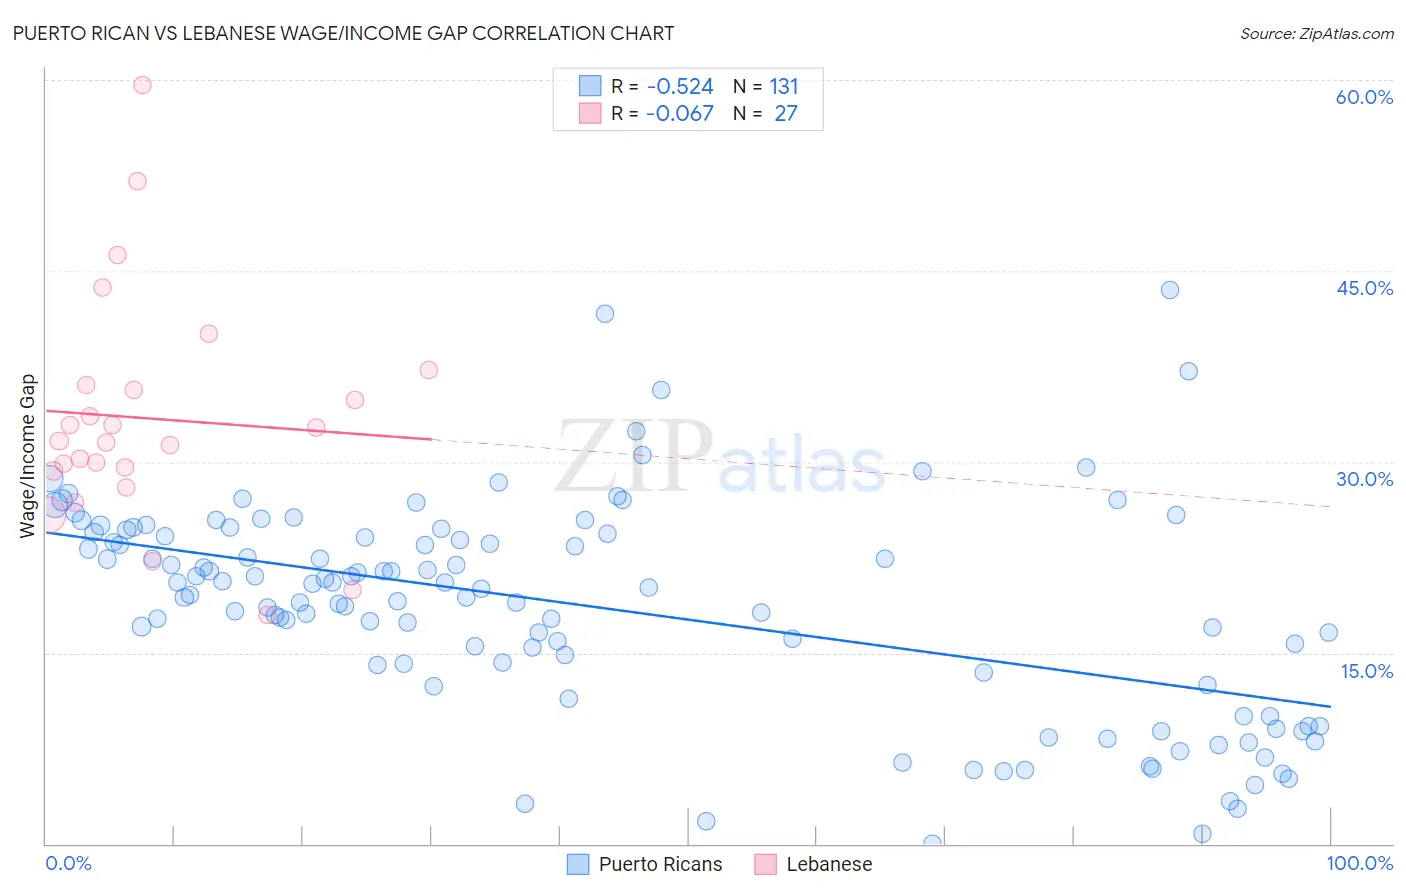
Puerto Rican vs Lebanese Wage/Income Gap Correlation Chart
The statistical analysis conducted on geographies consisting of 527,155,694 people shows a substantial negative correlation between the proportion of Puerto Ricans and wage/income gap percentage in the United States with a correlation coefficient (R) of -0.524 and weighted average of 18.7%. Similarly, the statistical analysis conducted on geographies consisting of 401,331,203 people shows a slight negative correlation between the proportion of Lebanese and wage/income gap percentage in the United States with a correlation coefficient (R) of -0.067 and weighted average of 27.9%, a difference of 48.9%.
Wage/Income Gap Correlation Summary
| Measurement | Puerto Rican | Lebanese |
| Minimum | 0.0036% | 18.0% |
| Maximum | 43.5% | 59.6% |
| Range | 43.5% | 41.7% |
| Mean | 18.6% | 33.4% |
| Median | 20.0% | 31.7% |
| Interquartile 25% (IQ1) | 13.4% | 29.3% |
| Interquartile 75% (IQ3) | 24.3% | 36.0% |
| Interquartile Range (IQR) | 10.9% | 6.7% |
| Standard Deviation (Sample) | 8.4% | 9.1% |
| Standard Deviation (Population) | 8.3% | 8.9% |
Similar Demographics by Wage/Income Gap
Demographics Similar to Puerto Ricans by Wage/Income Gap
In terms of wage/income gap, the demographic groups most similar to Puerto Ricans are Immigrants from Jamaica (18.8%, a difference of 0.63%), Barbadian (19.0%, a difference of 1.3%), Crow (19.1%, a difference of 1.8%), Immigrants from Guyana (18.4%, a difference of 2.0%), and Guyanese (18.3%, a difference of 2.3%).
| Demographics | Rating | Rank | Wage/Income Gap |
| Immigrants | Grenada | 100.0 /100 | #1 | Exceptional 16.2% |
| Immigrants | St. Vincent and the Grenadines | 100.0 /100 | #2 | Exceptional 16.4% |
| Immigrants | Barbados | 100.0 /100 | #3 | Exceptional 17.8% |
| British West Indians | 100.0 /100 | #4 | Exceptional 18.0% |
| Guyanese | 100.0 /100 | #5 | Exceptional 18.3% |
| Immigrants | Guyana | 100.0 /100 | #6 | Exceptional 18.4% |
| Puerto Ricans | 100.0 /100 | #7 | Exceptional 18.7% |
| Immigrants | Jamaica | 100.0 /100 | #8 | Exceptional 18.8% |
| Barbadians | 100.0 /100 | #9 | Exceptional 19.0% |
| Crow | 100.0 /100 | #10 | Exceptional 19.1% |
| Immigrants | Haiti | 100.0 /100 | #11 | Exceptional 19.2% |
| Immigrants | West Indies | 100.0 /100 | #12 | Exceptional 19.2% |
| Trinidadians and Tobagonians | 100.0 /100 | #13 | Exceptional 19.3% |
| Immigrants | Trinidad and Tobago | 100.0 /100 | #14 | Exceptional 19.3% |
| West Indians | 100.0 /100 | #15 | Exceptional 19.6% |
Demographics Similar to Lebanese by Wage/Income Gap
In terms of wage/income gap, the demographic groups most similar to Lebanese are Latvian (27.9%, a difference of 0.0%), Immigrants from Japan (27.9%, a difference of 0.030%), Immigrants from England (27.9%, a difference of 0.080%), American (27.8%, a difference of 0.11%), and Bulgarian (27.8%, a difference of 0.15%).
| Demographics | Rating | Rank | Wage/Income Gap |
| Potawatomi | 0.9 /100 | #269 | Tragic 27.7% |
| Immigrants | Western Europe | 0.9 /100 | #270 | Tragic 27.8% |
| Ute | 0.8 /100 | #271 | Tragic 27.8% |
| Immigrants | Korea | 0.8 /100 | #272 | Tragic 27.8% |
| Bulgarians | 0.7 /100 | #273 | Tragic 27.8% |
| Americans | 0.7 /100 | #274 | Tragic 27.8% |
| Immigrants | Japan | 0.7 /100 | #275 | Tragic 27.9% |
| Lebanese | 0.7 /100 | #276 | Tragic 27.9% |
| Latvians | 0.7 /100 | #277 | Tragic 27.9% |
| Immigrants | England | 0.6 /100 | #278 | Tragic 27.9% |
| Romanians | 0.5 /100 | #279 | Tragic 28.0% |
| Russians | 0.5 /100 | #280 | Tragic 28.0% |
| Burmese | 0.5 /100 | #281 | Tragic 28.0% |
| South Africans | 0.5 /100 | #282 | Tragic 28.0% |
| French Canadians | 0.4 /100 | #283 | Tragic 28.1% |