Puerto Rican vs Immigrants from Taiwan Wage/Income Gap
COMPARE
Puerto Rican
Immigrants from Taiwan
Wage/Income Gap
Wage/Income Gap Comparison
Puerto Ricans
Immigrants from Taiwan
18.7%
WAGE/INCOME GAP
100.0/ 100
METRIC RATING
7th/ 347
METRIC RANK
29.5%
WAGE/INCOME GAP
0.0/ 100
METRIC RATING
335th/ 347
METRIC RANK
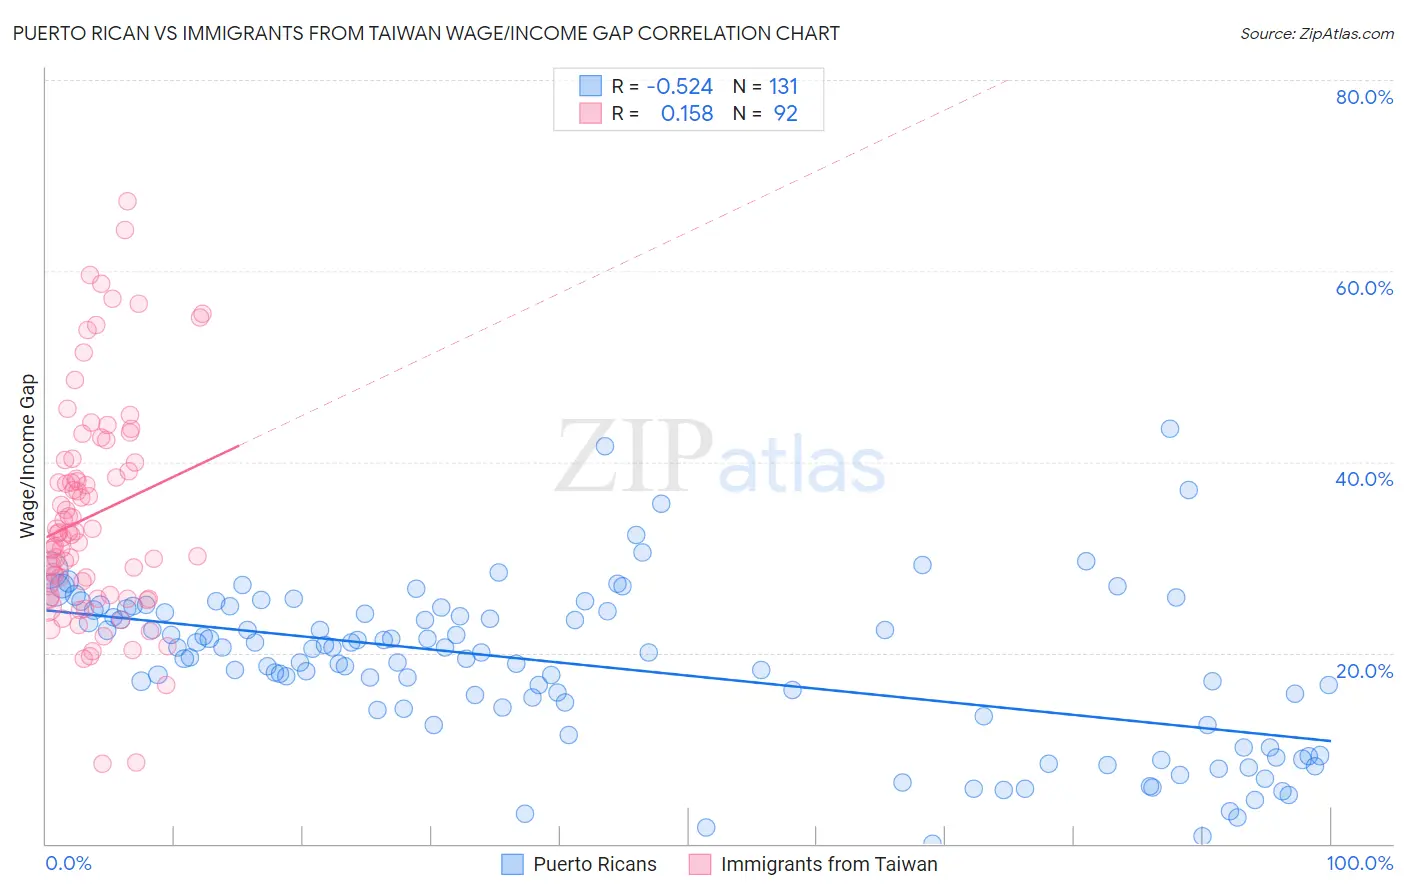
Puerto Rican vs Immigrants from Taiwan Wage/Income Gap Correlation Chart
The statistical analysis conducted on geographies consisting of 527,155,694 people shows a substantial negative correlation between the proportion of Puerto Ricans and wage/income gap percentage in the United States with a correlation coefficient (R) of -0.524 and weighted average of 18.7%. Similarly, the statistical analysis conducted on geographies consisting of 298,208,657 people shows a poor positive correlation between the proportion of Immigrants from Taiwan and wage/income gap percentage in the United States with a correlation coefficient (R) of 0.158 and weighted average of 29.5%, a difference of 57.4%.
Wage/Income Gap Correlation Summary
| Measurement | Puerto Rican | Immigrants from Taiwan |
| Minimum | 0.0036% | 8.4% |
| Maximum | 43.5% | 67.2% |
| Range | 43.5% | 58.8% |
| Mean | 18.6% | 34.4% |
| Median | 20.0% | 32.5% |
| Interquartile 25% (IQ1) | 13.4% | 26.0% |
| Interquartile 75% (IQ3) | 24.3% | 40.1% |
| Interquartile Range (IQR) | 10.9% | 14.1% |
| Standard Deviation (Sample) | 8.4% | 11.6% |
| Standard Deviation (Population) | 8.3% | 11.5% |
Similar Demographics by Wage/Income Gap
Demographics Similar to Puerto Ricans by Wage/Income Gap
In terms of wage/income gap, the demographic groups most similar to Puerto Ricans are Immigrants from Jamaica (18.8%, a difference of 0.63%), Barbadian (19.0%, a difference of 1.3%), Crow (19.1%, a difference of 1.8%), Immigrants from Guyana (18.4%, a difference of 2.0%), and Guyanese (18.3%, a difference of 2.3%).
| Demographics | Rating | Rank | Wage/Income Gap |
| Immigrants | Grenada | 100.0 /100 | #1 | Exceptional 16.2% |
| Immigrants | St. Vincent and the Grenadines | 100.0 /100 | #2 | Exceptional 16.4% |
| Immigrants | Barbados | 100.0 /100 | #3 | Exceptional 17.8% |
| British West Indians | 100.0 /100 | #4 | Exceptional 18.0% |
| Guyanese | 100.0 /100 | #5 | Exceptional 18.3% |
| Immigrants | Guyana | 100.0 /100 | #6 | Exceptional 18.4% |
| Puerto Ricans | 100.0 /100 | #7 | Exceptional 18.7% |
| Immigrants | Jamaica | 100.0 /100 | #8 | Exceptional 18.8% |
| Barbadians | 100.0 /100 | #9 | Exceptional 19.0% |
| Crow | 100.0 /100 | #10 | Exceptional 19.1% |
| Immigrants | Haiti | 100.0 /100 | #11 | Exceptional 19.2% |
| Immigrants | West Indies | 100.0 /100 | #12 | Exceptional 19.2% |
| Trinidadians and Tobagonians | 100.0 /100 | #13 | Exceptional 19.3% |
| Immigrants | Trinidad and Tobago | 100.0 /100 | #14 | Exceptional 19.3% |
| West Indians | 100.0 /100 | #15 | Exceptional 19.6% |
Demographics Similar to Immigrants from Taiwan by Wage/Income Gap
In terms of wage/income gap, the demographic groups most similar to Immigrants from Taiwan are English (29.5%, a difference of 0.010%), Swedish (29.4%, a difference of 0.13%), European (29.4%, a difference of 0.27%), Immigrants from South Central Asia (29.3%, a difference of 0.46%), and Dutch (29.6%, a difference of 0.59%).
| Demographics | Rating | Rank | Wage/Income Gap |
| Scandinavians | 0.0 /100 | #328 | Tragic 29.1% |
| Scottish | 0.0 /100 | #329 | Tragic 29.1% |
| Germans | 0.0 /100 | #330 | Tragic 29.2% |
| Czechs | 0.0 /100 | #331 | Tragic 29.2% |
| Immigrants | South Central Asia | 0.0 /100 | #332 | Tragic 29.3% |
| Europeans | 0.0 /100 | #333 | Tragic 29.4% |
| Swedes | 0.0 /100 | #334 | Tragic 29.4% |
| Immigrants | Taiwan | 0.0 /100 | #335 | Tragic 29.5% |
| English | 0.0 /100 | #336 | Tragic 29.5% |
| Dutch | 0.0 /100 | #337 | Tragic 29.6% |
| Filipinos | 0.0 /100 | #338 | Tragic 29.7% |
| Iranians | 0.0 /100 | #339 | Tragic 29.7% |
| Swiss | 0.0 /100 | #340 | Tragic 30.0% |
| Thais | 0.0 /100 | #341 | Tragic 30.5% |
| Pennsylvania Germans | 0.0 /100 | #342 | Tragic 30.7% |