Norwegian vs Immigrants from Bolivia Wage/Income Gap
COMPARE
Norwegian
Immigrants from Bolivia
Wage/Income Gap
Wage/Income Gap Comparison
Norwegians
Immigrants from Bolivia
29.0%
WAGE/INCOME GAP
0.1/ 100
METRIC RATING
323rd/ 347
METRIC RANK
26.0%
WAGE/INCOME GAP
36.4/ 100
METRIC RATING
181st/ 347
METRIC RANK
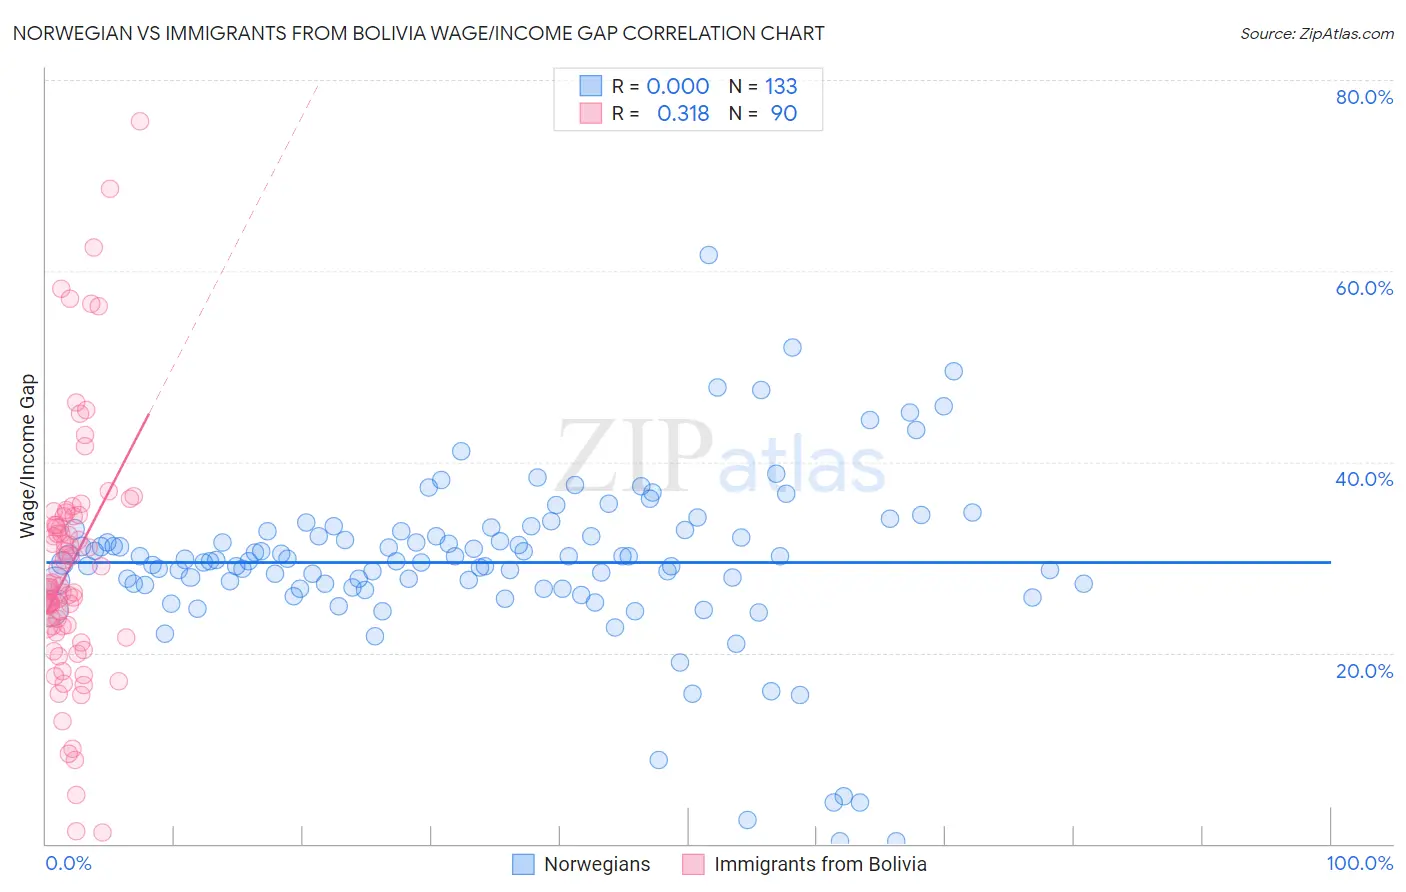
Norwegian vs Immigrants from Bolivia Wage/Income Gap Correlation Chart
The statistical analysis conducted on geographies consisting of 531,696,723 people shows no correlation between the proportion of Norwegians and wage/income gap percentage in the United States with a correlation coefficient (R) of 0.000 and weighted average of 29.0%. Similarly, the statistical analysis conducted on geographies consisting of 158,701,759 people shows a mild positive correlation between the proportion of Immigrants from Bolivia and wage/income gap percentage in the United States with a correlation coefficient (R) of 0.318 and weighted average of 26.0%, a difference of 11.3%.
Wage/Income Gap Correlation Summary
| Measurement | Norwegian | Immigrants from Bolivia |
| Minimum | 0.24% | 1.1% |
| Maximum | 61.7% | 75.7% |
| Range | 61.5% | 74.6% |
| Mean | 29.5% | 29.2% |
| Median | 29.7% | 26.9% |
| Interquartile 25% (IQ1) | 27.0% | 22.8% |
| Interquartile 75% (IQ3) | 32.7% | 34.2% |
| Interquartile Range (IQR) | 5.7% | 11.5% |
| Standard Deviation (Sample) | 9.0% | 13.1% |
| Standard Deviation (Population) | 8.9% | 13.1% |
Similar Demographics by Wage/Income Gap
Demographics Similar to Norwegians by Wage/Income Gap
In terms of wage/income gap, the demographic groups most similar to Norwegians are Immigrants from Singapore (28.9%, a difference of 0.11%), Croatian (29.0%, a difference of 0.12%), Welsh (28.9%, a difference of 0.13%), British (28.9%, a difference of 0.19%), and Slovak (28.9%, a difference of 0.25%).
| Demographics | Rating | Rank | Wage/Income Gap |
| Lithuanians | 0.1 /100 | #316 | Tragic 28.7% |
| Belgians | 0.1 /100 | #317 | Tragic 28.8% |
| Basques | 0.1 /100 | #318 | Tragic 28.8% |
| Slovaks | 0.1 /100 | #319 | Tragic 28.9% |
| British | 0.1 /100 | #320 | Tragic 28.9% |
| Welsh | 0.1 /100 | #321 | Tragic 28.9% |
| Immigrants | Singapore | 0.1 /100 | #322 | Tragic 28.9% |
| Norwegians | 0.1 /100 | #323 | Tragic 29.0% |
| Croatians | 0.0 /100 | #324 | Tragic 29.0% |
| Hungarians | 0.0 /100 | #325 | Tragic 29.0% |
| Immigrants | Belgium | 0.0 /100 | #326 | Tragic 29.0% |
| Immigrants | Iran | 0.0 /100 | #327 | Tragic 29.1% |
| Scandinavians | 0.0 /100 | #328 | Tragic 29.1% |
| Scottish | 0.0 /100 | #329 | Tragic 29.1% |
| Germans | 0.0 /100 | #330 | Tragic 29.2% |
Demographics Similar to Immigrants from Bolivia by Wage/Income Gap
In terms of wage/income gap, the demographic groups most similar to Immigrants from Bolivia are Immigrants from Serbia (26.0%, a difference of 0.070%), Immigrants from Kazakhstan (26.0%, a difference of 0.090%), Guamanian/Chamorro (26.0%, a difference of 0.11%), Mexican (26.0%, a difference of 0.14%), and Samoan (26.0%, a difference of 0.15%).
| Demographics | Rating | Rank | Wage/Income Gap |
| Alaskan Athabascans | 50.0 /100 | #174 | Average 25.8% |
| Sri Lankans | 47.0 /100 | #175 | Average 25.8% |
| Paraguayans | 46.7 /100 | #176 | Average 25.8% |
| Cambodians | 45.1 /100 | #177 | Average 25.8% |
| Chinese | 42.0 /100 | #178 | Average 25.9% |
| Samoans | 38.6 /100 | #179 | Fair 26.0% |
| Guamanians/Chamorros | 38.0 /100 | #180 | Fair 26.0% |
| Immigrants | Bolivia | 36.4 /100 | #181 | Fair 26.0% |
| Immigrants | Serbia | 35.4 /100 | #182 | Fair 26.0% |
| Immigrants | Kazakhstan | 35.2 /100 | #183 | Fair 26.0% |
| Mexicans | 34.4 /100 | #184 | Fair 26.0% |
| Pakistanis | 33.7 /100 | #185 | Fair 26.1% |
| Immigrants | Indonesia | 32.5 /100 | #186 | Fair 26.1% |
| Palestinians | 29.9 /100 | #187 | Fair 26.1% |
| Immigrants | Egypt | 29.9 /100 | #188 | Fair 26.1% |