Malaysian Self-Care Disability
COMPARE
Malaysian
Select to Compare
Self-Care Disability
Malaysian Self-Care Disability
2.5%
SELF-CARE DISABILITY
7.7/ 100
METRIC RATING
209th/ 347
METRIC RANK
Malaysian Self-Care Disability Correlation Chart
The statistical analysis conducted on geographies consisting of 225,907,967 people shows a poor positive correlation between the proportion of Malaysians and percentage of population with self-care disability in the United States with a correlation coefficient (R) of 0.176 and weighted average of 2.5%. On average, for every 1% (one percent) increase in Malaysians within a typical geography, there is an increase of 0.064% in percentage of population with self-care disability.
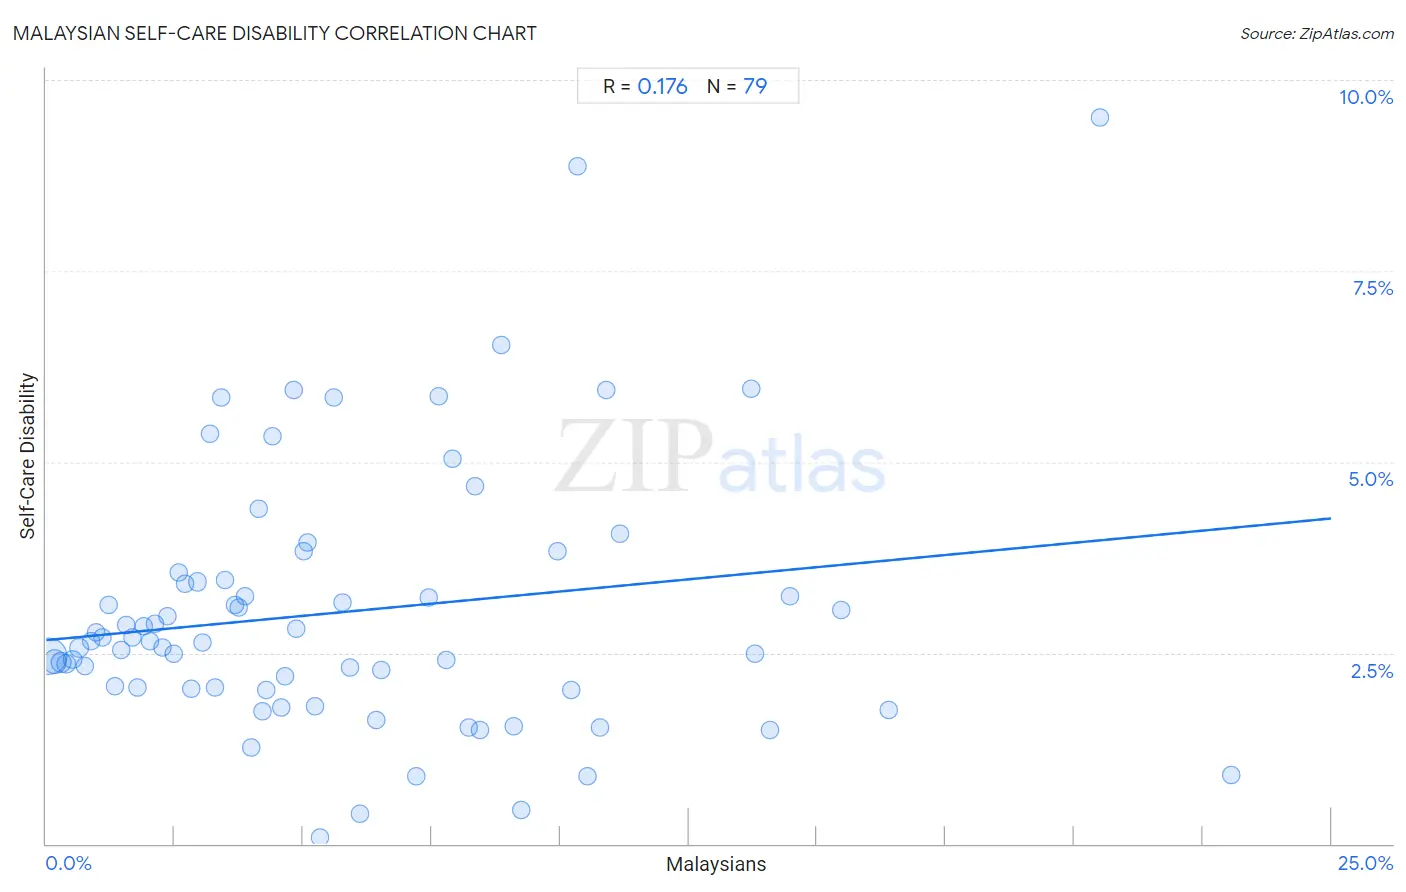
It is essential to understand that the correlation between the percentage of Malaysians and percentage of population with self-care disability does not imply a direct cause-and-effect relationship. It remains uncertain whether the presence of Malaysians influences an upward or downward trend in the level of percentage of population with self-care disability within an area, or if Malaysians simply ended up residing in those areas with higher or lower levels of percentage of population with self-care disability due to other factors.
Demographics Similar to Malaysians by Self-Care Disability
In terms of self-care disability, the demographic groups most similar to Malaysians are Central American (2.5%, a difference of 0.15%), Panamanian (2.5%, a difference of 0.23%), French (2.5%, a difference of 0.31%), Alaskan Athabascan (2.5%, a difference of 0.37%), and Immigrants from Russia (2.5%, a difference of 0.46%).
| Demographics | Rating | Rank | Self-Care Disability |
| Slovaks | 12.6 /100 | #202 | Poor 2.5% |
| Immigrants from Lebanon | 12.4 /100 | #203 | Poor 2.5% |
| Immigrants from Bahamas | 11.9 /100 | #204 | Poor 2.5% |
| Immigrants from Russia | 11.0 /100 | #205 | Poor 2.5% |
| Alaskan Athabascans | 10.4 /100 | #206 | Poor 2.5% |
| French | 9.9 /100 | #207 | Tragic 2.5% |
| Central Americans | 8.7 /100 | #208 | Tragic 2.5% |
| Malaysians | 7.7 /100 | #209 | Tragic 2.5% |
| Panamanians | 6.4 /100 | #210 | Tragic 2.5% |
| Native Hawaiians | 5.1 /100 | #211 | Tragic 2.6% |
| Samoans | 5.1 /100 | #212 | Tragic 2.6% |
| Ecuadorians | 4.7 /100 | #213 | Tragic 2.6% |
| Immigrants from Honduras | 4.7 /100 | #214 | Tragic 2.6% |
| Immigrants from Thailand | 4.5 /100 | #215 | Tragic 2.6% |
| Whites/Caucasians | 4.4 /100 | #216 | Tragic 2.6% |
Malaysian Self-Care Disability Correlation Summary
| Measurement | Malaysian Data | Self-Care Disability Data |
| Minimum | 0.044% | 0.090% |
| Maximum | 23.0% | 9.5% |
| Range | 23.0% | 9.4% |
| Mean | 5.8% | 3.0% |
| Median | 4.6% | 2.7% |
| Interquartile 25% (IQ1) | 2.3% | 2.0% |
| Interquartile 75% (IQ3) | 8.3% | 3.5% |
| Interquartile Range (IQR) | 6.1% | 1.4% |
| Standard Deviation (Sample) | 4.8% | 1.7% |
| Standard Deviation (Population) | 4.7% | 1.7% |
Correlation Details
| Malaysian Percentile | Sample Size | Self-Care Disability |
[ 0.0% - 0.5% ] 0.044% | 134,116,665 | 2.5% |
[ 0.0% - 0.5% ] 0.17% | 38,927,107 | 2.4% |
[ 0.0% - 0.5% ] 0.28% | 19,132,763 | 2.4% |
[ 0.0% - 0.5% ] 0.39% | 9,268,771 | 2.4% |
[ 0.5% - 1.0% ] 0.52% | 6,686,412 | 2.4% |
[ 0.5% - 1.0% ] 0.64% | 3,610,094 | 2.6% |
[ 0.5% - 1.0% ] 0.74% | 2,415,084 | 2.3% |
[ 0.5% - 1.0% ] 0.87% | 1,943,182 | 2.7% |
[ 0.5% - 1.0% ] 0.97% | 2,172,635 | 2.8% |
[ 1.0% - 1.5% ] 1.10% | 874,457 | 2.7% |
[ 1.0% - 1.5% ] 1.21% | 1,578,390 | 3.1% |
[ 1.0% - 1.5% ] 1.34% | 867,638 | 2.1% |
[ 1.0% - 1.5% ] 1.45% | 459,711 | 2.5% |
[ 1.5% - 2.0% ] 1.55% | 603,029 | 2.9% |
[ 1.5% - 2.0% ] 1.67% | 754,994 | 2.7% |
[ 1.5% - 2.0% ] 1.77% | 298,809 | 2.1% |
[ 1.5% - 2.0% ] 1.89% | 272,020 | 2.8% |
[ 2.0% - 2.5% ] 2.02% | 202,170 | 2.7% |
[ 2.0% - 2.5% ] 2.11% | 273,549 | 2.9% |
[ 2.0% - 2.5% ] 2.26% | 94,545 | 2.6% |
[ 2.0% - 2.5% ] 2.36% | 188,385 | 3.0% |
[ 2.0% - 2.5% ] 2.48% | 210,482 | 2.5% |
[ 2.5% - 3.0% ] 2.58% | 112,120 | 3.6% |
[ 2.5% - 3.0% ] 2.71% | 42,764 | 3.4% |
[ 2.5% - 3.0% ] 2.83% | 163,649 | 2.0% |
[ 2.5% - 3.0% ] 2.94% | 195,032 | 3.4% |
[ 3.0% - 3.5% ] 3.03% | 102,188 | 2.6% |
[ 3.0% - 3.5% ] 3.20% | 27,756 | 5.4% |
[ 3.0% - 3.5% ] 3.28% | 43,282 | 2.1% |
[ 3.0% - 3.5% ] 3.41% | 3,282 | 5.8% |
[ 3.0% - 3.5% ] 3.47% | 27,020 | 3.5% |
[ 3.5% - 4.0% ] 3.66% | 18,104 | 3.1% |
[ 3.5% - 4.0% ] 3.75% | 32,829 | 3.1% |
[ 3.5% - 4.0% ] 3.86% | 19,242 | 3.2% |
[ 3.5% - 4.0% ] 3.99% | 1,605 | 1.3% |
[ 4.0% - 4.5% ] 4.14% | 1,955 | 4.4% |
[ 4.0% - 4.5% ] 4.20% | 1,857 | 1.7% |
[ 4.0% - 4.5% ] 4.28% | 11,587 | 2.0% |
[ 4.0% - 4.5% ] 4.41% | 3,927 | 5.3% |
[ 4.5% - 5.0% ] 4.58% | 19,389 | 1.8% |
[ 4.5% - 5.0% ] 4.64% | 2,845 | 2.2% |
[ 4.5% - 5.0% ] 4.82% | 2,262 | 5.9% |
[ 4.5% - 5.0% ] 4.87% | 6,511 | 2.8% |
[ 5.0% - 5.5% ] 5.02% | 7,674 | 3.8% |
[ 5.0% - 5.5% ] 5.09% | 2,063 | 3.9% |
[ 5.0% - 5.5% ] 5.23% | 9,415 | 1.8% |
[ 5.0% - 5.5% ] 5.33% | 3,582 | 0.090% |
[ 5.5% - 6.0% ] 5.59% | 1,574 | 5.8% |
[ 5.5% - 6.0% ] 5.78% | 1,316 | 3.2% |
[ 5.5% - 6.0% ] 5.91% | 8,788 | 2.3% |
[ 6.0% - 6.5% ] 6.10% | 541 | 0.39% |
[ 6.0% - 6.5% ] 6.42% | 4,001 | 1.6% |
[ 6.5% - 7.0% ] 6.52% | 3,005 | 2.3% |
[ 7.0% - 7.5% ] 7.19% | 1,460 | 0.88% |
[ 7.0% - 7.5% ] 7.44% | 900 | 3.2% |
[ 7.5% - 8.0% ] 7.63% | 22,539 | 5.9% |
[ 7.5% - 8.0% ] 7.79% | 578 | 2.4% |
[ 7.5% - 8.0% ] 7.91% | 278 | 5.0% |
[ 8.0% - 8.5% ] 8.21% | 15,355 | 1.5% |
[ 8.0% - 8.5% ] 8.33% | 216 | 4.7% |
[ 8.0% - 8.5% ] 8.44% | 2,819 | 1.5% |
[ 8.5% - 9.0% ] 8.85% | 610 | 6.5% |
[ 9.0% - 9.5% ] 9.10% | 13,838 | 1.5% |
[ 9.0% - 9.5% ] 9.24% | 1,407 | 0.45% |
[ 9.5% - 10.0% ] 9.95% | 191 | 3.8% |
[ 10.0% - 10.5% ] 10.21% | 2,595 | 2.0% |
[ 10.0% - 10.5% ] 10.34% | 861 | 8.9% |
[ 10.5% - 11.0% ] 10.54% | 389 | 0.88% |
[ 10.5% - 11.0% ] 10.78% | 2,207 | 1.5% |
[ 10.5% - 11.0% ] 10.90% | 991 | 5.9% |
[ 11.0% - 11.5% ] 11.17% | 197 | 4.1% |
[ 13.5% - 14.0% ] 13.71% | 2,984 | 6.0% |
[ 13.5% - 14.0% ] 13.79% | 1,900 | 2.5% |
[ 14.0% - 14.5% ] 14.08% | 71 | 1.5% |
[ 14.0% - 14.5% ] 14.47% | 1,693 | 3.2% |
[ 15.0% - 15.5% ] 15.46% | 679 | 3.1% |
[ 16.0% - 16.5% ] 16.39% | 61 | 1.8% |
[ 20.0% - 20.5% ] 20.49% | 527 | 9.5% |
[ 23.0% - 23.5% ] 23.05% | 564 | 0.90% |