Malaysian vs Norwegian Wage/Income Gap
COMPARE
Malaysian
Norwegian
Wage/Income Gap
Wage/Income Gap Comparison
Malaysians
Norwegians
25.0%
WAGE/INCOME GAP
84.9/ 100
METRIC RATING
147th/ 347
METRIC RANK
29.0%
WAGE/INCOME GAP
0.1/ 100
METRIC RATING
323rd/ 347
METRIC RANK
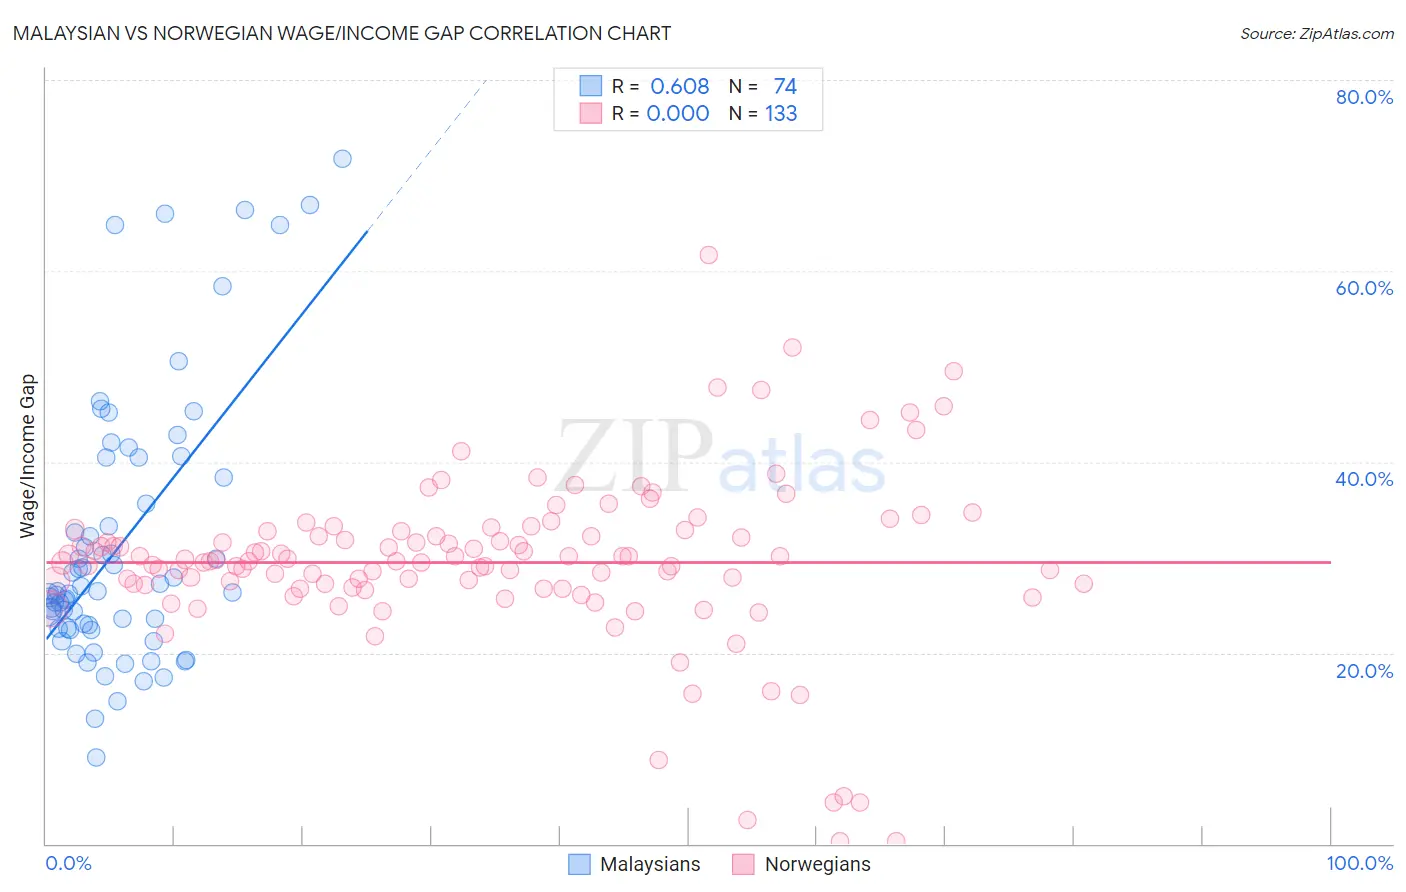
Malaysian vs Norwegian Wage/Income Gap Correlation Chart
The statistical analysis conducted on geographies consisting of 226,066,613 people shows a significant positive correlation between the proportion of Malaysians and wage/income gap percentage in the United States with a correlation coefficient (R) of 0.608 and weighted average of 25.0%. Similarly, the statistical analysis conducted on geographies consisting of 531,696,723 people shows no correlation between the proportion of Norwegians and wage/income gap percentage in the United States with a correlation coefficient (R) of 0.000 and weighted average of 29.0%, a difference of 15.6%.
Wage/Income Gap Correlation Summary
| Measurement | Malaysian | Norwegian |
| Minimum | 9.0% | 0.24% |
| Maximum | 71.7% | 61.7% |
| Range | 62.7% | 61.5% |
| Mean | 31.3% | 29.5% |
| Median | 26.4% | 29.7% |
| Interquartile 25% (IQ1) | 22.6% | 27.0% |
| Interquartile 75% (IQ3) | 38.4% | 32.7% |
| Interquartile Range (IQR) | 15.8% | 5.7% |
| Standard Deviation (Sample) | 14.0% | 9.0% |
| Standard Deviation (Population) | 13.9% | 8.9% |
Similar Demographics by Wage/Income Gap
Demographics Similar to Malaysians by Wage/Income Gap
In terms of wage/income gap, the demographic groups most similar to Malaysians are Comanche (25.0%, a difference of 0.030%), South American (25.0%, a difference of 0.030%), Iroquois (25.1%, a difference of 0.14%), Chippewa (25.0%, a difference of 0.27%), and Immigrants from Peru (25.1%, a difference of 0.28%).
| Demographics | Rating | Rank | Wage/Income Gap |
| Immigrants | Nepal | 89.3 /100 | #140 | Excellent 24.9% |
| Hawaiians | 89.3 /100 | #141 | Excellent 24.9% |
| Afghans | 88.1 /100 | #142 | Excellent 24.9% |
| Immigrants | Uganda | 88.0 /100 | #143 | Excellent 24.9% |
| Chippewa | 86.9 /100 | #144 | Excellent 25.0% |
| Comanche | 85.2 /100 | #145 | Excellent 25.0% |
| South Americans | 85.2 /100 | #146 | Excellent 25.0% |
| Malaysians | 84.9 /100 | #147 | Excellent 25.0% |
| Iroquois | 83.9 /100 | #148 | Excellent 25.1% |
| Immigrants | Peru | 82.6 /100 | #149 | Excellent 25.1% |
| Immigrants | Immigrants | 82.3 /100 | #150 | Excellent 25.1% |
| Taiwanese | 81.6 /100 | #151 | Excellent 25.1% |
| Uruguayans | 81.3 /100 | #152 | Excellent 25.2% |
| Blackfeet | 78.1 /100 | #153 | Good 25.2% |
| Immigrants | Northern Africa | 78.1 /100 | #154 | Good 25.2% |
Demographics Similar to Norwegians by Wage/Income Gap
In terms of wage/income gap, the demographic groups most similar to Norwegians are Immigrants from Singapore (28.9%, a difference of 0.11%), Croatian (29.0%, a difference of 0.12%), Welsh (28.9%, a difference of 0.13%), British (28.9%, a difference of 0.19%), and Slovak (28.9%, a difference of 0.25%).
| Demographics | Rating | Rank | Wage/Income Gap |
| Lithuanians | 0.1 /100 | #316 | Tragic 28.7% |
| Belgians | 0.1 /100 | #317 | Tragic 28.8% |
| Basques | 0.1 /100 | #318 | Tragic 28.8% |
| Slovaks | 0.1 /100 | #319 | Tragic 28.9% |
| British | 0.1 /100 | #320 | Tragic 28.9% |
| Welsh | 0.1 /100 | #321 | Tragic 28.9% |
| Immigrants | Singapore | 0.1 /100 | #322 | Tragic 28.9% |
| Norwegians | 0.1 /100 | #323 | Tragic 29.0% |
| Croatians | 0.0 /100 | #324 | Tragic 29.0% |
| Hungarians | 0.0 /100 | #325 | Tragic 29.0% |
| Immigrants | Belgium | 0.0 /100 | #326 | Tragic 29.0% |
| Immigrants | Iran | 0.0 /100 | #327 | Tragic 29.1% |
| Scandinavians | 0.0 /100 | #328 | Tragic 29.1% |
| Scottish | 0.0 /100 | #329 | Tragic 29.1% |
| Germans | 0.0 /100 | #330 | Tragic 29.2% |