Malaysian Disability
COMPARE
Malaysian
Select to Compare
Disability
Malaysian Disability
12.2%
DISABILITY
2.5/ 100
METRIC RATING
231st/ 347
METRIC RANK
Malaysian Disability Correlation Chart
The statistical analysis conducted on geographies consisting of 226,067,054 people shows no correlation between the proportion of Malaysians and percentage of population with a disability in the United States with a correlation coefficient (R) of 0.023 and weighted average of 12.2%. On average, for every 1% (one percent) increase in Malaysians within a typical geography, there is an increase of 0.023% in percentage of population with a disability.
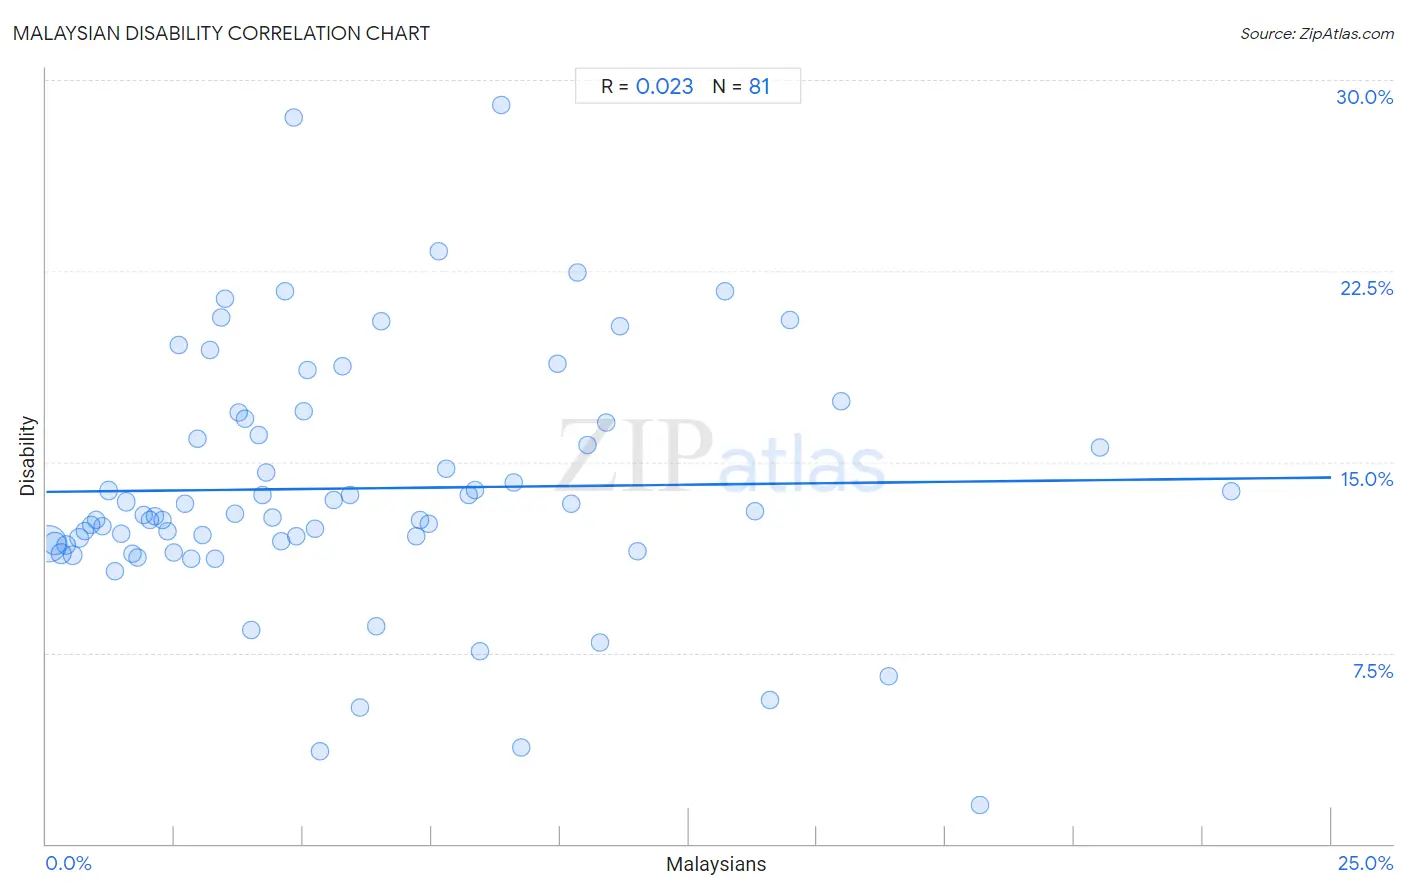
It is essential to understand that the correlation between the percentage of Malaysians and percentage of population with a disability does not imply a direct cause-and-effect relationship. It remains uncertain whether the presence of Malaysians influences an upward or downward trend in the level of percentage of population with a disability within an area, or if Malaysians simply ended up residing in those areas with higher or lower levels of percentage of population with a disability due to other factors.
Demographics Similar to Malaysians by Disability
In terms of disability, the demographic groups most similar to Malaysians are Italian (12.2%, a difference of 0.010%), Samoan (12.2%, a difference of 0.030%), Bahamian (12.2%, a difference of 0.10%), Inupiat (12.2%, a difference of 0.11%), and West Indian (12.2%, a difference of 0.13%).
| Demographics | Rating | Rank | Disability |
| Mexicans | 3.7 /100 | #224 | Tragic 12.1% |
| Senegalese | 3.5 /100 | #225 | Tragic 12.1% |
| Jamaicans | 3.3 /100 | #226 | Tragic 12.1% |
| Alsatians | 3.3 /100 | #227 | Tragic 12.1% |
| West Indians | 2.9 /100 | #228 | Tragic 12.2% |
| Inupiat | 2.8 /100 | #229 | Tragic 12.2% |
| Samoans | 2.6 /100 | #230 | Tragic 12.2% |
| Malaysians | 2.5 /100 | #231 | Tragic 12.2% |
| Italians | 2.5 /100 | #232 | Tragic 12.2% |
| Bahamians | 2.3 /100 | #233 | Tragic 12.2% |
| Japanese | 2.3 /100 | #234 | Tragic 12.2% |
| Yup'ik | 2.2 /100 | #235 | Tragic 12.2% |
| Chinese | 2.0 /100 | #236 | Tragic 12.2% |
| Immigrants from Congo | 1.9 /100 | #237 | Tragic 12.2% |
| Norwegians | 1.9 /100 | #238 | Tragic 12.2% |
Malaysian Disability Correlation Summary
| Measurement | Malaysian Data | Disability Data |
| Minimum | 0.044% | 1.5% |
| Maximum | 23.0% | 29.0% |
| Range | 23.0% | 27.5% |
| Mean | 6.0% | 14.0% |
| Median | 4.6% | 12.9% |
| Interquartile 25% (IQ1) | 2.3% | 11.8% |
| Interquartile 75% (IQ3) | 8.6% | 16.6% |
| Interquartile Range (IQR) | 6.3% | 4.9% |
| Standard Deviation (Sample) | 4.9% | 5.0% |
| Standard Deviation (Population) | 4.9% | 4.9% |
Correlation Details
| Malaysian Percentile | Sample Size | Disability |
[ 0.0% - 0.5% ] 0.044% | 134,165,595 | 11.8% |
[ 0.0% - 0.5% ] 0.17% | 38,957,173 | 11.8% |
[ 0.0% - 0.5% ] 0.28% | 19,161,388 | 11.4% |
[ 0.0% - 0.5% ] 0.39% | 9,276,206 | 11.7% |
[ 0.5% - 1.0% ] 0.52% | 6,689,184 | 11.4% |
[ 0.5% - 1.0% ] 0.64% | 3,614,637 | 12.0% |
[ 0.5% - 1.0% ] 0.74% | 2,415,084 | 12.3% |
[ 0.5% - 1.0% ] 0.87% | 1,944,615 | 12.5% |
[ 0.5% - 1.0% ] 0.97% | 2,172,635 | 12.7% |
[ 1.0% - 1.5% ] 1.09% | 884,487 | 12.5% |
[ 1.0% - 1.5% ] 1.21% | 1,578,390 | 13.9% |
[ 1.0% - 1.5% ] 1.34% | 872,983 | 10.7% |
[ 1.0% - 1.5% ] 1.45% | 464,532 | 12.2% |
[ 1.5% - 2.0% ] 1.55% | 612,695 | 13.4% |
[ 1.5% - 2.0% ] 1.67% | 755,233 | 11.4% |
[ 1.5% - 2.0% ] 1.77% | 300,959 | 11.2% |
[ 1.5% - 2.0% ] 1.89% | 272,589 | 12.9% |
[ 2.0% - 2.5% ] 2.02% | 202,170 | 12.7% |
[ 2.0% - 2.5% ] 2.11% | 273,549 | 12.8% |
[ 2.0% - 2.5% ] 2.26% | 94,545 | 12.7% |
[ 2.0% - 2.5% ] 2.36% | 190,057 | 12.3% |
[ 2.0% - 2.5% ] 2.48% | 210,482 | 11.4% |
[ 2.5% - 3.0% ] 2.58% | 112,120 | 19.6% |
[ 2.5% - 3.0% ] 2.71% | 42,764 | 13.3% |
[ 2.5% - 3.0% ] 2.83% | 163,649 | 11.2% |
[ 2.5% - 3.0% ] 2.94% | 195,376 | 15.9% |
[ 3.0% - 3.5% ] 3.03% | 102,188 | 12.1% |
[ 3.0% - 3.5% ] 3.20% | 27,756 | 19.4% |
[ 3.0% - 3.5% ] 3.28% | 43,282 | 11.2% |
[ 3.0% - 3.5% ] 3.41% | 4,012 | 20.7% |
[ 3.0% - 3.5% ] 3.47% | 27,020 | 21.4% |
[ 3.5% - 4.0% ] 3.66% | 18,104 | 12.9% |
[ 3.5% - 4.0% ] 3.75% | 33,043 | 16.9% |
[ 3.5% - 4.0% ] 3.86% | 19,242 | 16.7% |
[ 3.5% - 4.0% ] 3.99% | 1,706 | 8.4% |
[ 4.0% - 4.5% ] 4.14% | 1,955 | 16.1% |
[ 4.0% - 4.5% ] 4.20% | 1,857 | 13.7% |
[ 4.0% - 4.5% ] 4.28% | 11,587 | 14.6% |
[ 4.0% - 4.5% ] 4.41% | 3,927 | 12.8% |
[ 4.5% - 5.0% ] 4.58% | 19,389 | 11.9% |
[ 4.5% - 5.0% ] 4.64% | 2,845 | 21.7% |
[ 4.5% - 5.0% ] 4.82% | 2,262 | 28.5% |
[ 4.5% - 5.0% ] 4.87% | 6,511 | 12.1% |
[ 5.0% - 5.5% ] 5.02% | 7,674 | 17.0% |
[ 5.0% - 5.5% ] 5.09% | 2,063 | 18.6% |
[ 5.0% - 5.5% ] 5.22% | 10,527 | 12.4% |
[ 5.0% - 5.5% ] 5.33% | 3,582 | 3.6% |
[ 5.5% - 6.0% ] 5.59% | 1,826 | 13.5% |
[ 5.5% - 6.0% ] 5.78% | 1,316 | 18.8% |
[ 5.5% - 6.0% ] 5.91% | 8,788 | 13.7% |
[ 6.0% - 6.5% ] 6.10% | 541 | 5.4% |
[ 6.0% - 6.5% ] 6.42% | 4,001 | 8.5% |
[ 6.5% - 7.0% ] 6.52% | 3,005 | 20.5% |
[ 7.0% - 7.5% ] 7.19% | 1,460 | 12.1% |
[ 7.0% - 7.5% ] 7.27% | 55 | 12.7% |
[ 7.0% - 7.5% ] 7.44% | 900 | 12.6% |
[ 7.5% - 8.0% ] 7.63% | 22,539 | 23.3% |
[ 7.5% - 8.0% ] 7.79% | 578 | 14.7% |
[ 8.0% - 8.5% ] 8.21% | 15,355 | 13.7% |
[ 8.0% - 8.5% ] 8.33% | 216 | 13.9% |
[ 8.0% - 8.5% ] 8.44% | 2,819 | 7.5% |
[ 8.5% - 9.0% ] 8.85% | 610 | 29.0% |
[ 9.0% - 9.5% ] 9.10% | 13,838 | 14.2% |
[ 9.0% - 9.5% ] 9.24% | 1,407 | 3.8% |
[ 9.5% - 10.0% ] 9.95% | 191 | 18.8% |
[ 10.0% - 10.5% ] 10.21% | 2,595 | 13.4% |
[ 10.0% - 10.5% ] 10.34% | 861 | 22.4% |
[ 10.5% - 11.0% ] 10.54% | 389 | 15.7% |
[ 10.5% - 11.0% ] 10.78% | 2,207 | 7.9% |
[ 10.5% - 11.0% ] 10.90% | 991 | 16.5% |
[ 11.0% - 11.5% ] 11.17% | 197 | 20.3% |
[ 11.0% - 11.5% ] 11.49% | 87 | 11.5% |
[ 13.0% - 13.5% ] 13.21% | 106 | 21.7% |
[ 13.5% - 14.0% ] 13.79% | 1,900 | 13.1% |
[ 14.0% - 14.5% ] 14.08% | 71 | 5.6% |
[ 14.0% - 14.5% ] 14.47% | 1,693 | 20.6% |
[ 15.0% - 15.5% ] 15.46% | 679 | 17.4% |
[ 16.0% - 16.5% ] 16.39% | 61 | 6.6% |
[ 18.0% - 18.5% ] 18.16% | 1,052 | 1.5% |
[ 20.0% - 20.5% ] 20.49% | 527 | 15.6% |
[ 23.0% - 23.5% ] 23.05% | 564 | 13.8% |