Malaysian Disability Age 5 to 17
COMPARE
Malaysian
Select to Compare
Disability Age 5 to 17
Malaysian Disability Age 5 to 17
5.8%
DISABILITY | AGE 5 TO 17
3.4/ 100
METRIC RATING
235th/ 347
METRIC RANK
Malaysian Disability Age 5 to 17 Correlation Chart
The statistical analysis conducted on geographies consisting of 225,304,568 people shows a mild positive correlation between the proportion of Malaysians and percentage of population with a disability between the ages 5 and 17 in the United States with a correlation coefficient (R) of 0.318 and weighted average of 5.8%. On average, for every 1% (one percent) increase in Malaysians within a typical geography, there is an increase of 0.56% in percentage of population with a disability between the ages 5 and 17.
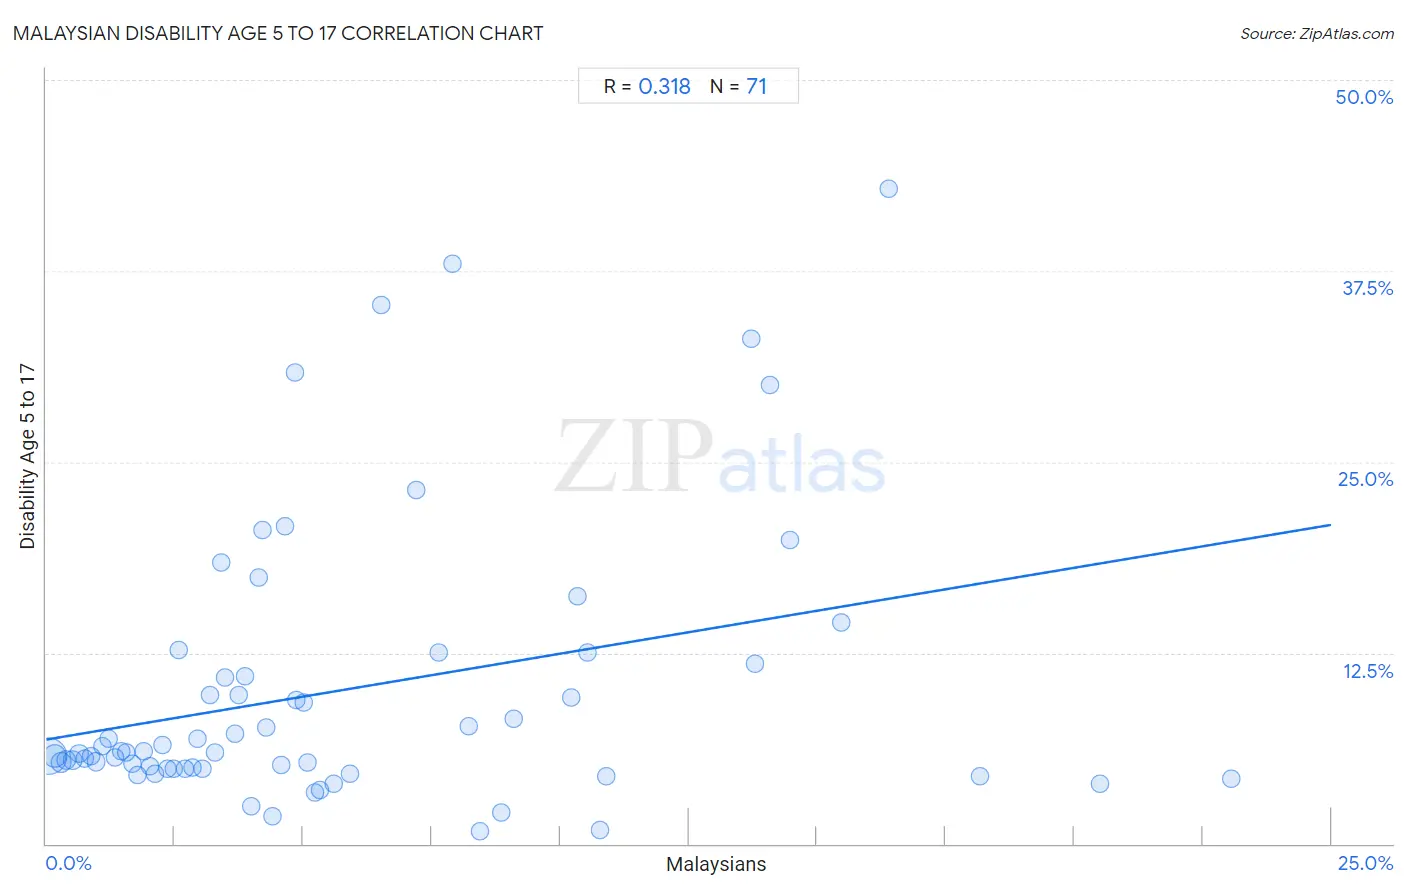
It is essential to understand that the correlation between the percentage of Malaysians and percentage of population with a disability between the ages 5 and 17 does not imply a direct cause-and-effect relationship. It remains uncertain whether the presence of Malaysians influences an upward or downward trend in the level of percentage of population with a disability between the ages 5 and 17 within an area, or if Malaysians simply ended up residing in those areas with higher or lower levels of percentage of population with a disability between the ages 5 and 17 due to other factors.
Demographics Similar to Malaysians by Disability Age 5 to 17
In terms of disability age 5 to 17, the demographic groups most similar to Malaysians are Immigrants from Kenya (5.8%, a difference of 0.010%), Immigrants from West Indies (5.8%, a difference of 0.050%), Immigrants from Brazil (5.8%, a difference of 0.060%), Immigrants from Laos (5.8%, a difference of 0.14%), and Sudanese (5.8%, a difference of 0.21%).
| Demographics | Rating | Rank | Disability Age 5 to 17 |
| Haitians | 4.8 /100 | #228 | Tragic 5.8% |
| Bangladeshis | 4.8 /100 | #229 | Tragic 5.8% |
| Ghanaians | 4.7 /100 | #230 | Tragic 5.8% |
| Europeans | 4.5 /100 | #231 | Tragic 5.8% |
| Immigrants from Laos | 3.8 /100 | #232 | Tragic 5.8% |
| Immigrants from West Indies | 3.5 /100 | #233 | Tragic 5.8% |
| Immigrants from Kenya | 3.4 /100 | #234 | Tragic 5.8% |
| Malaysians | 3.4 /100 | #235 | Tragic 5.8% |
| Immigrants from Brazil | 3.2 /100 | #236 | Tragic 5.8% |
| Sudanese | 2.9 /100 | #237 | Tragic 5.8% |
| Hungarians | 2.6 /100 | #238 | Tragic 5.8% |
| German Russians | 2.4 /100 | #239 | Tragic 5.9% |
| West Indians | 2.4 /100 | #240 | Tragic 5.9% |
| Immigrants from Caribbean | 2.1 /100 | #241 | Tragic 5.9% |
| Spaniards | 2.0 /100 | #242 | Tragic 5.9% |
Malaysian Disability Age 5 to 17 Correlation Summary
| Measurement | Malaysian Data | Disability Age 5 to 17 Data |
| Minimum | 0.044% | 0.84% |
| Maximum | 23.0% | 42.9% |
| Range | 23.0% | 42.0% |
| Mean | 5.7% | 10.0% |
| Median | 4.1% | 6.0% |
| Interquartile 25% (IQ1) | 2.0% | 4.9% |
| Interquartile 75% (IQ3) | 8.2% | 11.8% |
| Interquartile Range (IQR) | 6.2% | 6.9% |
| Standard Deviation (Sample) | 5.2% | 9.1% |
| Standard Deviation (Population) | 5.1% | 9.1% |
Correlation Details
| Malaysian Percentile | Sample Size | Disability Age 5 to 17 |
[ 0.0% - 0.5% ] 0.044% | 133,966,874 | 5.7% |
[ 0.0% - 0.5% ] 0.17% | 38,823,965 | 5.7% |
[ 0.0% - 0.5% ] 0.28% | 19,053,373 | 5.3% |
[ 0.0% - 0.5% ] 0.39% | 9,218,257 | 5.5% |
[ 0.5% - 1.0% ] 0.52% | 6,611,403 | 5.5% |
[ 0.5% - 1.0% ] 0.64% | 3,593,871 | 5.9% |
[ 0.5% - 1.0% ] 0.74% | 2,389,805 | 5.6% |
[ 0.5% - 1.0% ] 0.87% | 1,934,568 | 5.7% |
[ 0.5% - 1.0% ] 0.97% | 2,158,060 | 5.4% |
[ 1.0% - 1.5% ] 1.09% | 869,646 | 6.4% |
[ 1.0% - 1.5% ] 1.21% | 1,572,012 | 6.9% |
[ 1.0% - 1.5% ] 1.34% | 865,522 | 5.7% |
[ 1.0% - 1.5% ] 1.45% | 452,014 | 6.0% |
[ 1.5% - 2.0% ] 1.55% | 612,443 | 5.9% |
[ 1.5% - 2.0% ] 1.67% | 751,590 | 5.2% |
[ 1.5% - 2.0% ] 1.77% | 291,225 | 4.5% |
[ 1.5% - 2.0% ] 1.89% | 272,020 | 6.1% |
[ 2.0% - 2.5% ] 2.03% | 190,958 | 5.0% |
[ 2.0% - 2.5% ] 2.11% | 270,031 | 4.5% |
[ 2.0% - 2.5% ] 2.26% | 79,087 | 6.5% |
[ 2.0% - 2.5% ] 2.36% | 188,385 | 4.9% |
[ 2.0% - 2.5% ] 2.48% | 210,284 | 4.9% |
[ 2.5% - 3.0% ] 2.58% | 112,120 | 12.7% |
[ 2.5% - 3.0% ] 2.70% | 39,246 | 4.9% |
[ 2.5% - 3.0% ] 2.83% | 159,317 | 5.0% |
[ 2.5% - 3.0% ] 2.94% | 194,051 | 6.8% |
[ 3.0% - 3.5% ] 3.03% | 102,188 | 4.9% |
[ 3.0% - 3.5% ] 3.20% | 27,756 | 9.7% |
[ 3.0% - 3.5% ] 3.28% | 43,282 | 6.0% |
[ 3.0% - 3.5% ] 3.41% | 3,282 | 18.4% |
[ 3.0% - 3.5% ] 3.47% | 25,765 | 10.9% |
[ 3.5% - 4.0% ] 3.66% | 17,776 | 7.2% |
[ 3.5% - 4.0% ] 3.75% | 32,829 | 9.7% |
[ 3.5% - 4.0% ] 3.87% | 14,117 | 11.0% |
[ 3.5% - 4.0% ] 3.99% | 1,605 | 2.5% |
[ 4.0% - 4.5% ] 4.14% | 1,955 | 17.4% |
[ 4.0% - 4.5% ] 4.20% | 1,857 | 20.5% |
[ 4.0% - 4.5% ] 4.27% | 10,155 | 7.6% |
[ 4.0% - 4.5% ] 4.41% | 3,927 | 1.8% |
[ 4.5% - 5.0% ] 4.58% | 18,993 | 5.1% |
[ 4.5% - 5.0% ] 4.64% | 2,845 | 20.8% |
[ 4.5% - 5.0% ] 4.83% | 1,924 | 30.8% |
[ 4.5% - 5.0% ] 4.87% | 6,511 | 9.4% |
[ 5.0% - 5.5% ] 5.02% | 7,674 | 9.3% |
[ 5.0% - 5.5% ] 5.09% | 2,063 | 5.3% |
[ 5.0% - 5.5% ] 5.23% | 7,838 | 3.4% |
[ 5.0% - 5.5% ] 5.33% | 3,582 | 3.5% |
[ 5.5% - 6.0% ] 5.59% | 1,574 | 3.9% |
[ 5.5% - 6.0% ] 5.91% | 8,465 | 4.6% |
[ 6.5% - 7.0% ] 6.52% | 3,005 | 35.3% |
[ 7.0% - 7.5% ] 7.19% | 1,460 | 23.2% |
[ 7.5% - 8.0% ] 7.63% | 22,539 | 12.6% |
[ 7.5% - 8.0% ] 7.91% | 278 | 37.9% |
[ 8.0% - 8.5% ] 8.21% | 15,355 | 7.7% |
[ 8.0% - 8.5% ] 8.44% | 2,819 | 0.84% |
[ 8.5% - 9.0% ] 8.85% | 610 | 2.0% |
[ 9.0% - 9.5% ] 9.10% | 13,838 | 8.2% |
[ 10.0% - 10.5% ] 10.21% | 2,595 | 9.6% |
[ 10.0% - 10.5% ] 10.34% | 861 | 16.2% |
[ 10.5% - 11.0% ] 10.54% | 389 | 12.5% |
[ 10.5% - 11.0% ] 10.78% | 2,207 | 0.93% |
[ 10.5% - 11.0% ] 10.90% | 991 | 4.4% |
[ 13.5% - 14.0% ] 13.71% | 2,984 | 33.1% |
[ 13.5% - 14.0% ] 13.79% | 1,900 | 11.8% |
[ 14.0% - 14.5% ] 14.08% | 71 | 30.0% |
[ 14.0% - 14.5% ] 14.47% | 1,693 | 19.9% |
[ 15.0% - 15.5% ] 15.46% | 679 | 14.5% |
[ 16.0% - 16.5% ] 16.39% | 61 | 42.9% |
[ 18.0% - 18.5% ] 18.16% | 1,052 | 4.4% |
[ 20.0% - 20.5% ] 20.49% | 527 | 3.9% |
[ 23.0% - 23.5% ] 23.05% | 564 | 4.2% |