Japanese 2 or more Vehicles in Household
COMPARE
Japanese
Select to Compare
2 or more Vehicles in Household
Japanese 2 or more Vehicles in Household
57.5%
2+ VEHICLES AVAILABLE
98.0/ 100
METRIC RATING
110th/ 347
METRIC RANK
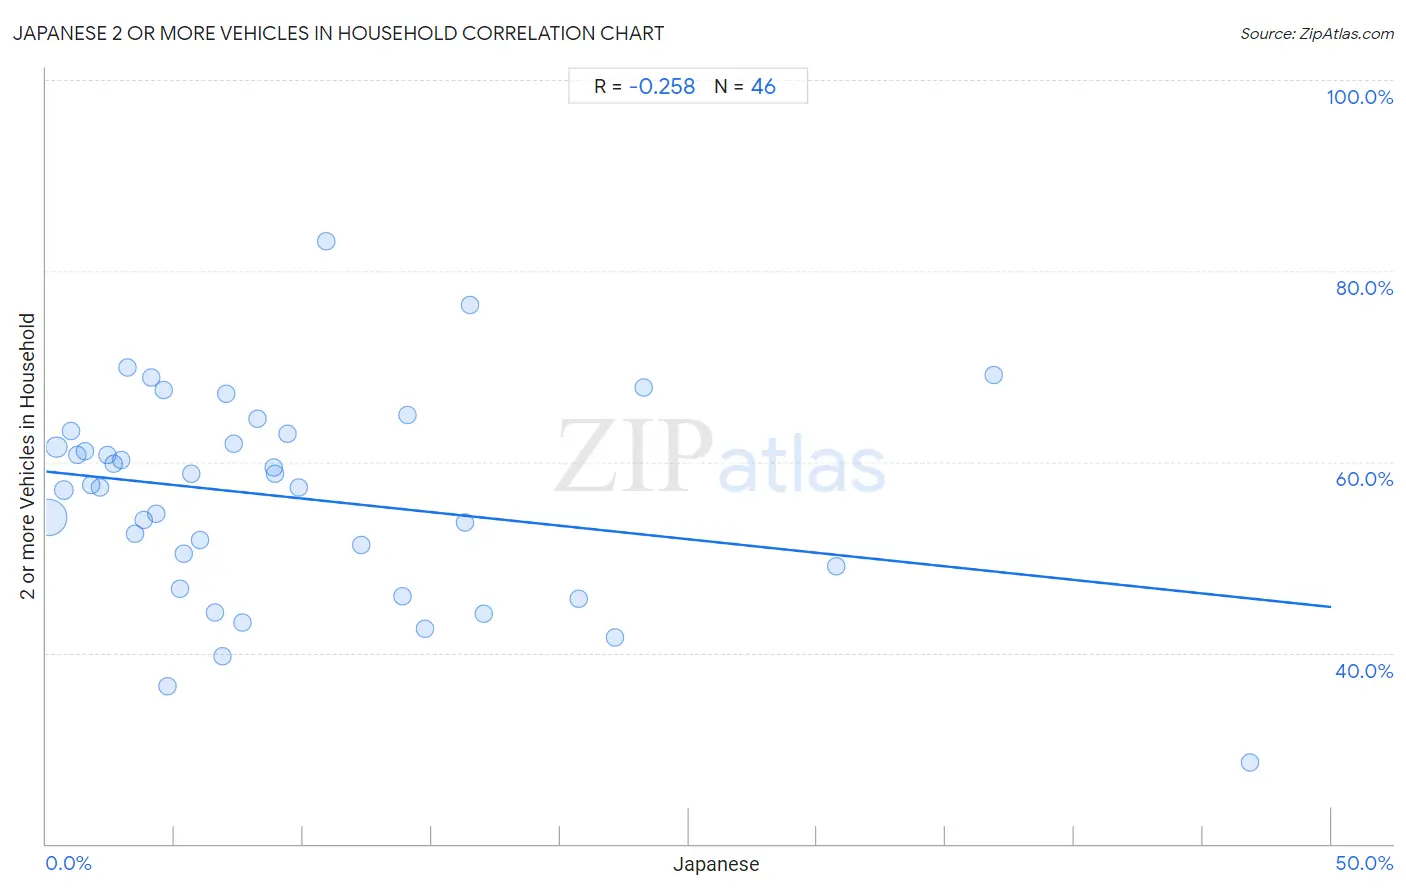
Japanese 2 or more Vehicles in Household Correlation Chart
The statistical analysis conducted on geographies consisting of 249,112,523 people shows a weak negative correlation between the proportion of Japanese and percentage of households with 2 or more vehicles available in the United States with a correlation coefficient (R) of -0.258 and weighted average of 57.5%. On average, for every 1% (one percent) increase in Japanese within a typical geography, there is a decrease of 0.28% in percentage of households with 2 or more vehicles available.
It is essential to understand that the correlation between the percentage of Japanese and percentage of households with 2 or more vehicles available does not imply a direct cause-and-effect relationship. It remains uncertain whether the presence of Japanese influences an upward or downward trend in the level of percentage of households with 2 or more vehicles available within an area, or if Japanese simply ended up residing in those areas with higher or lower levels of percentage of households with 2 or more vehicles available due to other factors.
Demographics Similar to Japanese by 2 or more Vehicles in Household
In terms of 2 or more vehicles in household, the demographic groups most similar to Japanese are Immigrants from North America (57.5%, a difference of 0.020%), Greek (57.5%, a difference of 0.030%), Pueblo (57.5%, a difference of 0.040%), Immigrants from Canada (57.5%, a difference of 0.050%), and Immigrants from Netherlands (57.5%, a difference of 0.060%).
| Demographics | Rating | Rank | 2 or more Vehicles in Household |
| Jordanians | 98.2 /100 | #103 | Exceptional 57.6% |
| Immigrants from Indonesia | 98.2 /100 | #104 | Exceptional 57.6% |
| Immigrants from Korea | 98.2 /100 | #105 | Exceptional 57.6% |
| Immigrants from Oceania | 98.2 /100 | #106 | Exceptional 57.5% |
| Immigrants from Netherlands | 98.2 /100 | #107 | Exceptional 57.5% |
| Immigrants from Canada | 98.1 /100 | #108 | Exceptional 57.5% |
| Immigrants from North America | 98.1 /100 | #109 | Exceptional 57.5% |
| Japanese | 98.0 /100 | #110 | Exceptional 57.5% |
| Greeks | 98.0 /100 | #111 | Exceptional 57.5% |
| Pueblo | 98.0 /100 | #112 | Exceptional 57.5% |
| Zimbabweans | 96.9 /100 | #113 | Exceptional 57.2% |
| Immigrants from Lebanon | 96.8 /100 | #114 | Exceptional 57.2% |
| Chippewa | 96.6 /100 | #115 | Exceptional 57.2% |
| Immigrants from Jordan | 96.6 /100 | #116 | Exceptional 57.2% |
| Iraqis | 95.8 /100 | #117 | Exceptional 57.1% |
Japanese 2 or more Vehicles in Household Correlation Summary
| Measurement | Japanese Data | 2 or more Vehicles in Household Data |
| Minimum | 0.089% | 28.6% |
| Maximum | 46.8% | 83.2% |
| Range | 46.7% | 54.6% |
| Mean | 9.6% | 56.3% |
| Median | 6.7% | 57.5% |
| Interquartile 25% (IQ1) | 3.1% | 49.1% |
| Interquartile 75% (IQ3) | 13.9% | 63.0% |
| Interquartile Range (IQR) | 10.7% | 13.8% |
| Standard Deviation (Sample) | 9.8% | 10.8% |
| Standard Deviation (Population) | 9.7% | 10.6% |
Correlation Details
| Japanese Percentile | Sample Size | 2 or more Vehicles in Household |
[ 0.0% - 0.5% ] 0.089% | 191,183,997 | 54.2% |
[ 0.0% - 0.5% ] 0.39% | 32,054,798 | 61.5% |
[ 0.5% - 1.0% ] 0.68% | 11,045,686 | 57.1% |
[ 0.5% - 1.0% ] 0.95% | 5,586,569 | 63.3% |
[ 1.0% - 1.5% ] 1.23% | 2,870,552 | 60.7% |
[ 1.5% - 2.0% ] 1.51% | 1,547,927 | 61.2% |
[ 1.5% - 2.0% ] 1.77% | 1,268,098 | 57.6% |
[ 2.0% - 2.5% ] 2.09% | 537,392 | 57.3% |
[ 2.0% - 2.5% ] 2.37% | 401,596 | 60.7% |
[ 2.5% - 3.0% ] 2.64% | 83,848 | 59.9% |
[ 2.5% - 3.0% ] 2.93% | 184,192 | 60.2% |
[ 3.0% - 3.5% ] 3.15% | 208,256 | 69.9% |
[ 3.0% - 3.5% ] 3.43% | 147,545 | 52.5% |
[ 3.5% - 4.0% ] 3.81% | 638,209 | 53.9% |
[ 4.0% - 4.5% ] 4.08% | 60,107 | 68.9% |
[ 4.0% - 4.5% ] 4.30% | 473,882 | 54.6% |
[ 4.5% - 5.0% ] 4.57% | 68,008 | 67.6% |
[ 4.5% - 5.0% ] 4.73% | 74,695 | 36.5% |
[ 5.0% - 5.5% ] 5.21% | 41,240 | 46.7% |
[ 5.0% - 5.5% ] 5.34% | 5,600 | 50.4% |
[ 5.5% - 6.0% ] 5.64% | 104,251 | 58.7% |
[ 5.5% - 6.0% ] 5.96% | 70,818 | 51.8% |
[ 6.5% - 7.0% ] 6.54% | 65,608 | 44.2% |
[ 6.5% - 7.0% ] 6.83% | 278 | 39.6% |
[ 6.5% - 7.0% ] 6.99% | 41,001 | 67.1% |
[ 7.0% - 7.5% ] 7.29% | 645 | 61.9% |
[ 7.5% - 8.0% ] 7.63% | 59,153 | 43.2% |
[ 8.0% - 8.5% ] 8.23% | 4,145 | 64.5% |
[ 8.5% - 9.0% ] 8.84% | 12,324 | 59.5% |
[ 8.5% - 9.0% ] 8.91% | 11,678 | 58.8% |
[ 9.0% - 9.5% ] 9.38% | 2,911 | 63.0% |
[ 9.5% - 10.0% ] 9.81% | 59,460 | 57.4% |
[ 10.5% - 11.0% ] 10.92% | 27,848 | 83.2% |
[ 12.0% - 12.5% ] 12.25% | 2,588 | 51.3% |
[ 13.5% - 14.0% ] 13.86% | 114,737 | 45.9% |
[ 14.0% - 14.5% ] 14.08% | 1,364 | 64.9% |
[ 14.5% - 15.0% ] 14.72% | 2,215 | 42.5% |
[ 16.0% - 16.5% ] 16.30% | 411 | 53.7% |
[ 16.0% - 16.5% ] 16.47% | 868 | 76.4% |
[ 17.0% - 17.5% ] 17.03% | 7,118 | 44.1% |
[ 20.5% - 21.0% ] 20.70% | 1,575 | 45.6% |
[ 22.0% - 22.5% ] 22.12% | 5,478 | 41.6% |
[ 23.0% - 23.5% ] 23.24% | 921 | 67.8% |
[ 30.5% - 31.0% ] 30.73% | 32,323 | 49.1% |
[ 36.5% - 37.0% ] 36.86% | 388 | 69.0% |
[ 46.5% - 47.0% ] 46.82% | 220 | 28.6% |