Immigrants from Uruguay vs Lumbee Wage/Income Gap
COMPARE
Immigrants from Uruguay
Lumbee
Wage/Income Gap
Wage/Income Gap Comparison
Immigrants from Uruguay
Lumbee
24.6%
WAGE/INCOME GAP
93.8/ 100
METRIC RATING
126th/ 347
METRIC RANK
21.3%
WAGE/INCOME GAP
100.0/ 100
METRIC RATING
40th/ 347
METRIC RANK
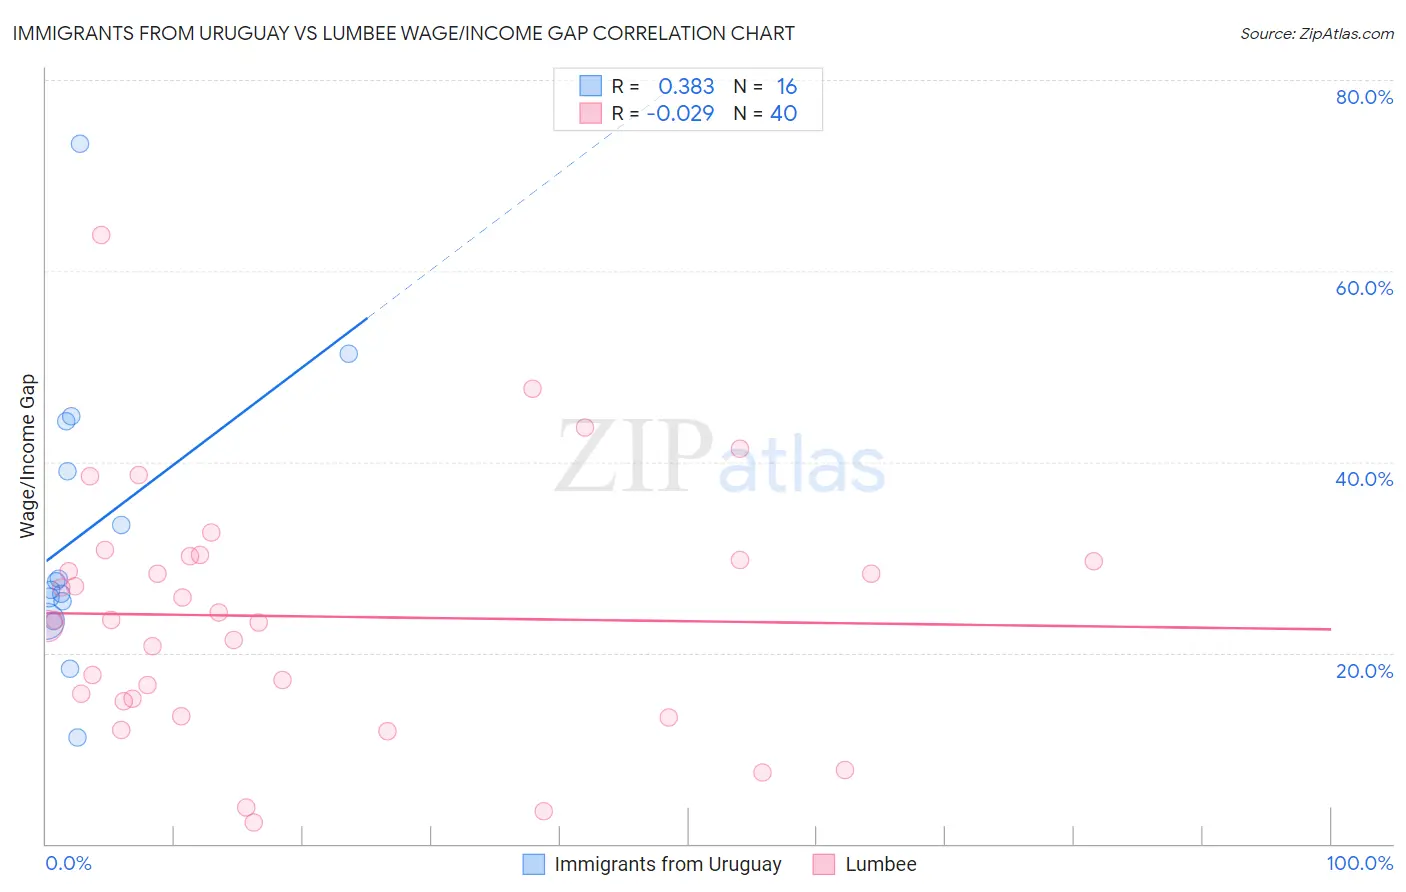
Immigrants from Uruguay vs Lumbee Wage/Income Gap Correlation Chart
The statistical analysis conducted on geographies consisting of 133,243,894 people shows a mild positive correlation between the proportion of Immigrants from Uruguay and wage/income gap percentage in the United States with a correlation coefficient (R) of 0.383 and weighted average of 24.6%. Similarly, the statistical analysis conducted on geographies consisting of 92,243,625 people shows no correlation between the proportion of Lumbee and wage/income gap percentage in the United States with a correlation coefficient (R) of -0.029 and weighted average of 21.3%, a difference of 15.5%.
Wage/Income Gap Correlation Summary
| Measurement | Immigrants from Uruguay | Lumbee |
| Minimum | 11.1% | 2.2% |
| Maximum | 73.3% | 63.8% |
| Range | 62.2% | 61.6% |
| Mean | 32.6% | 23.8% |
| Median | 27.1% | 23.4% |
| Interquartile 25% (IQ1) | 24.3% | 15.1% |
| Interquartile 75% (IQ3) | 41.7% | 29.9% |
| Interquartile Range (IQR) | 17.3% | 14.8% |
| Standard Deviation (Sample) | 15.1% | 12.8% |
| Standard Deviation (Population) | 14.6% | 12.6% |
Similar Demographics by Wage/Income Gap
Demographics Similar to Immigrants from Uruguay by Wage/Income Gap
In terms of wage/income gap, the demographic groups most similar to Immigrants from Uruguay are German Russian (24.6%, a difference of 0.010%), Spanish American (24.6%, a difference of 0.020%), Immigrants from South America (24.6%, a difference of 0.040%), Immigrants from Central America (24.6%, a difference of 0.070%), and Yup'ik (24.7%, a difference of 0.13%).
| Demographics | Rating | Rank | Wage/Income Gap |
| Kenyans | 95.8 /100 | #119 | Exceptional 24.5% |
| Cree | 95.6 /100 | #120 | Exceptional 24.5% |
| Immigrants | Thailand | 94.9 /100 | #121 | Exceptional 24.5% |
| Apache | 94.8 /100 | #122 | Exceptional 24.5% |
| Natives/Alaskans | 94.6 /100 | #123 | Exceptional 24.6% |
| Immigrants | South America | 93.9 /100 | #124 | Exceptional 24.6% |
| Spanish Americans | 93.8 /100 | #125 | Exceptional 24.6% |
| Immigrants | Uruguay | 93.8 /100 | #126 | Exceptional 24.6% |
| German Russians | 93.7 /100 | #127 | Exceptional 24.6% |
| Immigrants | Central America | 93.5 /100 | #128 | Exceptional 24.6% |
| Yup'ik | 93.3 /100 | #129 | Exceptional 24.7% |
| Alsatians | 93.2 /100 | #130 | Exceptional 24.7% |
| Immigrants | Philippines | 93.0 /100 | #131 | Exceptional 24.7% |
| Immigrants | Costa Rica | 92.4 /100 | #132 | Exceptional 24.7% |
| Colombians | 92.4 /100 | #133 | Exceptional 24.7% |
Demographics Similar to Lumbee by Wage/Income Gap
In terms of wage/income gap, the demographic groups most similar to Lumbee are Colville (21.3%, a difference of 0.20%), Immigrants from Belize (21.3%, a difference of 0.31%), Immigrants from Somalia (21.2%, a difference of 0.36%), Belizean (21.2%, a difference of 0.43%), and Somali (21.2%, a difference of 0.45%).
| Demographics | Rating | Rank | Wage/Income Gap |
| Immigrants | Bahamas | 100.0 /100 | #33 | Exceptional 21.1% |
| Pima | 100.0 /100 | #34 | Exceptional 21.1% |
| Somalis | 100.0 /100 | #35 | Exceptional 21.2% |
| Belizeans | 100.0 /100 | #36 | Exceptional 21.2% |
| Immigrants | Somalia | 100.0 /100 | #37 | Exceptional 21.2% |
| Immigrants | Belize | 100.0 /100 | #38 | Exceptional 21.3% |
| Colville | 100.0 /100 | #39 | Exceptional 21.3% |
| Lumbee | 100.0 /100 | #40 | Exceptional 21.3% |
| Liberians | 100.0 /100 | #41 | Exceptional 21.4% |
| Immigrants | Sierra Leone | 100.0 /100 | #42 | Exceptional 21.4% |
| Sierra Leoneans | 100.0 /100 | #43 | Exceptional 21.4% |
| Immigrants | Eritrea | 100.0 /100 | #44 | Exceptional 21.4% |
| U.S. Virgin Islanders | 100.0 /100 | #45 | Exceptional 21.5% |
| Immigrants | Ethiopia | 100.0 /100 | #46 | Exceptional 21.6% |
| Immigrants | Congo | 100.0 /100 | #47 | Exceptional 21.7% |